October 23 Morning Watch; completed October 22 daily history with earlier and later separately recorded premarket SPY observations
Later recorded SPY premarket trading broke the completed October 22 low. The preserved SPY chart shows an earlier premarket observation, and a separate note records the later $760.58 check. Other dated levels and issuer results retain their recorded-session bases.
$SPYSPY — October 23 Morning Watch — daily 762.56Earlier recorded October 23 premarket observationEarlier recorded October 23 premarket $762.56 against completed October 22 close $763.96 and low $761.17. The later verified $760.58 observation is recorded separately; it is not plotted on this earlier chart.
- October 22 intraday low
- 761.17
- October 22 intraday high
- 767.71
- 20-day SMA through October 22
- 770.72
- 50-day SMA through October 22
- 768.17
- 200-day SMA through October 22
- 726.65
- October 21 intraday low
- 768.40
Levels measured over Completed US regular-session history through October 22. Recorded October 23 premarket observations are separate and appear only where corroborated.. A level measured over a different window can be a different number.
 See the chart on X →
$SPYSPY — October 23 Morning Watch — later premarket update 760.58Later recorded October 23 premarket observation; separate from completed daily candleLater recorded October 23 Nasdaq premarket $760.58 (Yahoo near $760.51), below the completed October 22 intraday low $761.17. That low now needs a reclaim, then a daily retest and close above. This later point is not plotted in the preserved earlier chart.
- October 22 intraday low; reclaim test
- 761.17
- October 22 regular close
- 763.96
- 50-day SMA through October 22
- 768.17
- 20-day SMA through October 22
- 770.72
Levels measured over Completed regular-session history through October 22. Earlier chart point $762.56 and later observed $760.58 are separate recorded premarket observations; neither enters the October 22 candle.. A level measured over a different window can be a different number.
See the chart on X →$QQQQQQ — October 23 Morning Watch — daily 704.84October 23 recorded premarket observationSeparate October 23 premarket 704.84 versus completed October 22 close 704.47; daily bars remain completed through October 22.
- October 22 intraday low
- 701.90
- October 22 intraday high
- 715.43
- 20-day SMA through October 22
- 737.24
- 50-day SMA through October 22
- 726.37
- 200-day SMA through October 22
- 676.89
- October 21 intraday low
- 719.71
Levels measured over Completed US regular-session history through October 22. Recorded October 23 premarket observations are separate and appear only where corroborated.. A level measured over a different window can be a different number.
 See the chart on X →
$QQQQQQ — October 23 Morning Watch — closing context 704.47October 22 completed regular-session closeCompleted closing decline October 6 to October 16, separate rebound to October 21, then a new lower close October 22. October 23 premarket is excluded.
Levels measured over Completed regular-session closes only; premarket excluded.. A level measured over a different window can be a different number.
 See the chart on X →
$MXLMXL — October 23 Morning Watch — daily 65.28October 22 completed regular-session closeNo verified October 23 premarket quote shown; completed October 22 close 65.28.
- October 22 intraday low
- 63.49
- October 22 intraday high
- 71.60
- 20-day SMA through October 22
- 88.73
- 50-day SMA through October 22
- 77.83
- 200-day SMA through October 22
- 58.42
- October 21 intraday low
- 73.58
Levels measured over Completed US regular-session history through October 22. Recorded October 23 premarket observations are separate and appear only where corroborated.. A level measured over a different window can be a different number.
 See the chart on X →
$NEMNEM — October 23 Morning Watch — daily 114.11October 22 completed regular-session closeNo verified October 23 premarket quote shown; completed October 22 close 114.11.
- October 22 intraday low
- 111.41
- October 22 intraday high
- 114.31
- 20-day SMA through October 22
- 116.20
- 50-day SMA through October 22
- 121.77
- 200-day SMA through October 22
- 112.45
- October 21 intraday low
- 115.44
- October 14 intraday low
- 109.84
Levels measured over Completed US regular-session history through October 22. Recorded October 23 premarket observations are separate and appear only where corroborated.. A level measured over a different window can be a different number.
 See the chart on X →
$WDCWDC — October 23 Morning Watch — daily 341.96October 23 recorded premarket observationSeparate October 23 premarket 341.96 versus completed October 22 close 354.19; daily bars remain completed through October 22. The recorded premarket point was below the October 22 low.
- October 22 intraday low
- 348.23
- October 22 intraday high
- 367.34
- 20-day SMA through October 22
- 400.70
- 50-day SMA through October 22
- 435.87
- 200-day SMA through October 22
- 413.93
- October 21 intraday low
- 367.13
Levels measured over Completed US regular-session history through October 22. Recorded October 23 premarket observations are separate and appear only where corroborated.. A level measured over a different window can be a different number.
 See the chart on X →
$BEBE — October 23 Morning Watch — daily 208.80October 23 recorded premarket observationSeparate October 23 premarket 208.80 versus completed October 22 close 217.77; daily bars remain completed through October 22. The later recorded premarket point was below the October 22 low.
- October 22 intraday low
- 210.74
- October 22 intraday high
- 229.91
- 20-day SMA through October 22
- 262.07
- 50-day SMA through October 22
- 249.16
- 200-day SMA through October 22
- 218.86
- October 21 intraday low
- 229.30
Levels measured over Completed US regular-session history through October 22. Recorded October 23 premarket observations are separate and appear only where corroborated.. A level measured over a different window can be a different number.
 See the chart on X →
$MXLMXL — October 23 Morning Watch — earnings 65.28October 22 completed regular-session close; graphic retains its stated financial periodSeptember 2026 quarter issuer financial results; keep reported results, cash flows and future guidance in their separate scopes.
Levels measured over Issuer financial period shown on chart; completed price history through October 22. No live quote implied.. A level measured over a different window can be a different number.
 See the chart on X →
$MXLMXL — October 23 Morning Watch — cash and outlook 65.28October 22 completed regular-session close; graphic retains its stated financial periodSeptember 2026 quarter issuer financial results; keep reported results, cash flows and future guidance in their separate scopes.
Levels measured over Issuer financial period shown on chart; completed price history through October 22. No live quote implied.. A level measured over a different window can be a different number.
 See the chart on X →
$NEMNEM — October 23 Morning Watch — earnings 114.11October 22 completed regular-session close; graphic retains its stated financial periodSeptember 2026 quarter issuer financial results; keep reported results, cash flows and future guidance in their separate scopes.
Levels measured over Issuer financial period shown on chart; completed price history through October 22. No live quote implied.. A level measured over a different window can be a different number.
 See the chart on X →
$NEMNEM — October 23 Morning Watch — cash and outlook 114.11October 22 completed regular-session close; graphic retains its stated financial periodSeptember 2026 quarter issuer financial results; keep reported results, cash flows and future guidance in their separate scopes.
Levels measured over Issuer financial period shown on chart; completed price history through October 22. No live quote implied.. A level measured over a different window can be a different number.
 See the chart on X →
$WDCWDC — October 23 Morning Watch — earnings 354.19October 22 completed regular-session close; graphic retains its stated financial periodfiscal 2027 first quarter issuer financial results; keep reported results, cash flows and future guidance in their separate scopes.
Levels measured over Issuer financial period shown on chart; completed price history through October 22. No live quote implied.. A level measured over a different window can be a different number.
 See the chart on X →
$WDCWDC — October 23 Morning Watch — cash and outlook 354.19October 22 completed regular-session close; graphic retains its stated financial periodfiscal 2027 first quarter issuer financial results; keep reported results, cash flows and future guidance in their separate scopes.
Levels measured over Issuer financial period shown on chart; completed price history through October 22. No live quote implied.. A level measured over a different window can be a different number.
 See the chart on X →
$BEBE — October 23 Morning Watch — earnings 217.77October 22 completed regular-session close; graphic retains its stated financial periodSeptember 2026 quarter issuer financial results; keep reported results, cash flows and future guidance in their separate scopes.
Levels measured over Issuer financial period shown on chart; completed price history through October 22. No live quote implied.. A level measured over a different window can be a different number.
 See the chart on X →
$BEBE — October 23 Morning Watch — cash and outlook 217.77October 22 completed regular-session close; graphic retains its stated financial periodSeptember 2026 quarter issuer financial results; keep reported results, cash flows and future guidance in their separate scopes.
Levels measured over Issuer financial period shown on chart; completed price history through October 22. No live quote implied.. A level measured over a different window can be a different number.
 See the chart on X →
$AXPAmerican Express — October 23 midday chart 312.93Recorded October 23 regular-session observation; separate from completed daily candleRecorded $312.93 regular-session observation below completed October 22 low $322.47 and below the 50- and 200-day averages. The dated low needs a reclaim.
- October 22 intraday low; reclaim test
- 322.47
- October 22 intraday high
- 326.27
- 20-day SMA through October 22
- 309.90
- 50-day SMA through October 22
- 319.80
- 200-day SMA through October 22
- 327.62
Levels measured over Completed US regular-session candles and SMAs through October 22; October 23 quote separate. A level measured over a different window can be a different number.
 See the chart on X →
$SLBSLB — October 23 midday chart 53.29Recorded October 23 regular-session observation; separate from completed daily candleRecorded $53.29 regular-session observation above completed October 22 high $51.16 and above the 50- and 200-day averages. The dated high is a nearby retest level.
- October 22 intraday high; nearby retest
- 51.16
- October 22 regular-session close
- 49.55
- 20-day SMA through October 22
- 49.44
- 50-day SMA through October 22
- 52.45
- 200-day SMA through October 22
- 51.20
Levels measured over Completed US regular-session candles and SMAs through October 22; October 23 quote separate. A level measured over a different window can be a different number.
 See the chart on X →
$NEMNewmont — October 23 midday chart 109.78Recorded October 23 regular-session observation; separate from completed daily candleRecorded $109.78 regular-session observation below completed October 22 low $111.41 and below the 50- and 200-day averages. The dated low needs a reclaim.
- October 22 intraday low; reclaim test
- 111.41
- October 22 intraday high
- 114.31
- 20-day SMA through October 22
- 116.20
- 50-day SMA through October 22
- 121.77
- 200-day SMA through October 22
- 112.45
Levels measured over Completed US regular-session candles and SMAs through October 22; October 23 quote separate. A level measured over a different window can be a different number.
 See the chart on X →
$NVDANvidia — October 23 midday chart 211.60Recorded October 23 regular-session observation; separate from completed daily candleRecorded $211.60 regular-session observation below the completed 50-day average $222.77, above the 200-day average $203.56, and between the October 22 intraday low $211.26 and high $218.88.
- October 22 intraday low
- 211.26
- October 22 intraday high
- 218.88
- 20-day SMA through October 22
- 226.25
- 50-day SMA through October 22
- 222.77
- 200-day SMA through October 22
- 203.56
Levels measured over Completed US regular-session candles and SMAs through October 22; October 23 quote separate. A level measured over a different window can be a different number.
 See the chart on X →
$MXLMaxLinear — October 23 midday chart 63.17Recorded October 23 regular-session observation; separate from completed daily candleSeparate October 23 regular-session $63.17, below completed October 22 low $63.49, below the 50-day $77.83 and above the 200-day $58.42. A daily reclaim of the old low would matter.
- October 22 intraday low; reclaim test
- 63.49
- October 22 intraday high
- 71.60
- 20-day SMA through October 22
- 88.73
- 50-day SMA through October 22
- 77.83
- 200-day SMA through October 22
- 58.42
- October 22 regular close
- 65.28
Levels measured over Completed US regular-session candles and SMAs through October 22; October 23 observed quote shown separately. A level measured over a different window can be a different number.
 See the chart on X →
$WDCWDC - October 23 WDC-earnings 354.19October 22 completed regular close; price reference only for a financial or comparative chartFiscal-first-quarter revenue reached $4.381 billion and GAAP operating income $2.046 billion; the prior-year operating result was also positive.
Levels measured over Western Digital fiscal Q1 2027, three months ended October 2, 2026. A level measured over a different window can be a different number.
 See the chart on X →
$WDCWDC - October 23 WDC-cash-outlook 354.19October 22 completed regular close; price reference only for a financial or comparative chartFiscal-first-quarter operating cash of $1.604 billion less $227 million of net property and equipment purchases yielded $1.377 billion of issuer-defined free cash flow.
Levels measured over Western Digital fiscal Q1 2027, three months ended October 2, 2026. A level measured over a different window can be a different number.
 See the chart on X →
$WDCWDC - October 23 WDC-daily 344.89Recorded, corroborated October 23 regular-session observation; separate from completed daily candlesRecorded October 23 US regular-session observation $344.89 (-2.63%) was below the October 22 intraday low $348.23 and completed 20-, 50- and 200-session averages; a daily retest and close above the old low is needed for a reclaim.
- 20-session SMA through October 22
- 400.70
- 50-session SMA through October 22
- 435.87
- 200-session SMA through October 22
- 413.93
- October 22 intraday high
- 367.34
- October 22 intraday low
- 348.23
Levels measured over Completed daily history through October 22; separate October 23 regular observation. A level measured over a different window can be a different number.
 See the chart on X →
$WDCWDC - October 23 WDC-six-month-context 354.19October 22 completed regular close; October 23 observation is excluded from the completed closing-price series and shown separatelyThe full dated decline and later rebound are separate phases; the October 23 observation is excluded from the completed-close context.
Levels measured over Completed daily closes through October 22; separate later regular-session observation. A level measured over a different window can be a different number.
 See the chart on X →
$BEBE - October 23 BE-VRT-income 217.77October 22 completed regular close; price reference only for a financial or comparative chartBloom's September Q3 and Vertiv's June Q2 are different reporting windows; both latest reports show GAAP operating profit, but raw totals do not rank the shares.
Levels measured over Bloom Q3 ended September 30; Vertiv Q2 ended June 30; prior-year comparisons are issuer-specific. A level measured over a different window can be a different number.
 See the chart on X →
$VRTVRT - October 23 BE-VRT-income 195.59October 22 completed regular close; price reference only for a financial or comparative chartBloom's September Q3 and Vertiv's June Q2 are different reporting windows; both latest reports show GAAP operating profit, but raw totals do not rank the shares.
Levels measured over Bloom Q3 ended September 30; Vertiv Q2 ended June 30; prior-year comparisons are issuer-specific. A level measured over a different window can be a different number.
See the chart on X →$BEBE - October 23 BE-VRT-cash 217.77October 22 completed regular close; price reference only for a financial or comparative chartBloom's Q3 operating cash was negative $27.1 million; operating cash less $153.5 million of property and equipment purchases was negative $180.6 million of our arithmetic, not issuer-defined free cash flow.
Levels measured over Bloom Q3 ended September 30; Vertiv Q2 ended June 30; cash definitions differ. A level measured over a different window can be a different number.
 See the chart on X →
$VRTVRT - October 23 BE-VRT-cash 195.59October 22 completed regular close; price reference only for a financial or comparative chartVertiv's Q2 operating cash was $1.100 billion and its issuer-defined adjusted free cash flow was $925.3 million; Bloom's cash period and definition differ.
Levels measured over Bloom Q3 ended September 30; Vertiv Q2 ended June 30; cash definitions differ. A level measured over a different window can be a different number.
See the chart on X →$BEBE - October 23 BE-daily 191.33Recorded, corroborated October 23 regular-session observation; separate from completed daily candlesRecorded October 23 US regular-session observation $191.33 (-12.14%) was below the October 22 intraday low $210.74 and completed 20-, 50- and 200-session averages; that low now needs a daily reclaim.
- 20-session SMA through October 22
- 262.07
- 50-session SMA through October 22
- 249.16
- 200-session SMA through October 22
- 218.86
- October 22 intraday high
- 229.91
- October 22 intraday low
- 210.74
Levels measured over Completed daily history through October 22; separate October 23 regular observation. A level measured over a different window can be a different number.
 See the chart on X →
$VRTVRT - October 23 VRT-daily 195.59Recorded, corroborated October 23 regular-session observation; separate from completed daily candlesRecorded October 23 US regular-session observation $195.59 was roughly unchanged from the October 22 completed close, inside its $193.14-$204.00 intraday range and below completed 20-, 50- and 200-session averages.
- 20-session SMA through October 22
- 233.15
- 50-session SMA through October 22
- 249.56
- 200-session SMA through October 22
- 268.96
- October 22 intraday high
- 204.00
- October 22 intraday low
- 193.14
Levels measured over Completed daily history through October 22; separate October 23 regular observation. A level measured over a different window can be a different number.
 See the chart on X →
$BEBE - October 23 BE-VRT-relative 217.77October 22 completed regular close; price reference only for a financial or comparative chartBE and VRT are compared across the same completed closing-price window; dividends are excluded. October 23 observations are excluded from that closing-price series and shown separately.
Levels measured over Identical completed daily closing dates ending October 22; price-only index, first close rebased to 100. A level measured over a different window can be a different number.
 See the chart on X →
$VRTVRT - October 23 BE-VRT-relative 195.59October 22 completed regular close; price reference only for a financial or comparative chartBE and VRT are compared across the same completed closing-price window; dividends are excluded. October 23 observations are excluded from that closing-price series and shown separately.
Levels measured over Identical completed daily closing dates ending October 22; price-only index, first close rebased to 100. A level measured over a different window can be a different number.
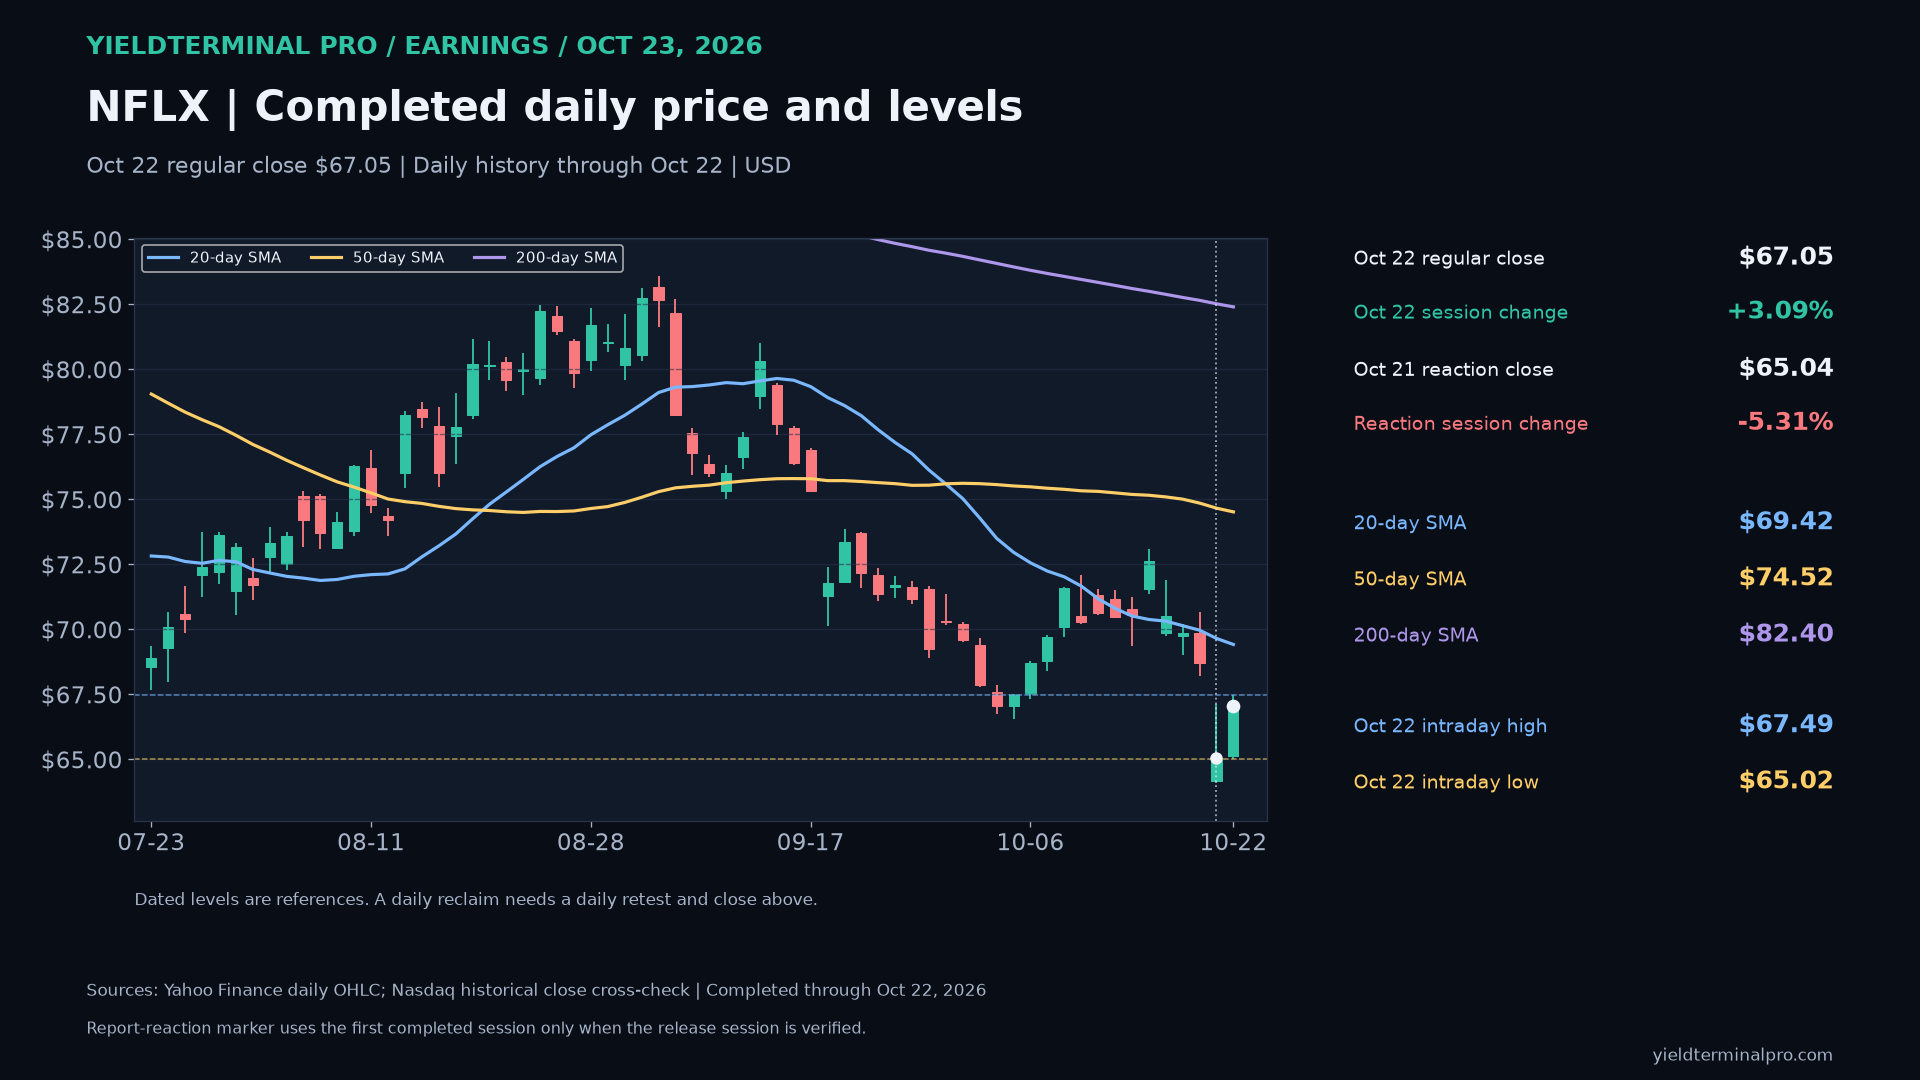
See the chart on X →$NFLXNetflix, Inc. — October 23 earnings review 67.05October 22 completed regular-session closeNFLX closed October 22 at $67.05, below its 50-day average ($74.52) and below its 200-day average ($82.40). The October 22 high ($67.49) and low ($65.02) are dated reference levels. This is completed daily history, not an October 23 quote.
- October 22 intraday high
- 67.49
- October 22 intraday low
- 65.02
- 50-day SMA through October 22
- 74.52
- 200-day SMA through October 22
- 82.40
Levels measured over Completed US regular-session daily history through October 22, 2026. Daily averages use completed closes; earnings result and price session are separate dated evidence.. A level measured over a different window can be a different number.
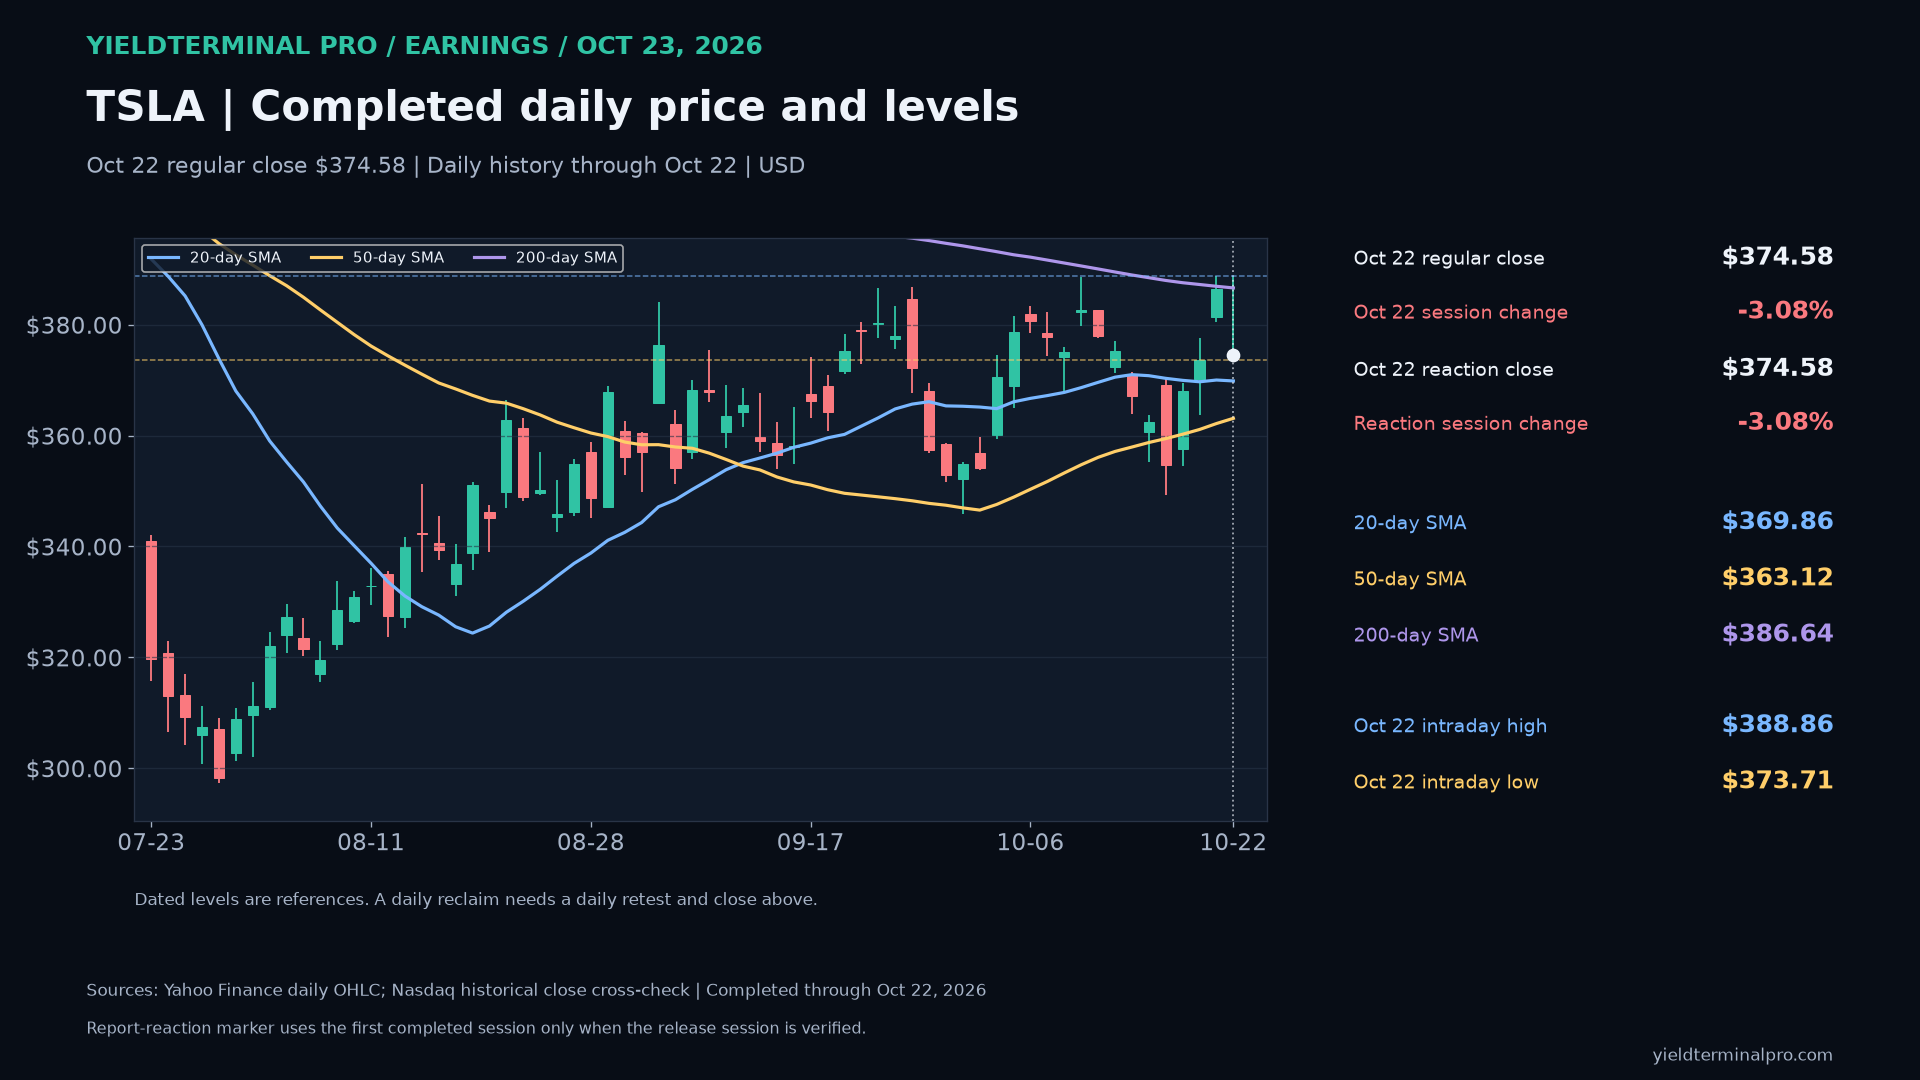
$TSLATesla, Inc. — October 23 earnings review 374.58October 22 completed regular-session closeTSLA closed October 22 at $374.58, above its 50-day average ($363.12) and below its 200-day average ($386.64). The October 22 high ($388.86) and low ($373.71) are dated reference levels. This is completed daily history, not an October 23 quote.
- October 22 intraday high
- 388.86
- October 22 intraday low
- 373.71
- 50-day SMA through October 22
- 363.12
- 200-day SMA through October 22
- 386.64
Levels measured over Completed US regular-session daily history through October 22, 2026. Daily averages use completed closes; earnings result and price session are separate dated evidence.. A level measured over a different window can be a different number.
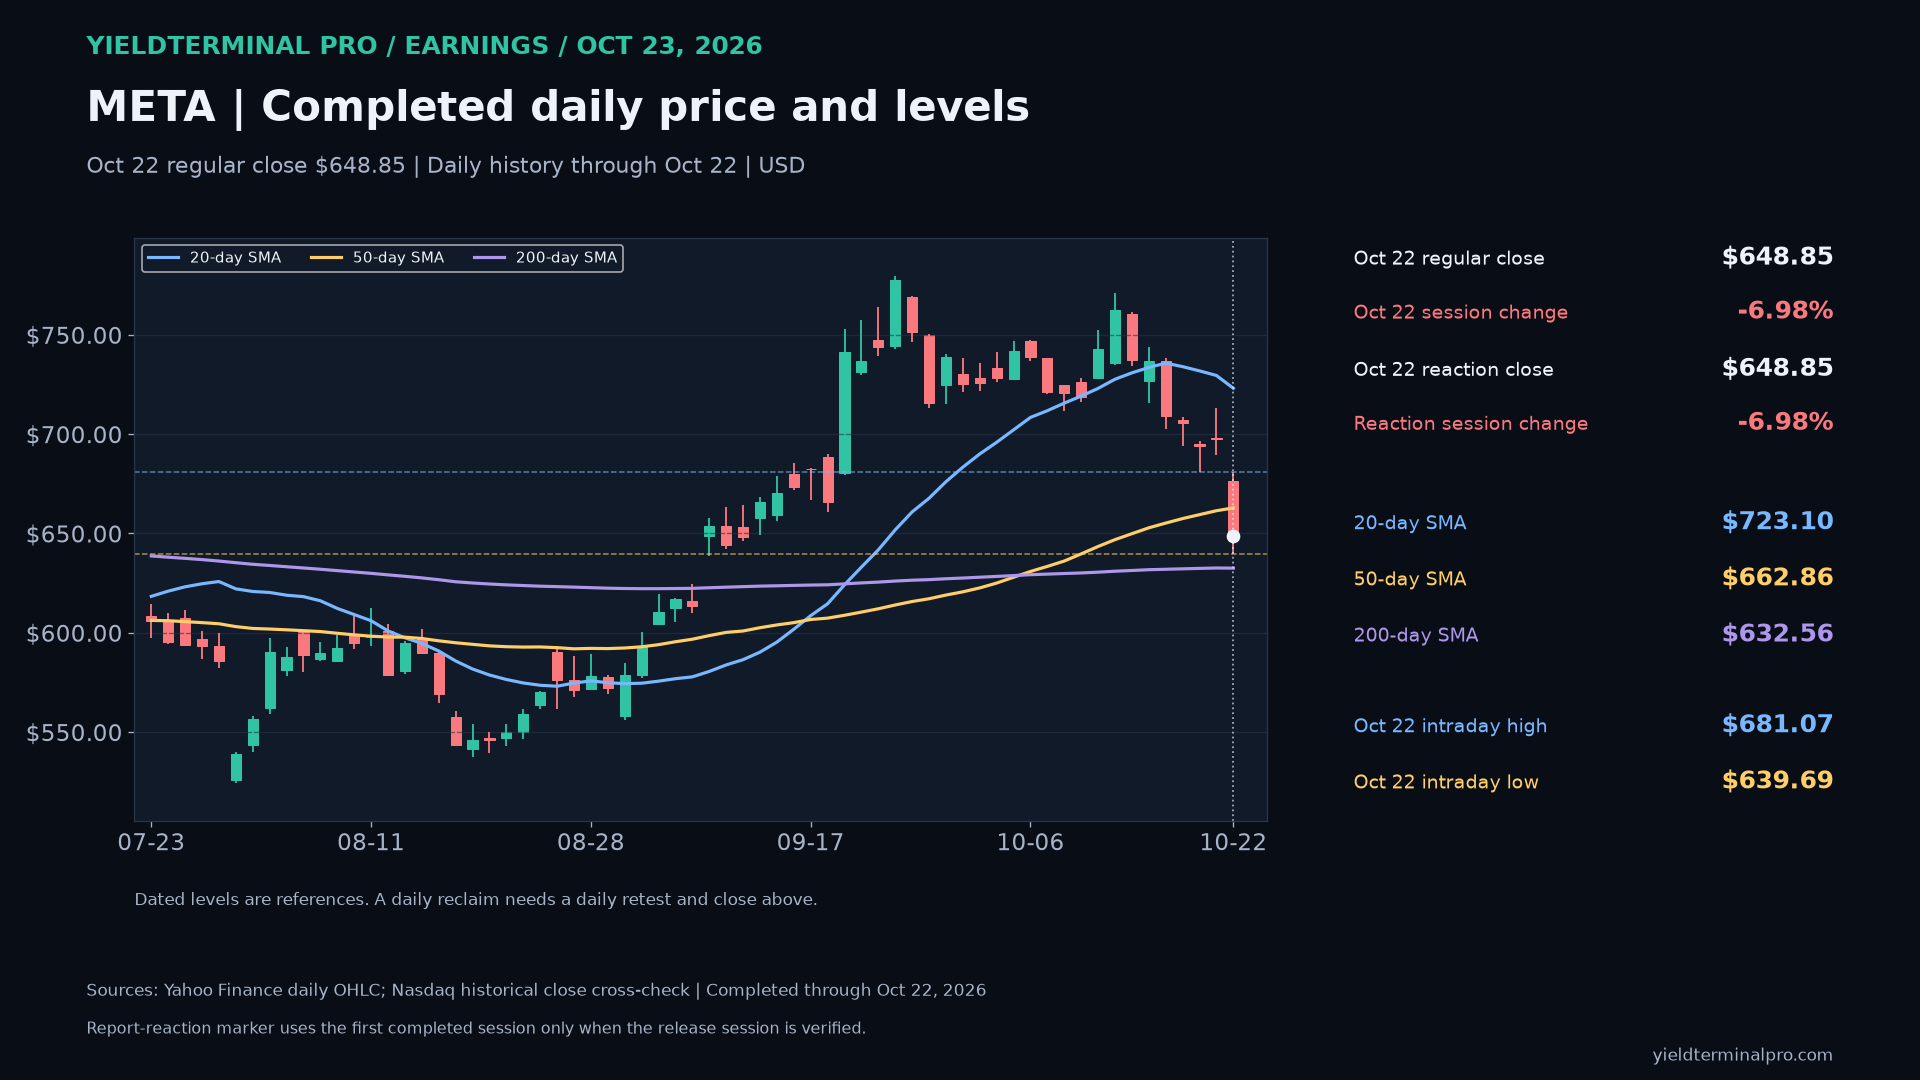
$METAMeta Platforms, Inc. — October 23 earnings review 648.85October 22 completed regular-session closeMETA closed October 22 at $648.85, below its 50-day average ($662.86) and above its 200-day average ($632.56). The October 22 high ($681.07) and low ($639.69) are dated reference levels. This is completed daily history, not an October 23 quote.
- October 22 intraday high
- 681.07
- October 22 intraday low
- 639.69
- 50-day SMA through October 22
- 662.86
- 200-day SMA through October 22
- 632.56
Levels measured over Completed US regular-session daily history through October 22, 2026. Daily averages use completed closes; earnings result and price session are separate dated evidence.. A level measured over a different window can be a different number.
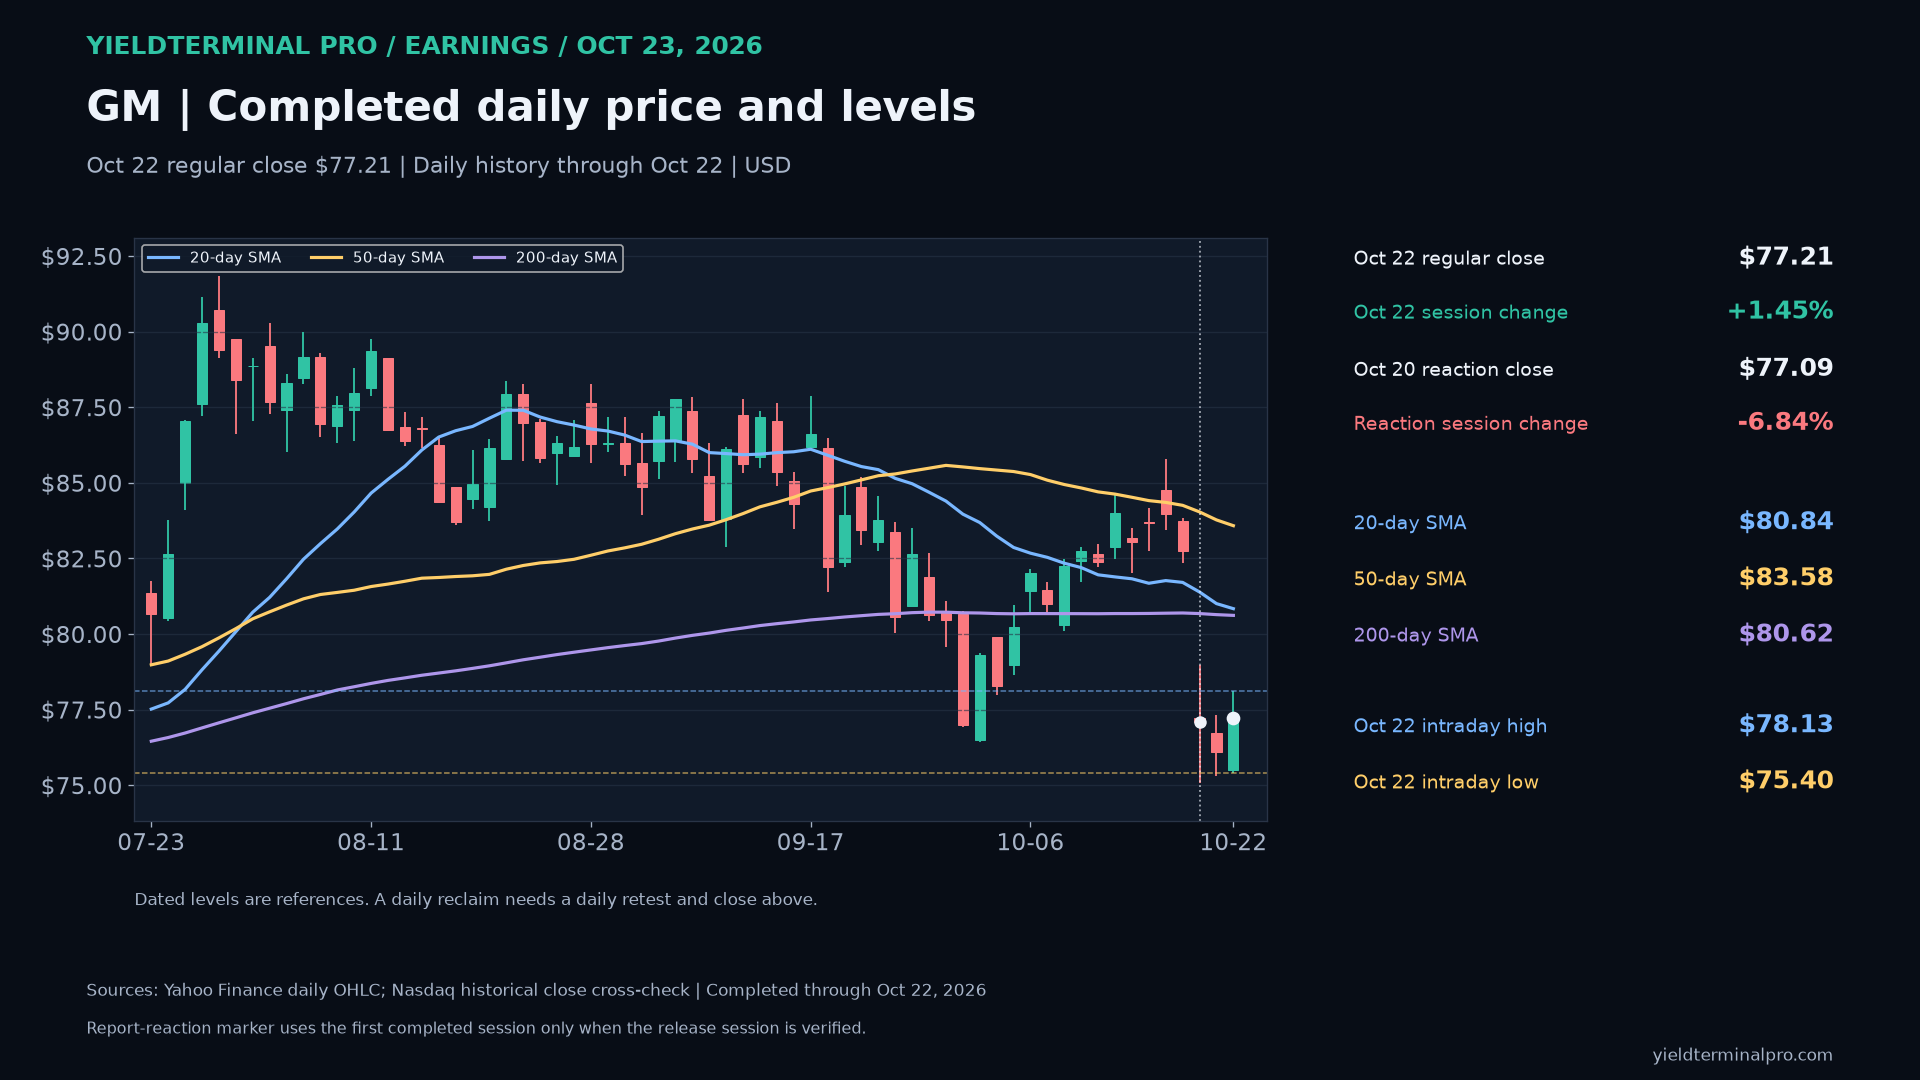
$GMGeneral Motors Company — October 23 earnings review 77.21October 22 completed regular-session closeGM closed October 22 at $77.21, below its 50-day average ($83.58) and below its 200-day average ($80.62). The October 22 high ($78.13) and low ($75.40) are dated reference levels. This is completed daily history, not an October 23 quote.
- October 22 intraday high
- 78.13
- October 22 intraday low
- 75.40
- 50-day SMA through October 22
- 83.58
- 200-day SMA through October 22
- 80.62
Levels measured over Completed US regular-session daily history through October 22, 2026. Daily averages use completed closes; earnings result and price session are separate dated evidence.. A level measured over a different window can be a different number.
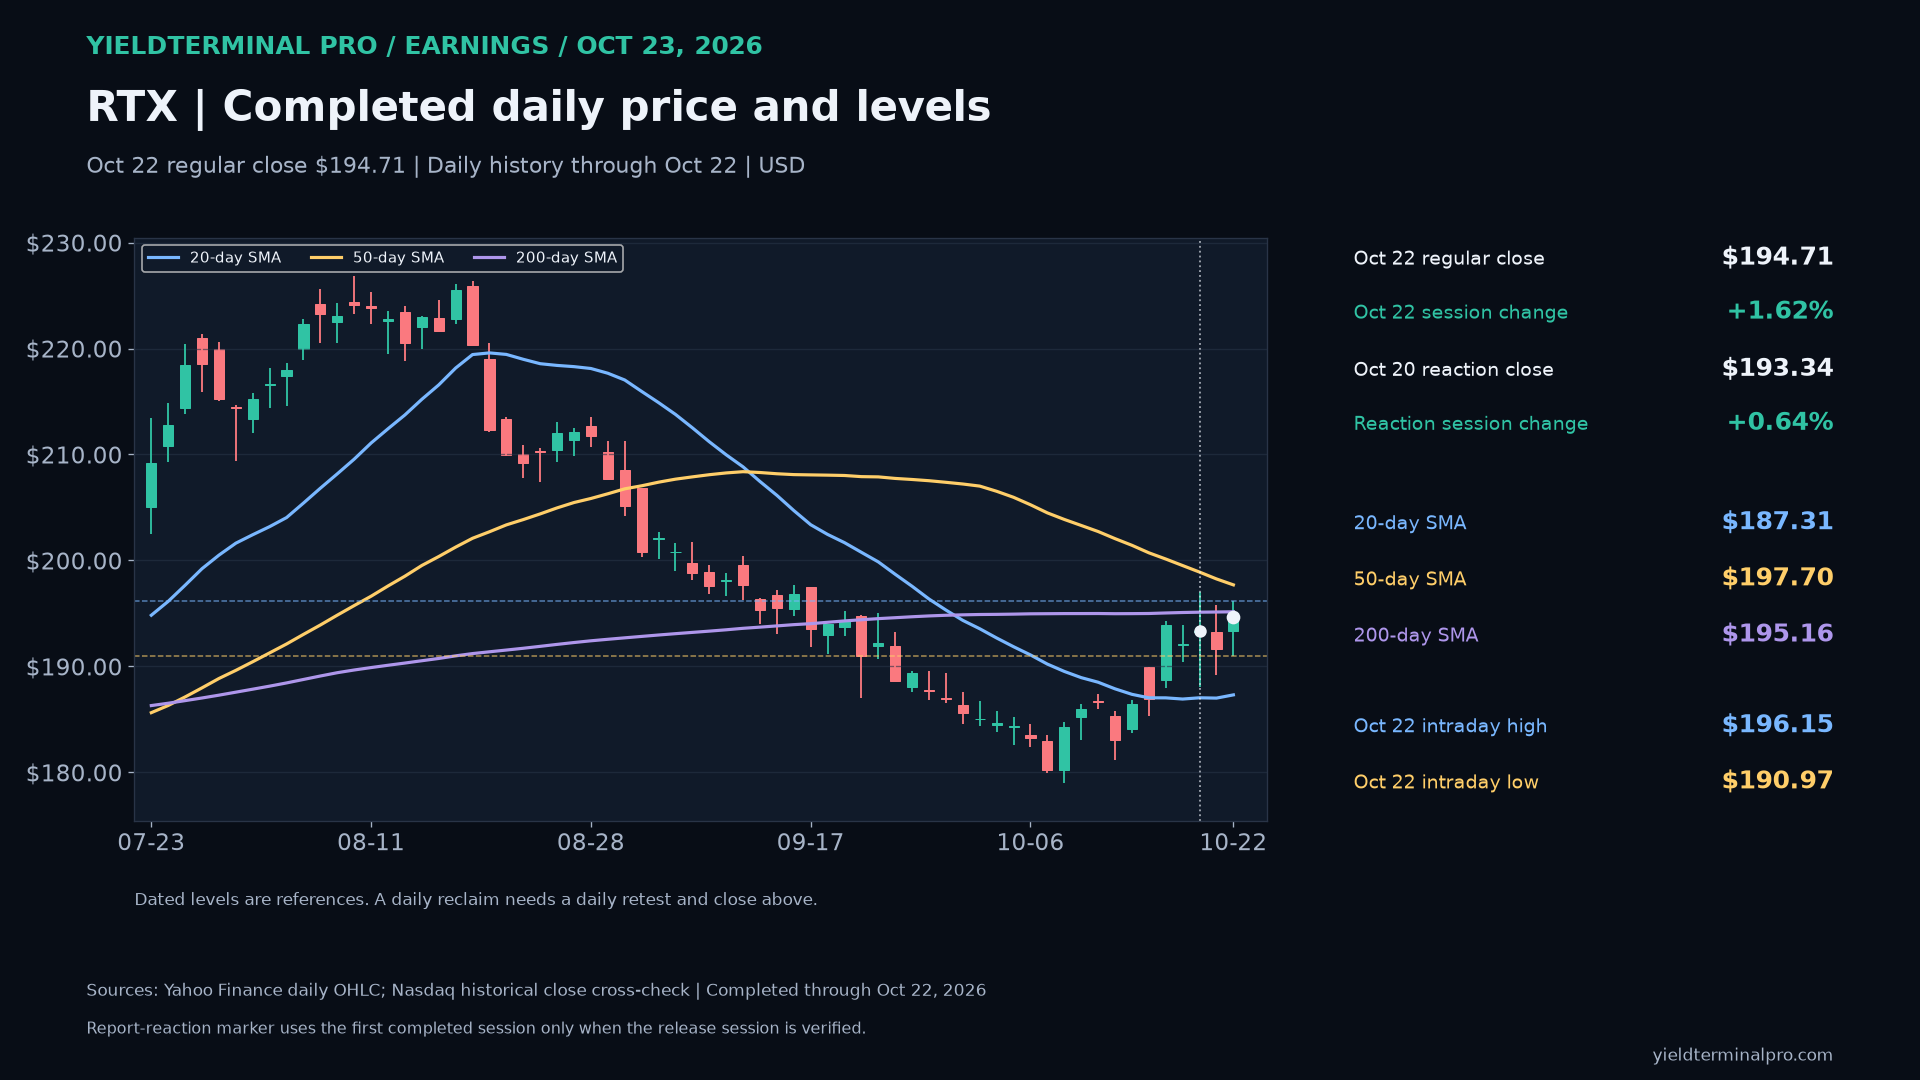
$RTXRTX Corporation — October 23 earnings review 194.71October 22 completed regular-session closeRTX closed October 22 at $194.71, below its 50-day average ($197.70) and below its 200-day average ($195.16). The October 22 high ($196.15) and low ($190.97) are dated reference levels. This is completed daily history, not an October 23 quote.
- October 22 intraday high
- 196.15
- October 22 intraday low
- 190.97
- 50-day SMA through October 22
- 197.70
- 200-day SMA through October 22
- 195.16
Levels measured over Completed US regular-session daily history through October 22, 2026. Daily averages use completed closes; earnings result and price session are separate dated evidence.. A level measured over a different window can be a different number.
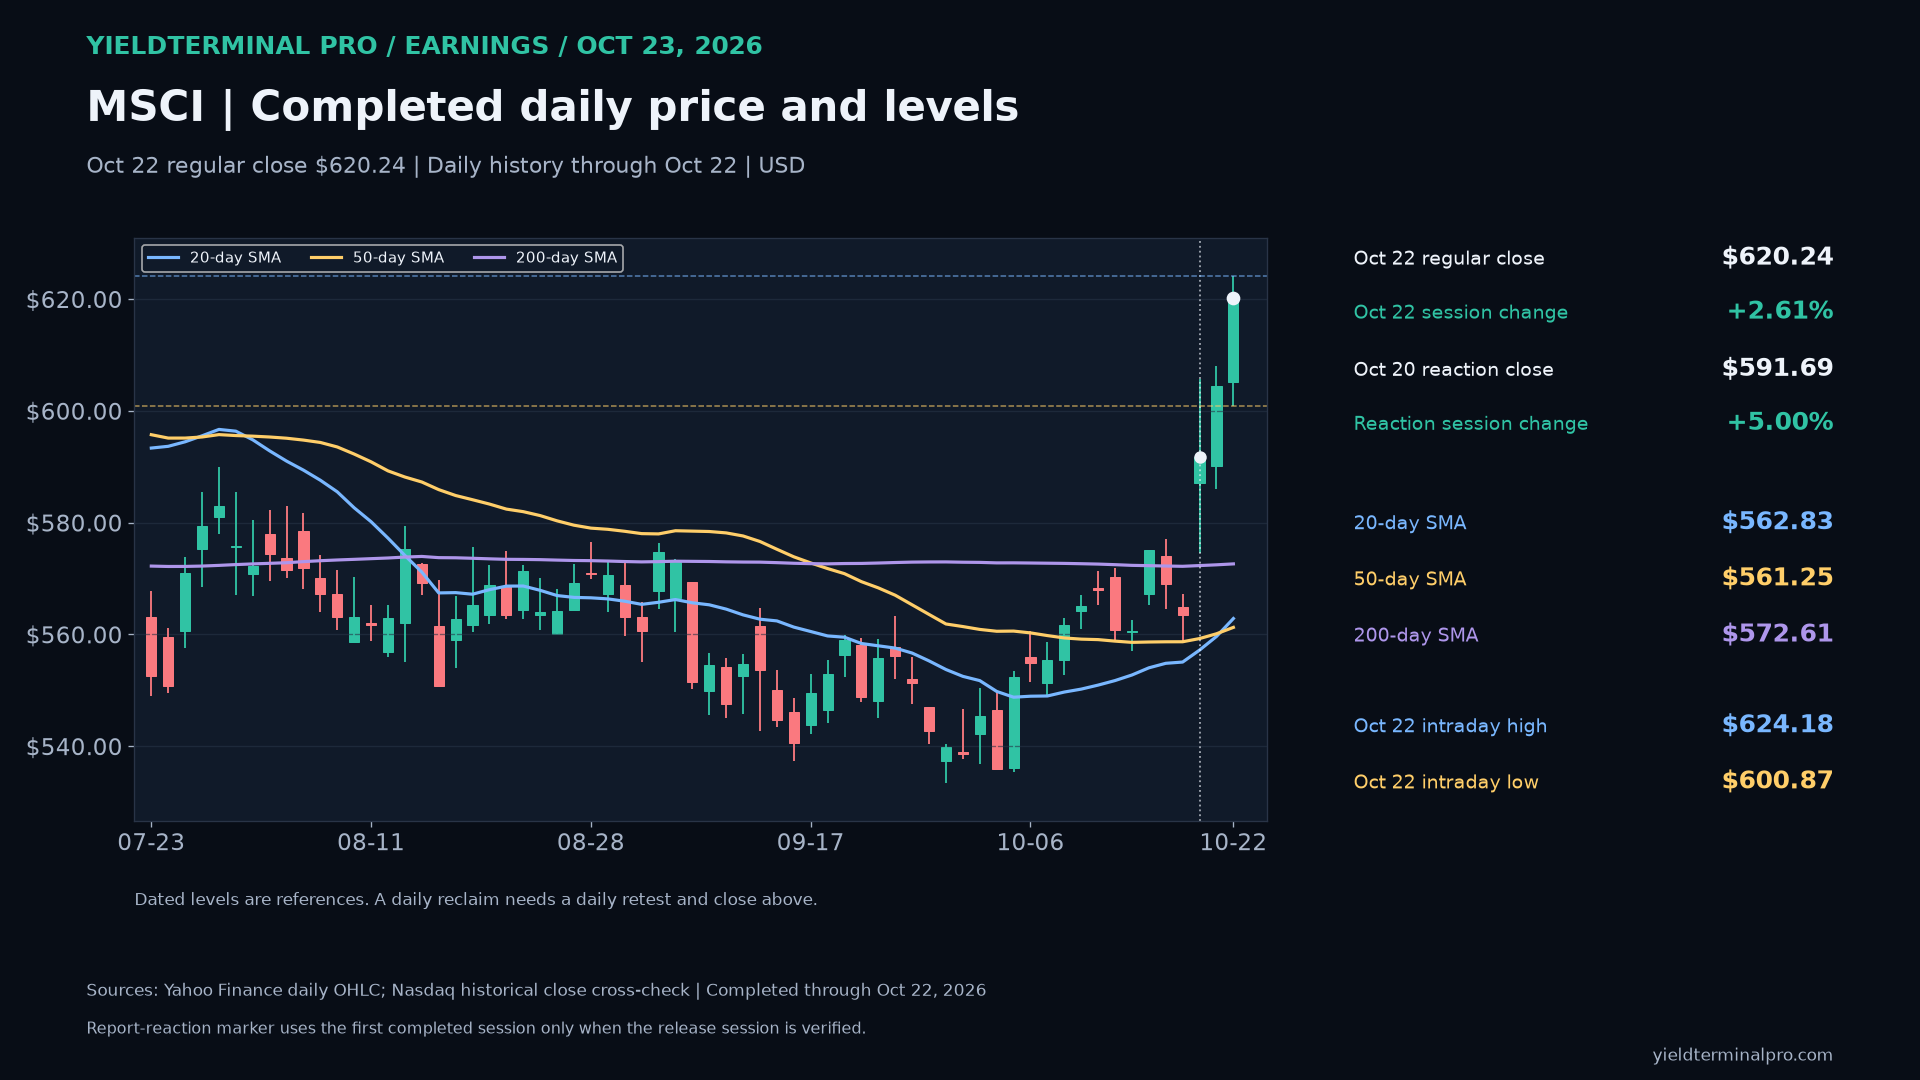
$MSCIMSCI Inc. — October 23 earnings review 620.24October 22 completed regular-session closeMSCI closed October 22 at $620.24, above its 50-day average ($561.25) and above its 200-day average ($572.61). The October 22 high ($624.18) and low ($600.87) are dated reference levels. This is completed daily history, not an October 23 quote.
- October 22 intraday high
- 624.18
- October 22 intraday low
- 600.87
- 50-day SMA through October 22
- 561.25
- 200-day SMA through October 22
- 572.61
Levels measured over Completed US regular-session daily history through October 22, 2026. Daily averages use completed closes; earnings result and price session are separate dated evidence.. A level measured over a different window can be a different number.
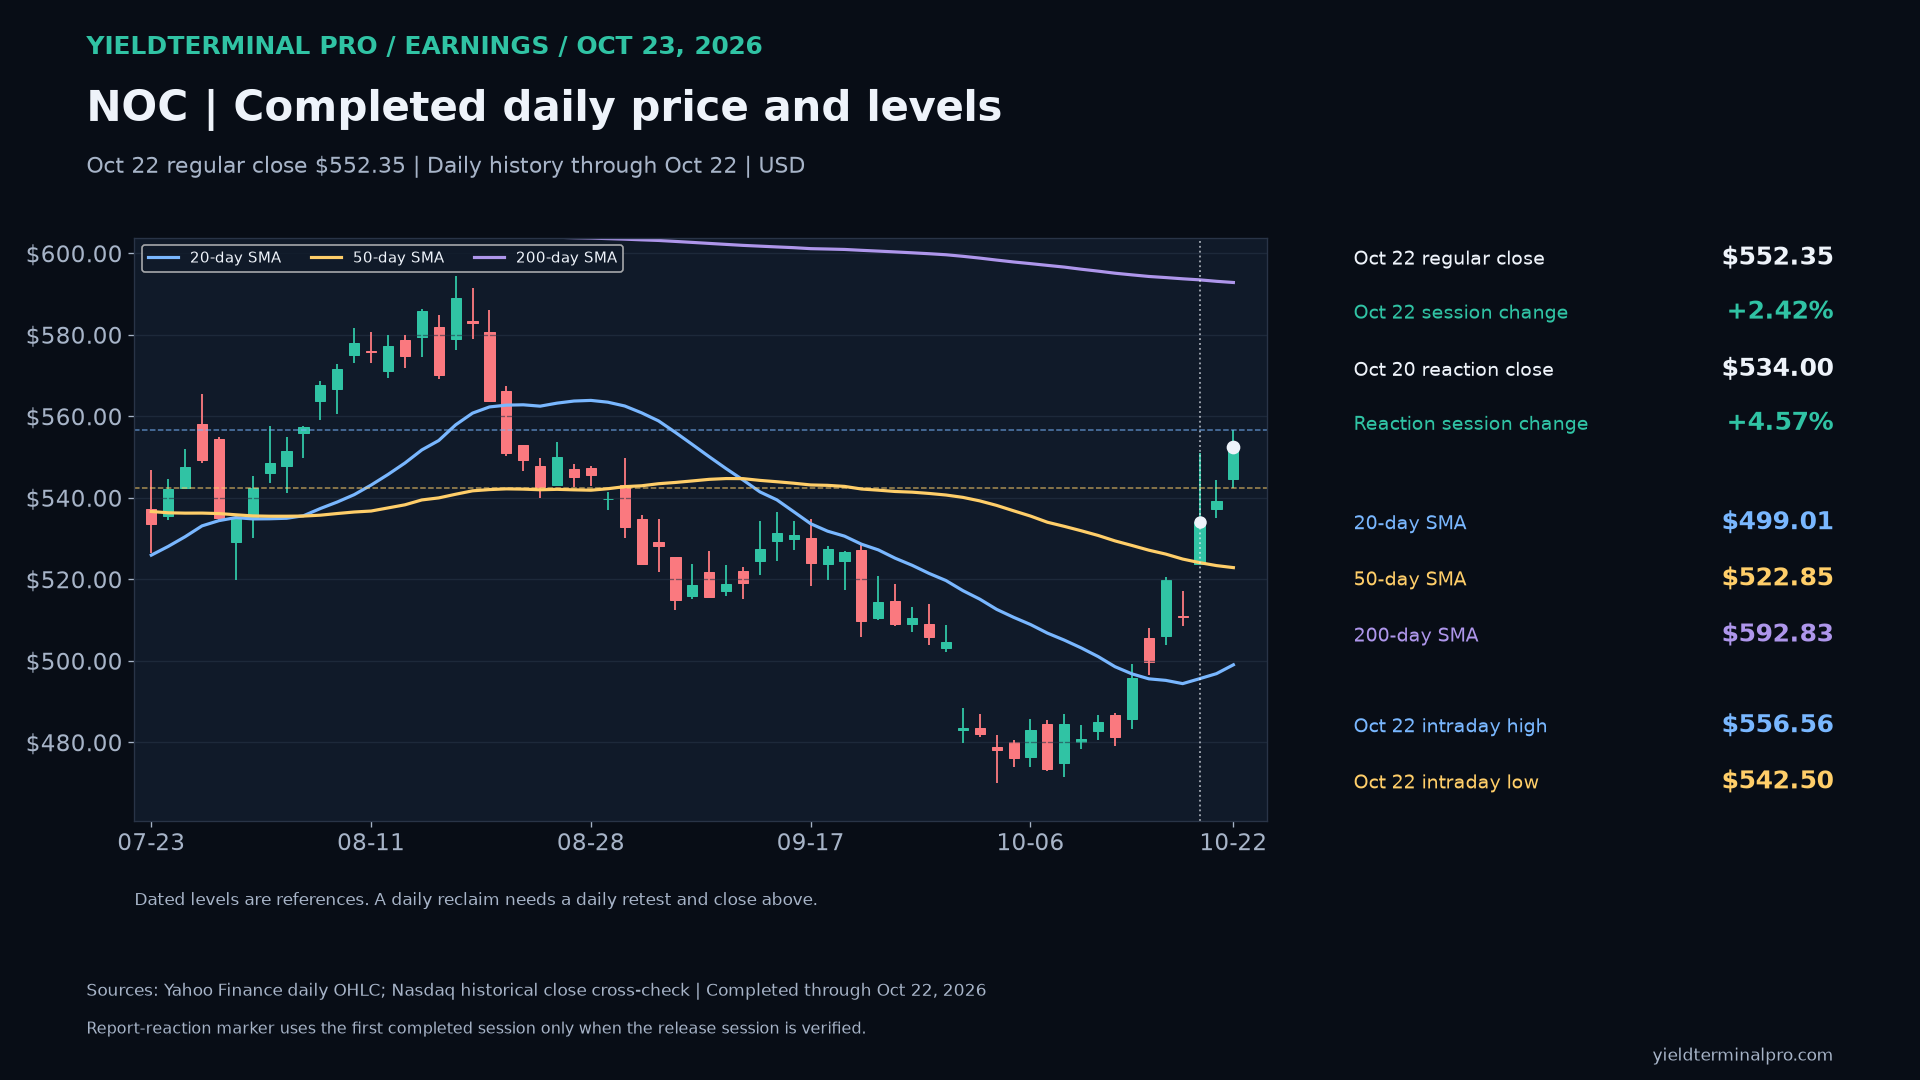
$NOCNorthrop Grumman — October 23 earnings review 552.35October 22 completed regular-session closeNOC closed October 22 at $552.35, above its 50-day average ($522.85) and below its 200-day average ($592.83). The October 22 high ($556.56) and low ($542.50) are dated reference levels. This is completed daily history, not an October 23 quote.
- October 22 intraday high
- 556.56
- October 22 intraday low
- 542.50
- 50-day SMA through October 22
- 522.85
- 200-day SMA through October 22
- 592.83
Levels measured over Completed US regular-session daily history through October 22, 2026. Daily averages use completed closes; earnings result and price session are separate dated evidence.. A level measured over a different window can be a different number.
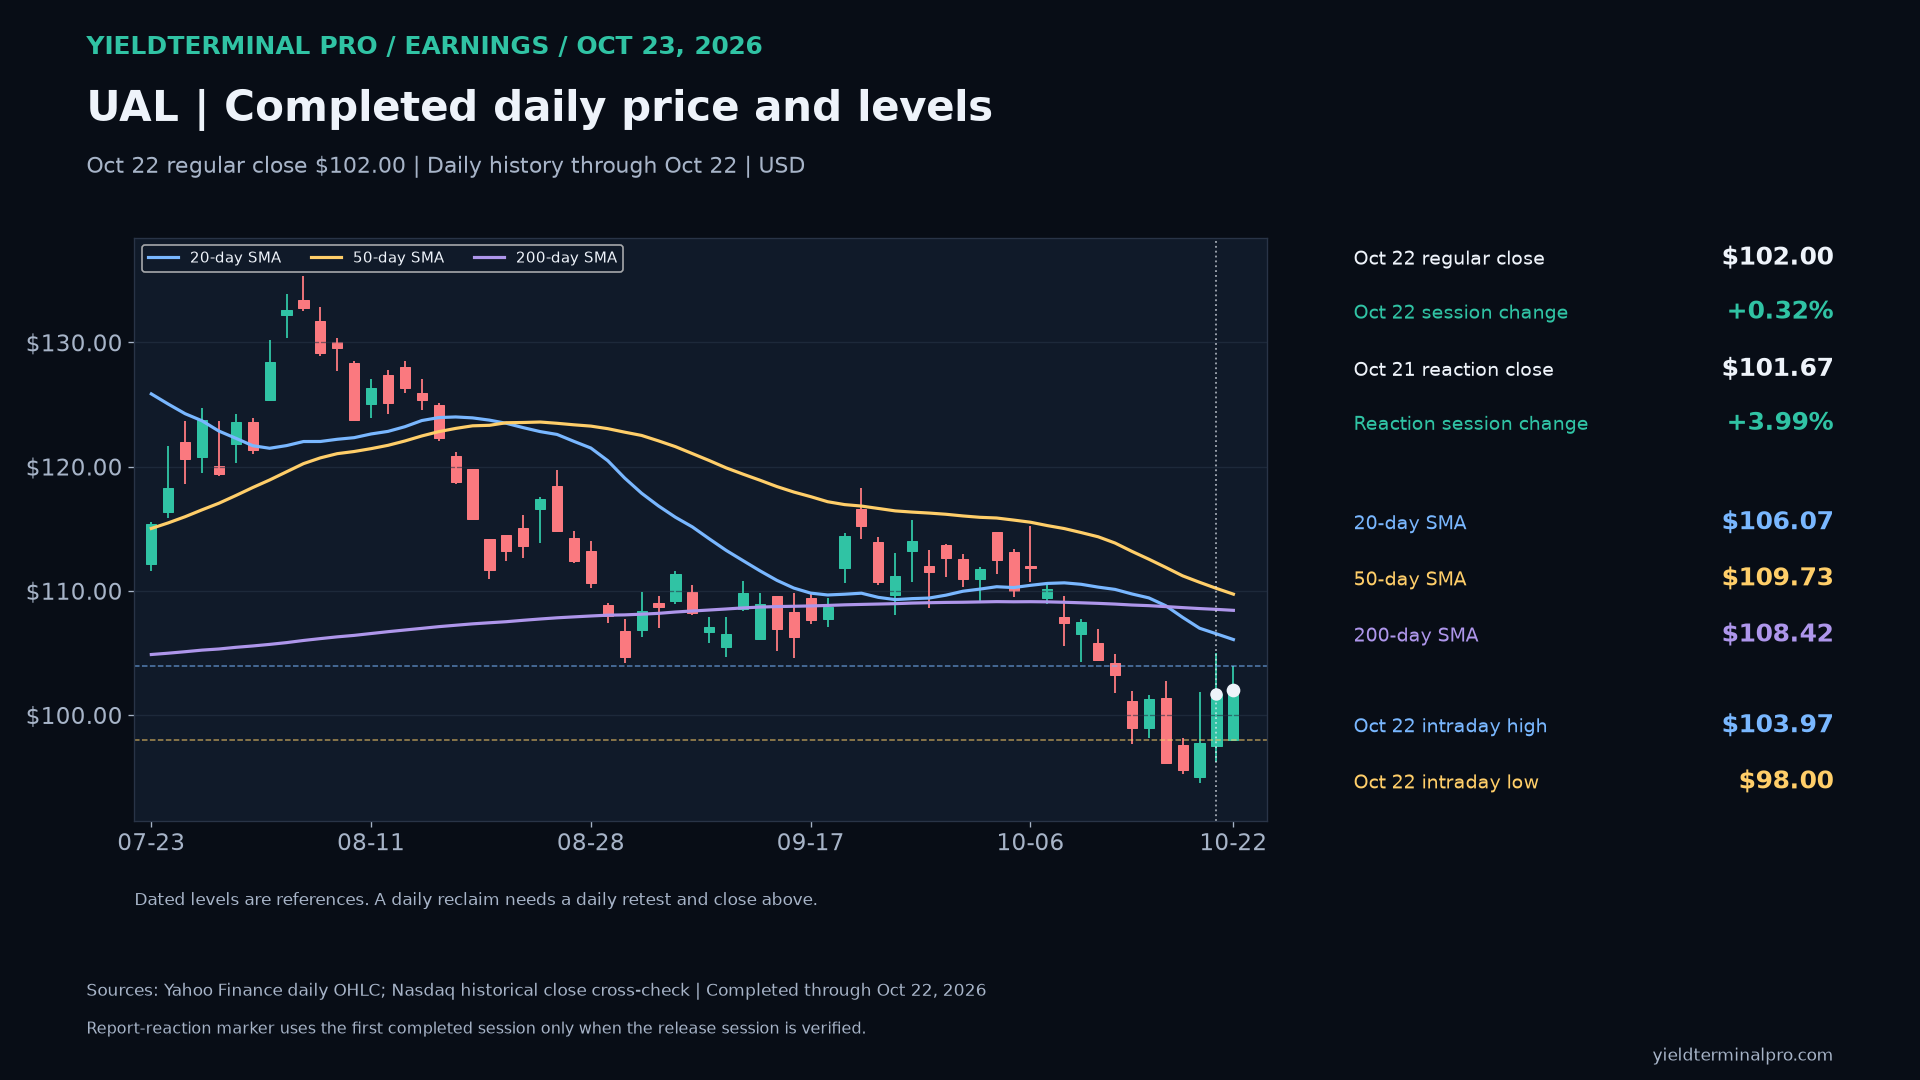
$UALUnited Airlines Holdings, Inc. — October 23 earnings review 102.00October 22 completed regular-session closeUAL closed October 22 at $102.00, below its 50-day average ($109.73) and below its 200-day average ($108.42). The October 22 high ($103.97) and low ($98.00) are dated reference levels. This is completed daily history, not an October 23 quote.
- October 22 intraday high
- 103.97
- October 22 intraday low
- 98.00
- 50-day SMA through October 22
- 109.73
- 200-day SMA through October 22
- 108.42
Levels measured over Completed US regular-session daily history through October 22, 2026. Daily averages use completed closes; earnings result and price session are separate dated evidence.. A level measured over a different window can be a different number.
$ISRGIntuitive Surgical, Inc. — October 23 earnings review 443.85October 22 completed regular-session closeISRG closed October 22 at $443.85, above its 50-day average ($395.04) and above its 200-day average ($436.91). The October 22 high ($444.15) and low ($427.47) are dated reference levels. This is completed daily history, not an October 23 quote.
- October 22 intraday high
- 444.15
- October 22 intraday low
- 427.47
- 50-day SMA through October 22
- 395.04
- 200-day SMA through October 22
- 436.91
Levels measured over Completed US regular-session daily history through October 22, 2026. Daily averages use completed closes; earnings result and price session are separate dated evidence.. A level measured over a different window can be a different number.
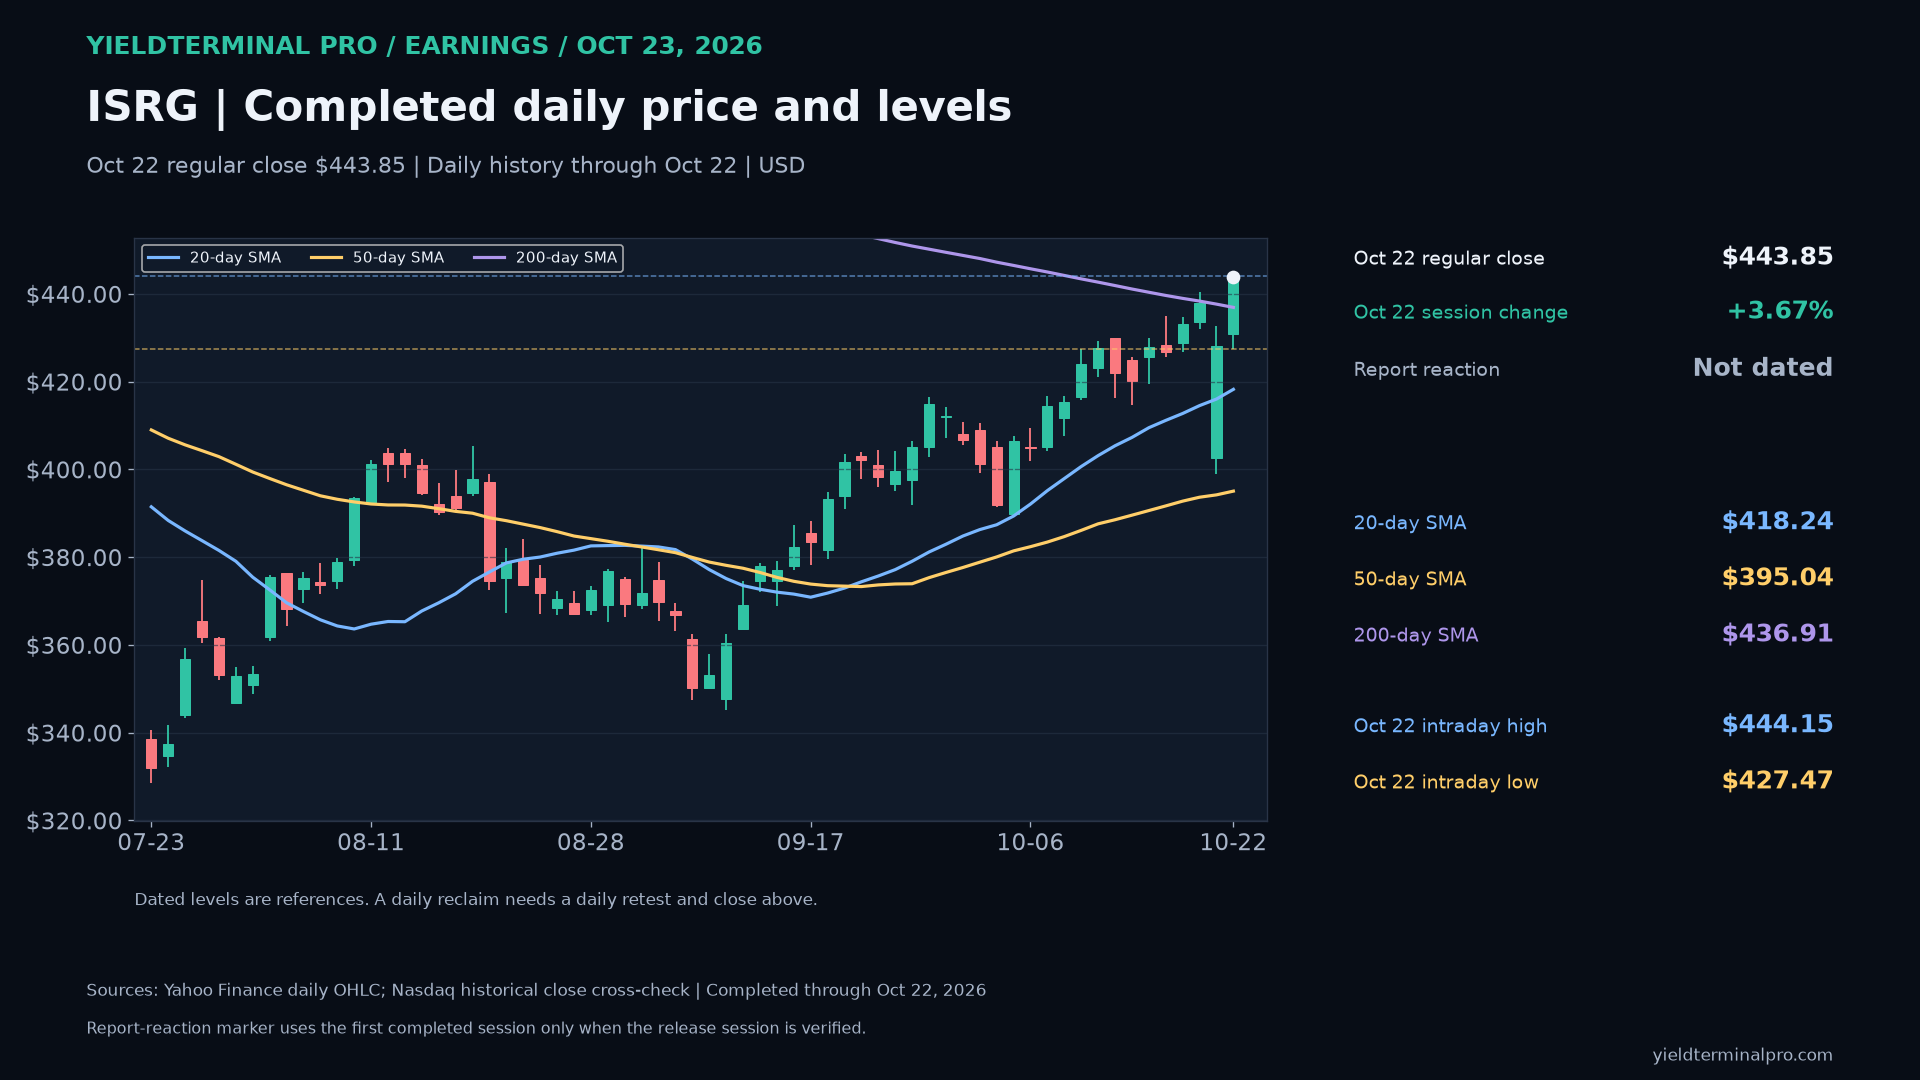
$COFCapital One Financial Corporation — October 23 earnings review 203.43October 22 completed regular-session closeCOF closed October 22 at $203.43, below its 50-day average ($206.72) and above its 200-day average ($202.37). The October 22 high ($208.45) and low ($202.33) are dated reference levels. This is completed daily history, not an October 23 quote.
- October 22 intraday high
- 208.45
- October 22 intraday low
- 202.33
- 50-day SMA through October 22
- 206.72
- 200-day SMA through October 22
- 202.37
Levels measured over Completed US regular-session daily history through October 22, 2026. Daily averages use completed closes; earnings result and price session are separate dated evidence.. A level measured over a different window can be a different number.
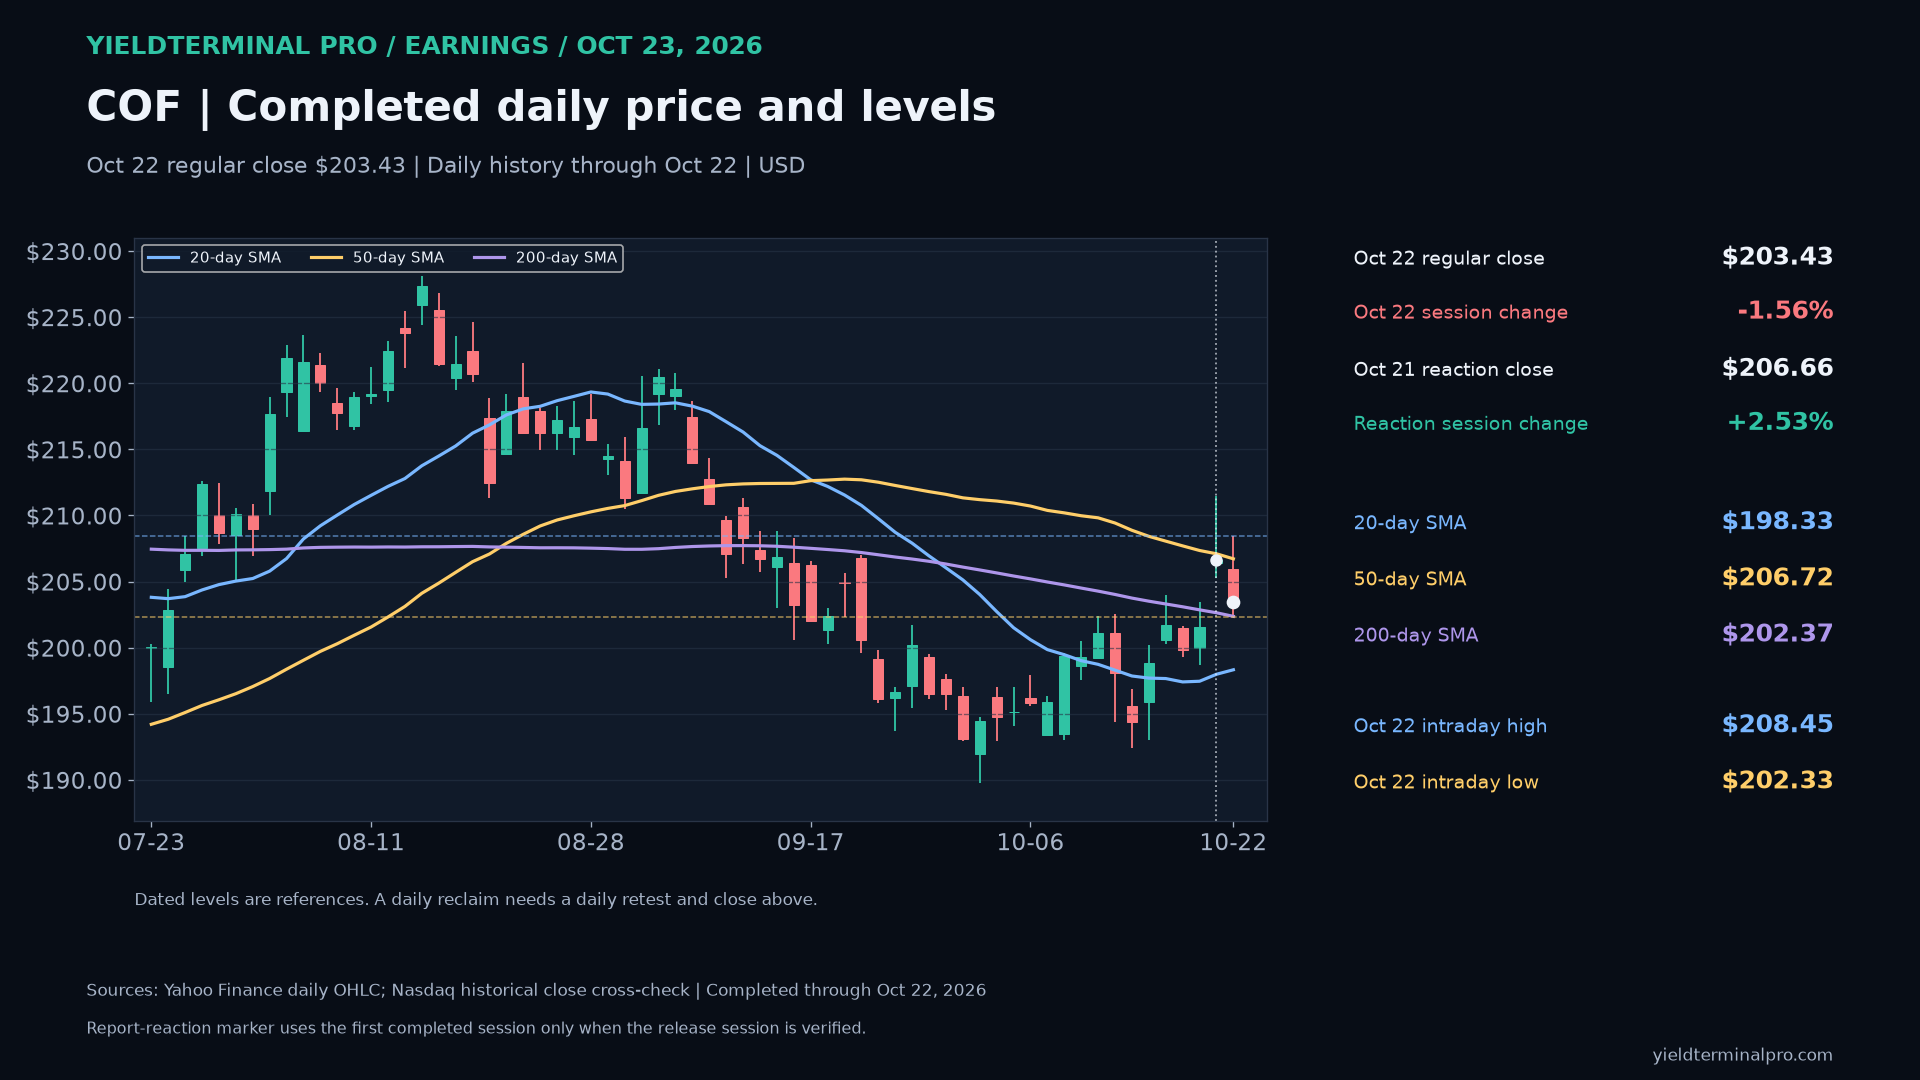
$CBChubb — October 23 earnings review 363.95October 22 completed regular-session closeCB closed October 22 at $363.95, above its 50-day average ($341.48) and above its 200-day average ($332.44). The October 22 high ($364.86) and low ($357.11) are dated reference levels. This is completed daily history, not an October 23 quote.
- October 22 intraday high
- 364.86
- October 22 intraday low
- 357.11
- 50-day SMA through October 22
- 341.48
- 200-day SMA through October 22
- 332.44
Levels measured over Completed US regular-session daily history through October 22, 2026. Daily averages use completed closes; earnings result and price session are separate dated evidence.. A level measured over a different window can be a different number.
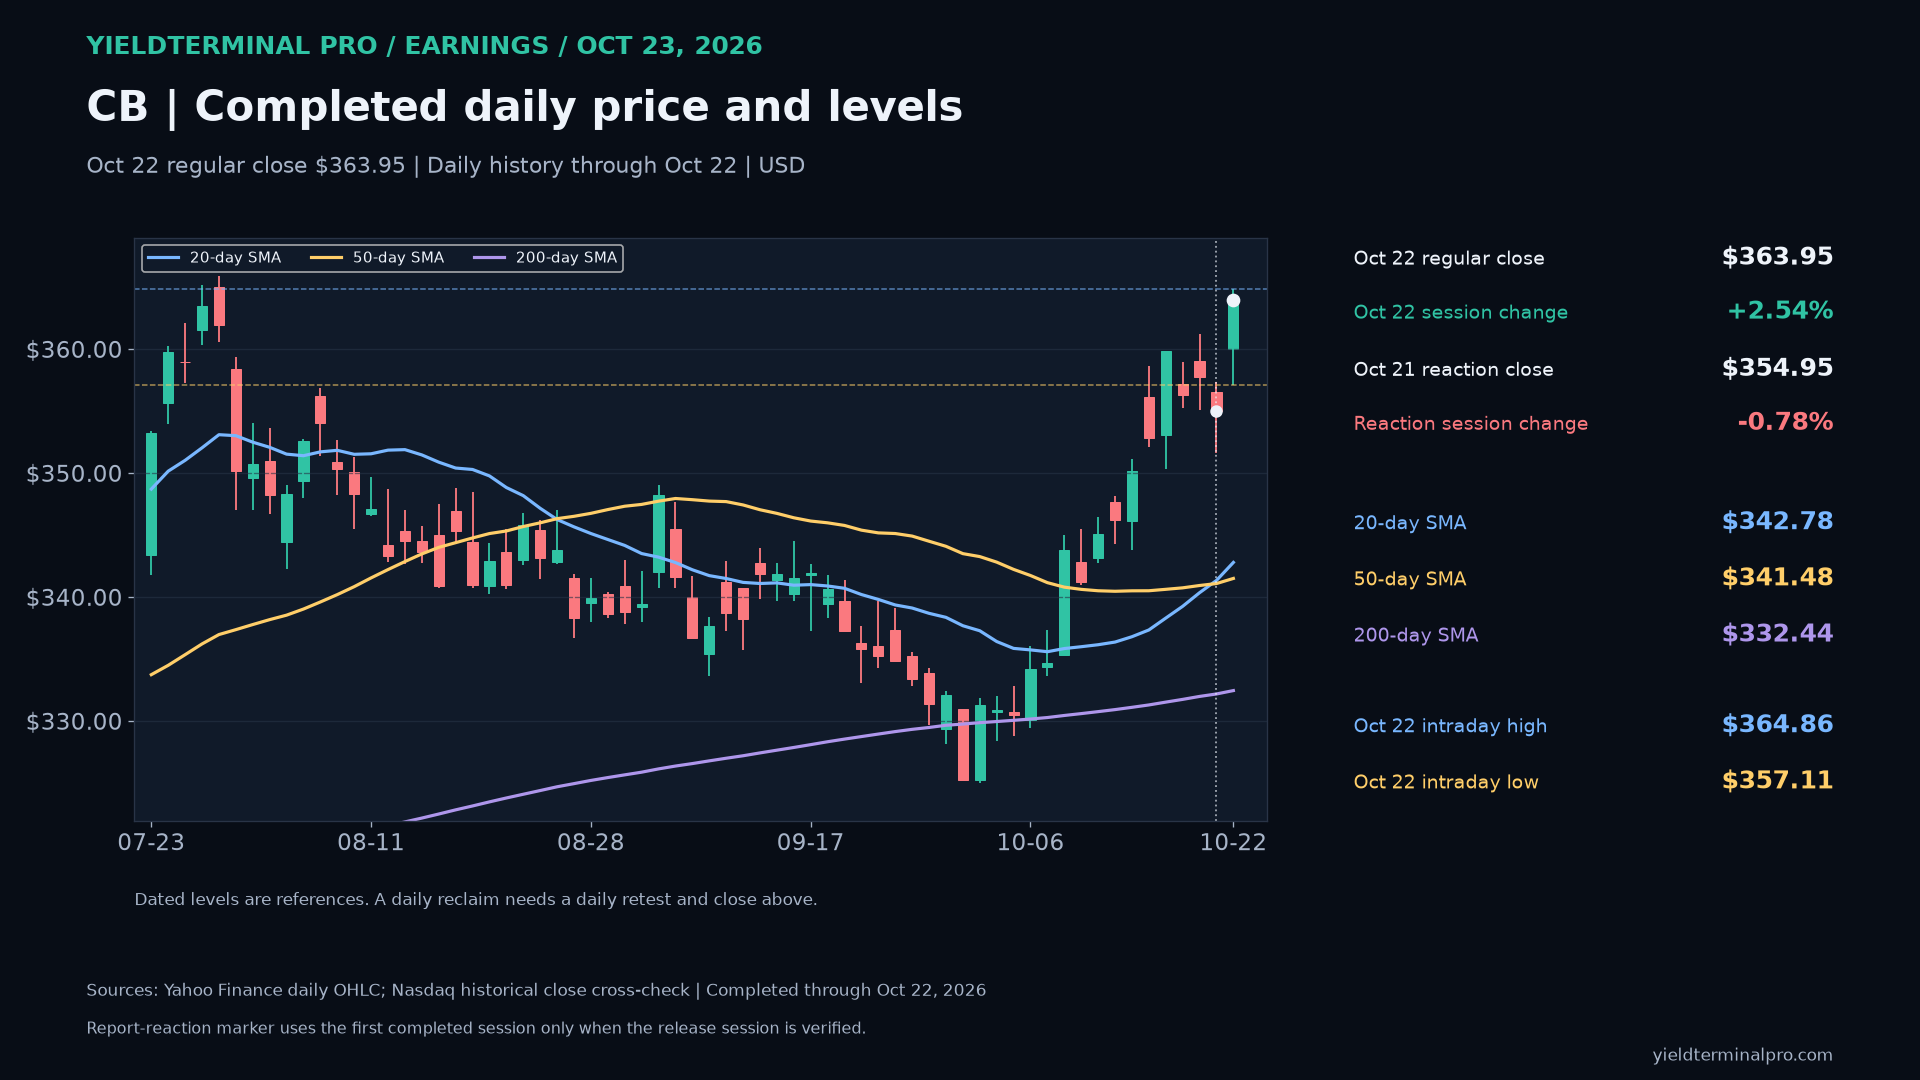
$NLYAnnaly Capital — October 23 earnings review 18.34October 22 completed regular-session closeNLY closed October 22 at $18.34, below its 50-day average ($20.91) and below its 200-day average ($22.09). The October 22 high ($18.57) and low ($18.00) are dated reference levels. This is completed daily history, not an October 23 quote.
- October 22 intraday high
- 18.57
- October 22 intraday low
- 18.00
- 50-day SMA through October 22
- 20.91
- 200-day SMA through October 22
- 22.09
Levels measured over Completed US regular-session daily history through October 22, 2026. Daily averages use completed closes; earnings result and price session are separate dated evidence.. A level measured over a different window can be a different number.
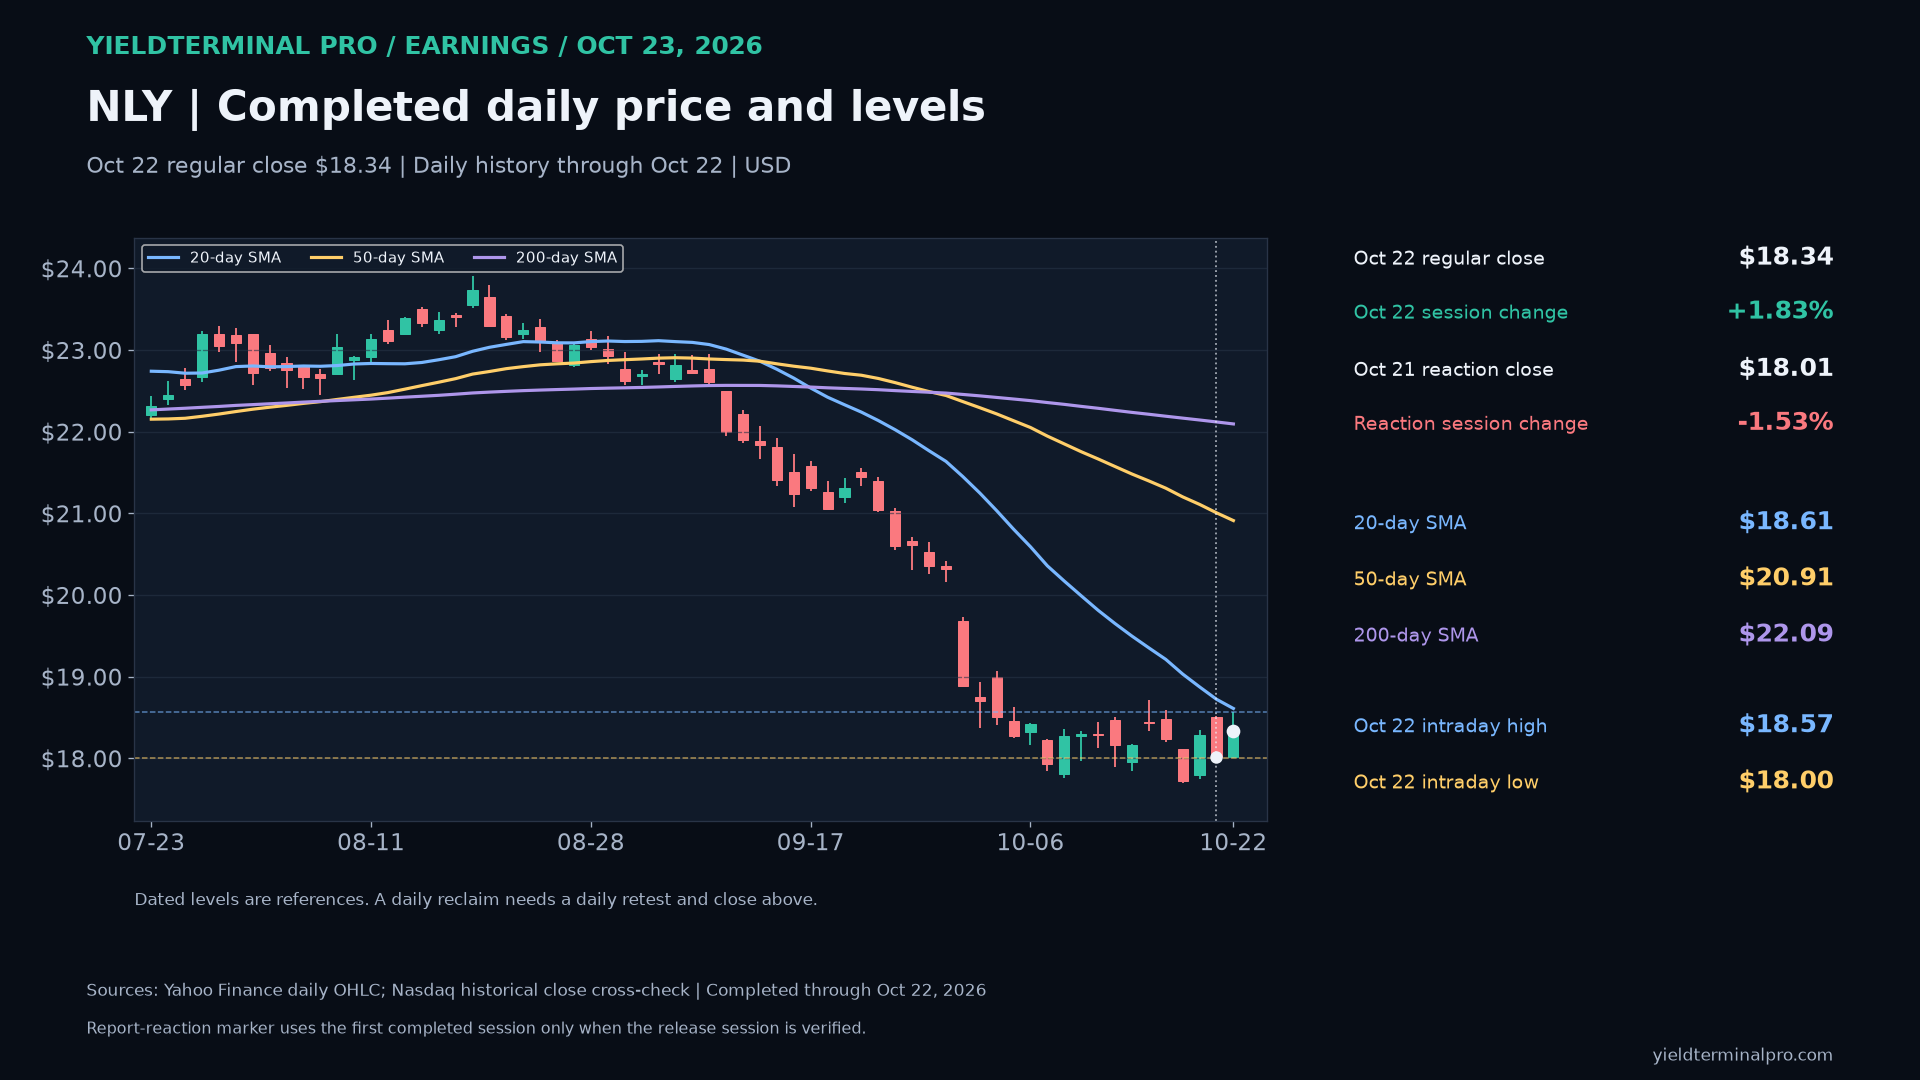
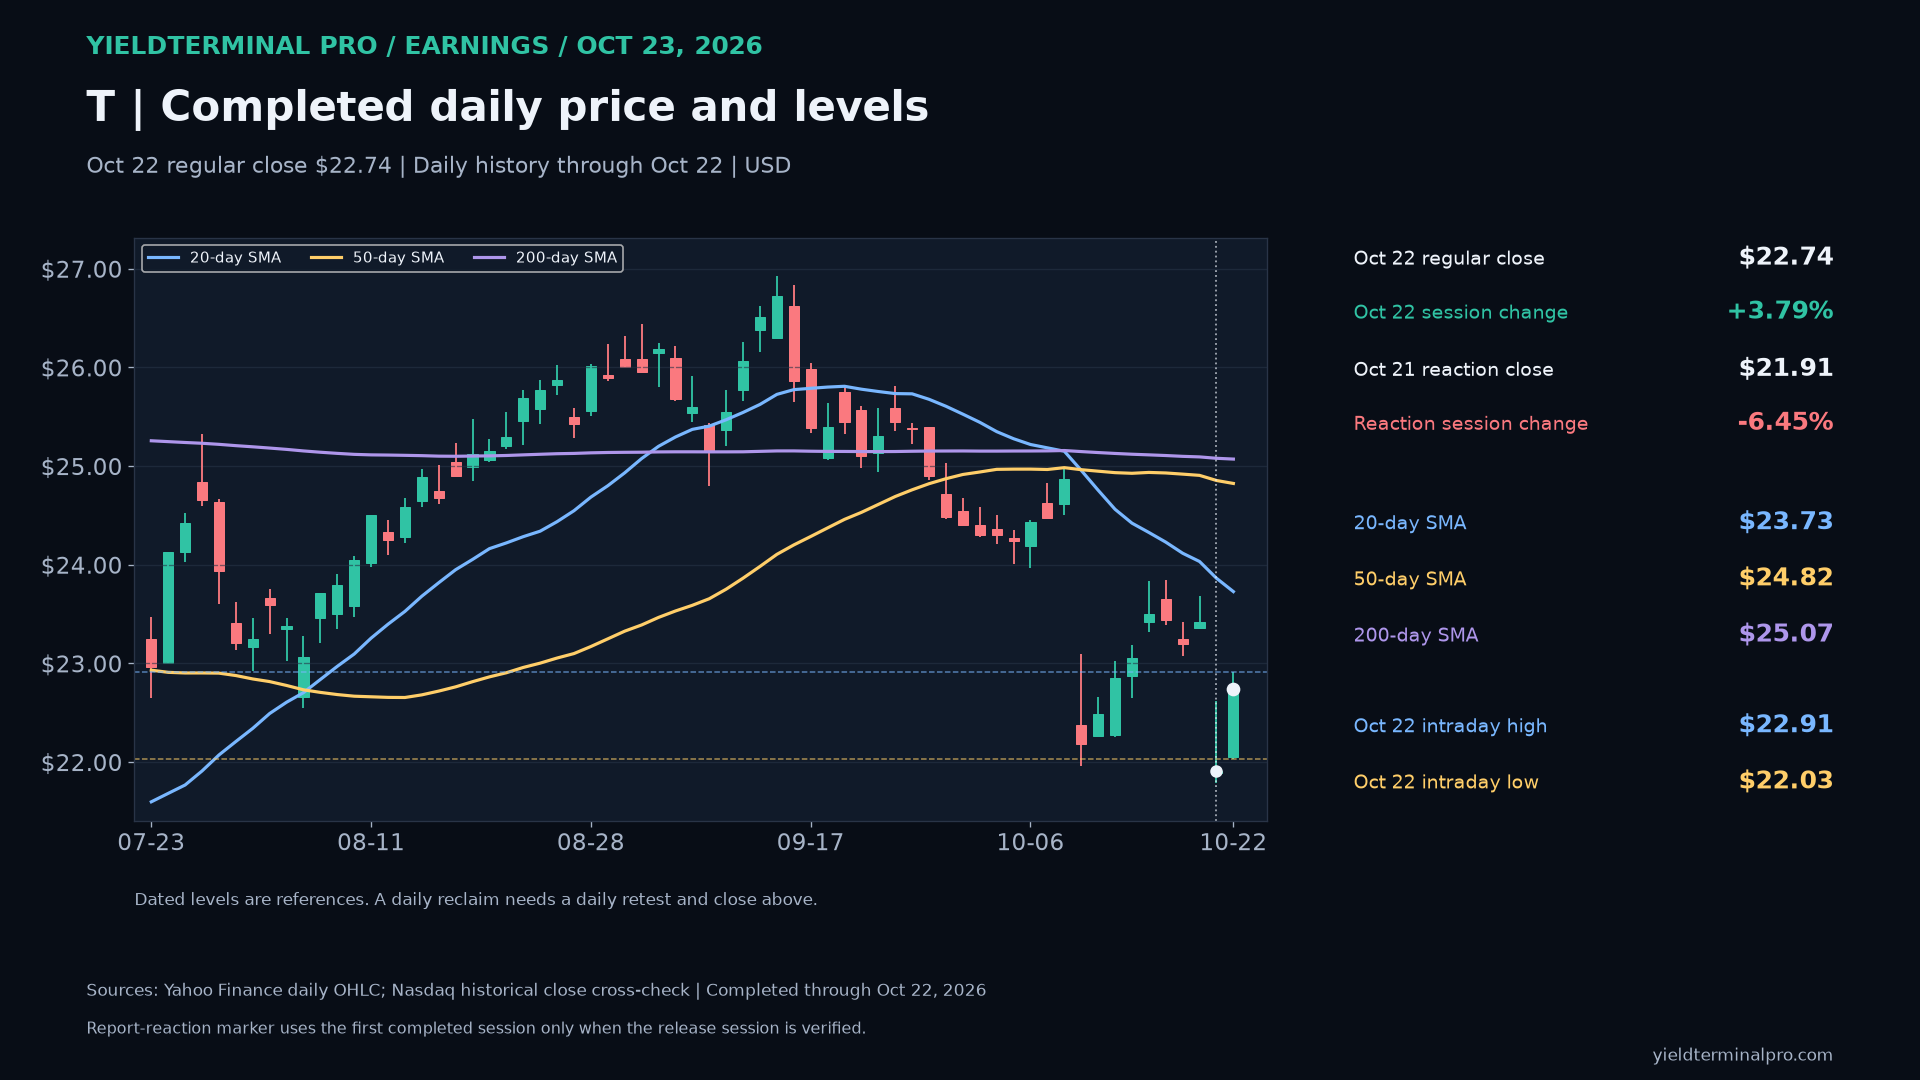
$TAT&T Inc. — October 23 earnings review 22.74October 22 completed regular-session closeT closed October 22 at $22.74, below its 50-day average ($24.82) and below its 200-day average ($25.07). The October 22 high ($22.91) and low ($22.03) are dated reference levels. This is completed daily history, not an October 23 quote.
- October 22 intraday high
- 22.91
- October 22 intraday low
- 22.03
- 50-day SMA through October 22
- 24.82
- 200-day SMA through October 22
- 25.07
Levels measured over Completed US regular-session daily history through October 22, 2026. Daily averages use completed closes; earnings result and price session are separate dated evidence.. A level measured over a different window can be a different number.
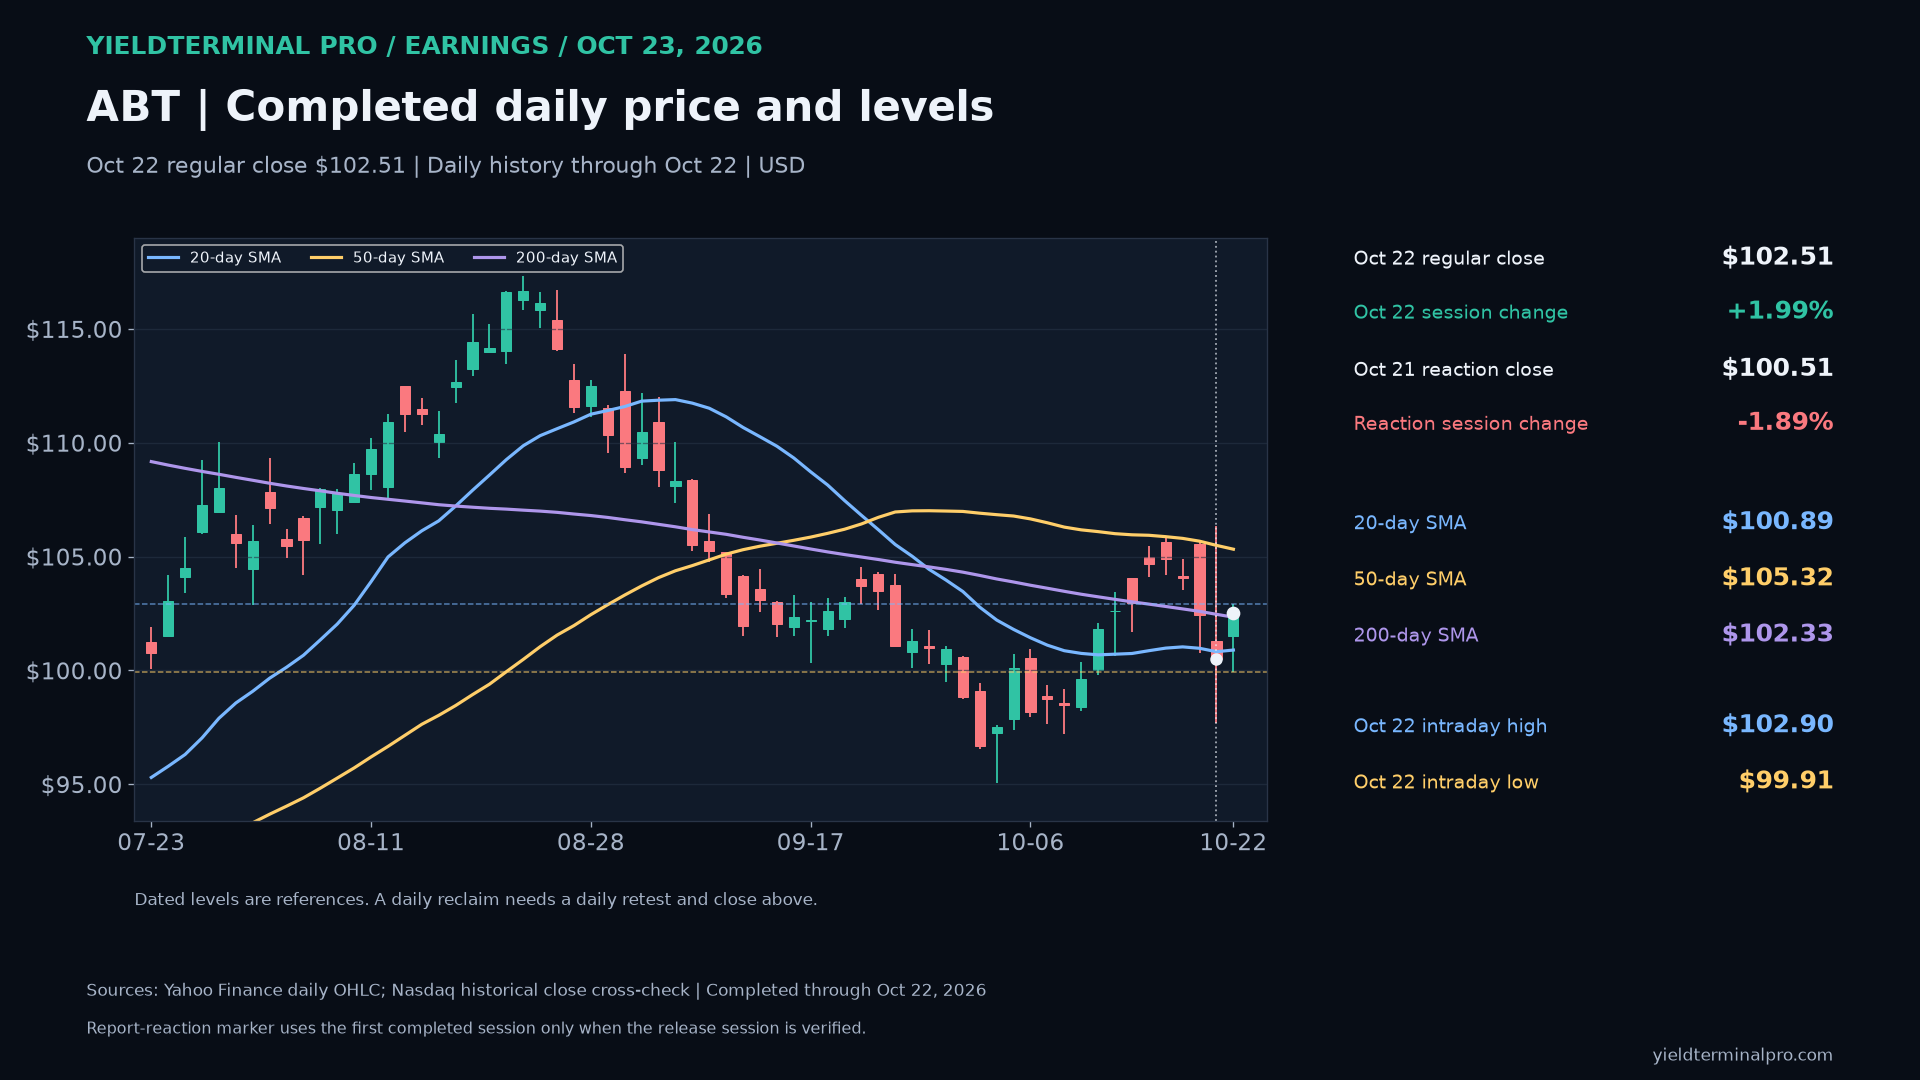
$ABTAbbott Laboratories — October 23 earnings review 102.51October 22 completed regular-session closeABT closed October 22 at $102.51, below its 50-day average ($105.32) and above its 200-day average ($102.33). The October 22 high ($102.90) and low ($99.91) are dated reference levels. This is completed daily history, not an October 23 quote.
- October 22 intraday high
- 102.90
- October 22 intraday low
- 99.91
- 50-day SMA through October 22
- 105.32
- 200-day SMA through October 22
- 102.33
Levels measured over Completed US regular-session daily history through October 22, 2026. Daily averages use completed closes; earnings result and price session are separate dated evidence.. A level measured over a different window can be a different number.
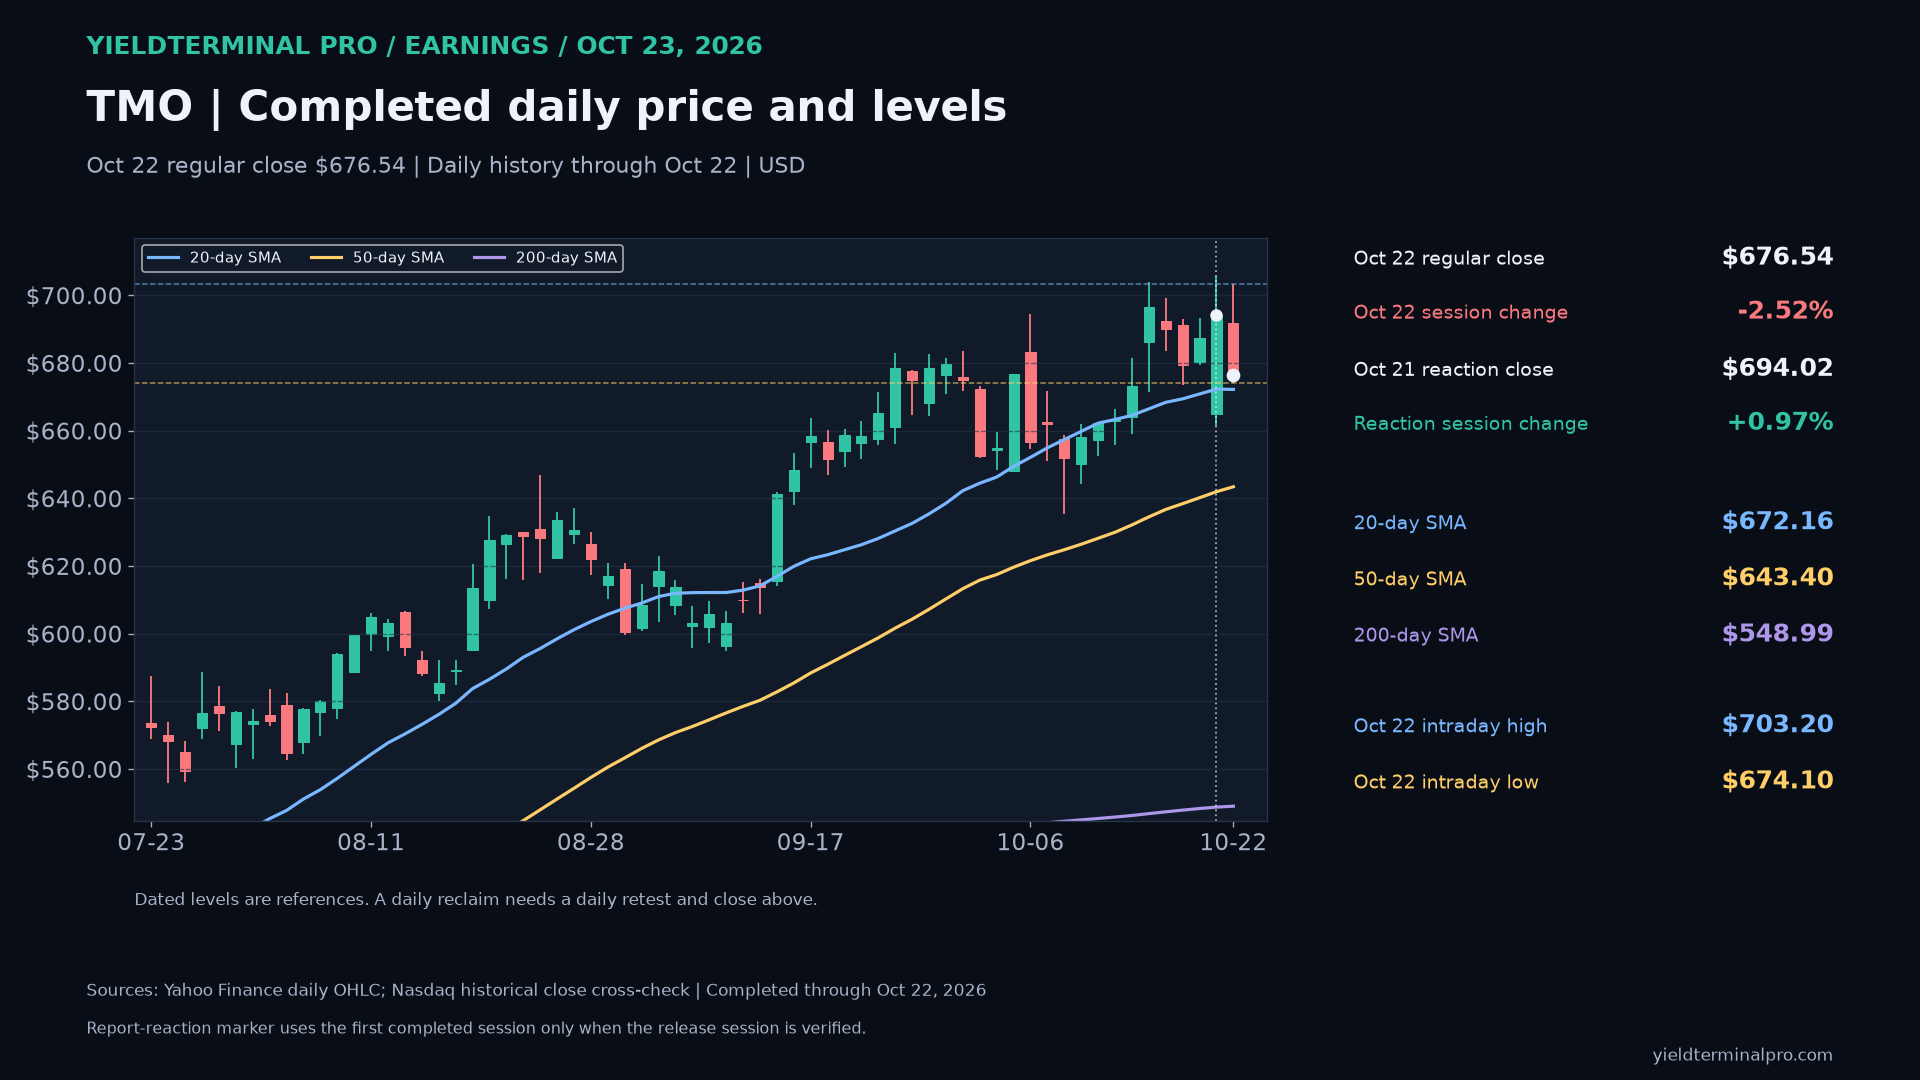
$TMOThermo Fisher Scientific Inc. — October 23 earnings review 676.54October 22 completed regular-session closeTMO closed October 22 at $676.54, above its 50-day average ($643.40) and above its 200-day average ($548.99). The October 22 high ($703.20) and low ($674.10) are dated reference levels. This is completed daily history, not an October 23 quote.
- October 22 intraday high
- 703.20
- October 22 intraday low
- 674.10
- 50-day SMA through October 22
- 643.40
- 200-day SMA through October 22
- 548.99
Levels measured over Completed US regular-session daily history through October 22, 2026. Daily averages use completed closes; earnings result and price session are separate dated evidence.. A level measured over a different window can be a different number.
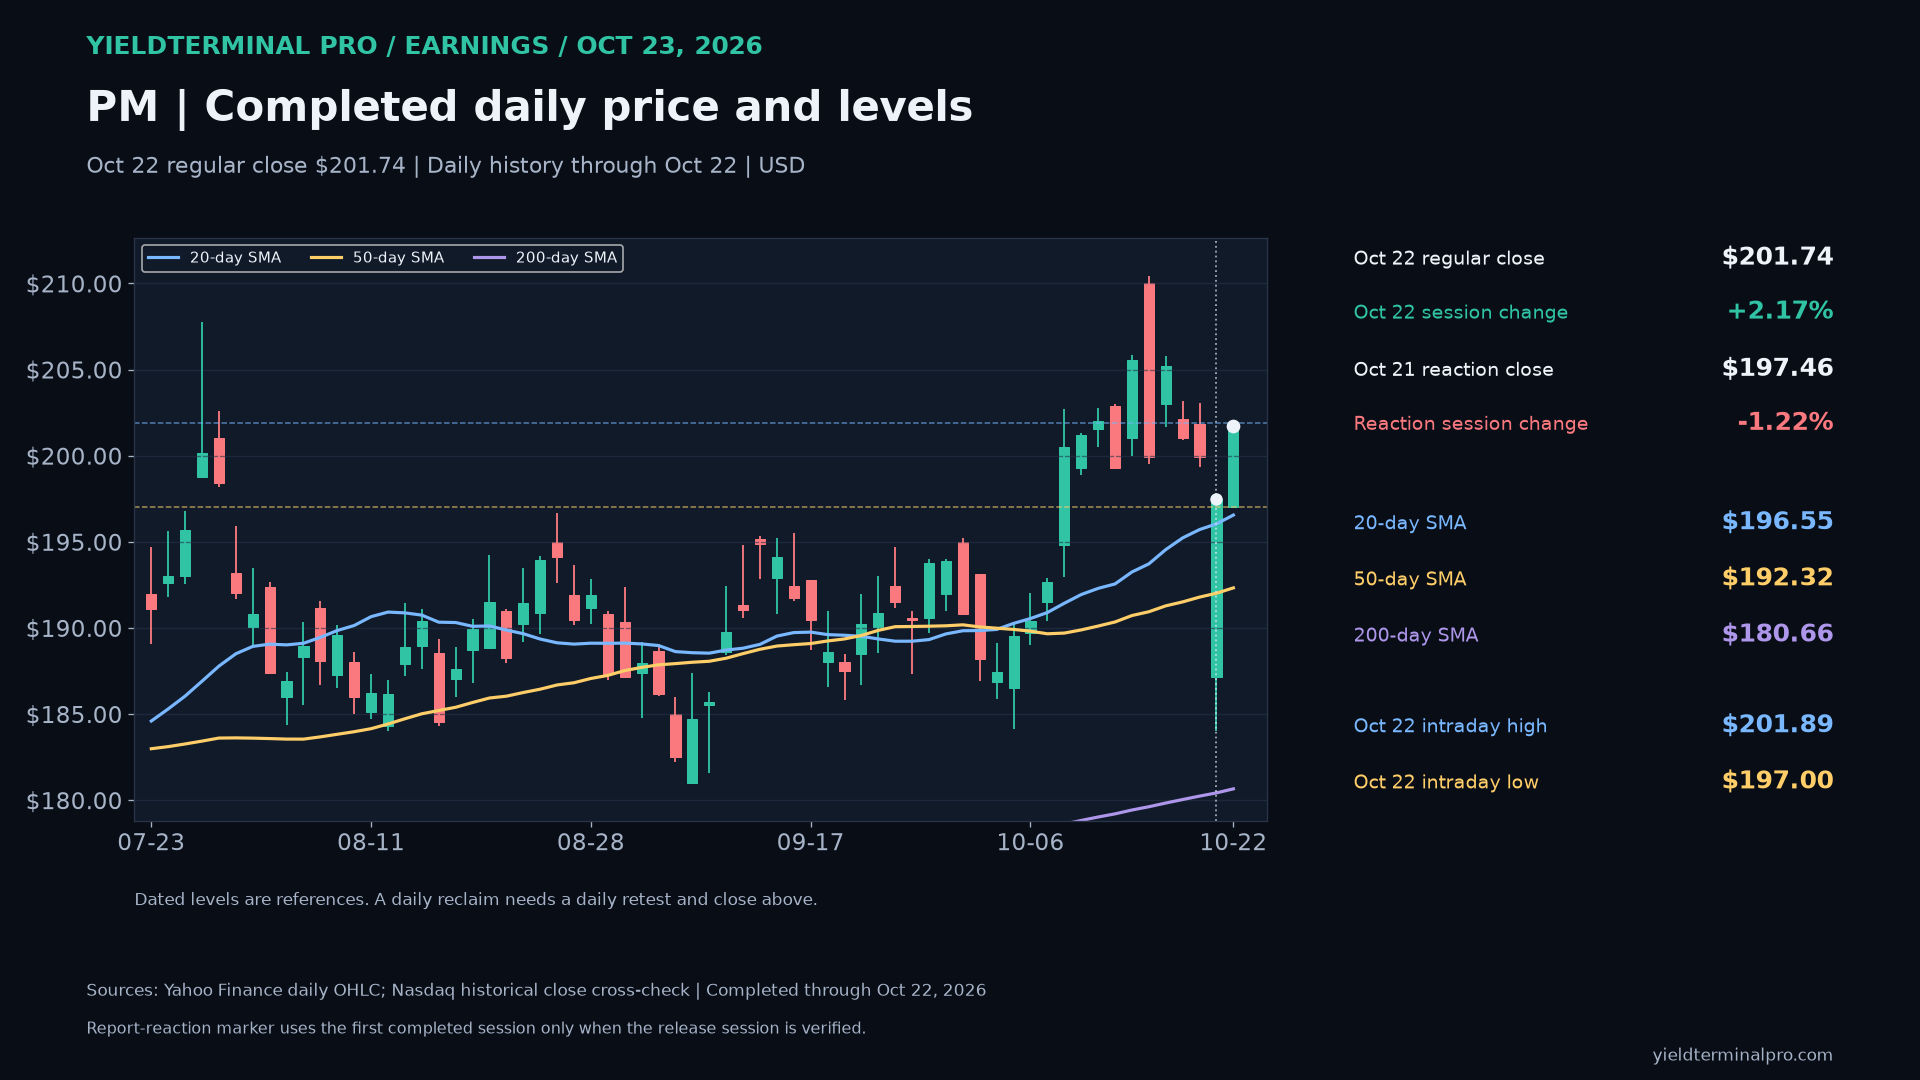
$PMPhilip Morris International — October 23 earnings review 201.74October 22 completed regular-session closePM closed October 22 at $201.74, above its 50-day average ($192.32) and above its 200-day average ($180.66). The October 22 high ($201.89) and low ($197.00) are dated reference levels. This is completed daily history, not an October 23 quote.
- October 22 intraday high
- 201.89
- October 22 intraday low
- 197.00
- 50-day SMA through October 22
- 192.32
- 200-day SMA through October 22
- 180.66
Levels measured over Completed US regular-session daily history through October 22, 2026. Daily averages use completed closes; earnings result and price session are separate dated evidence.. A level measured over a different window can be a different number.
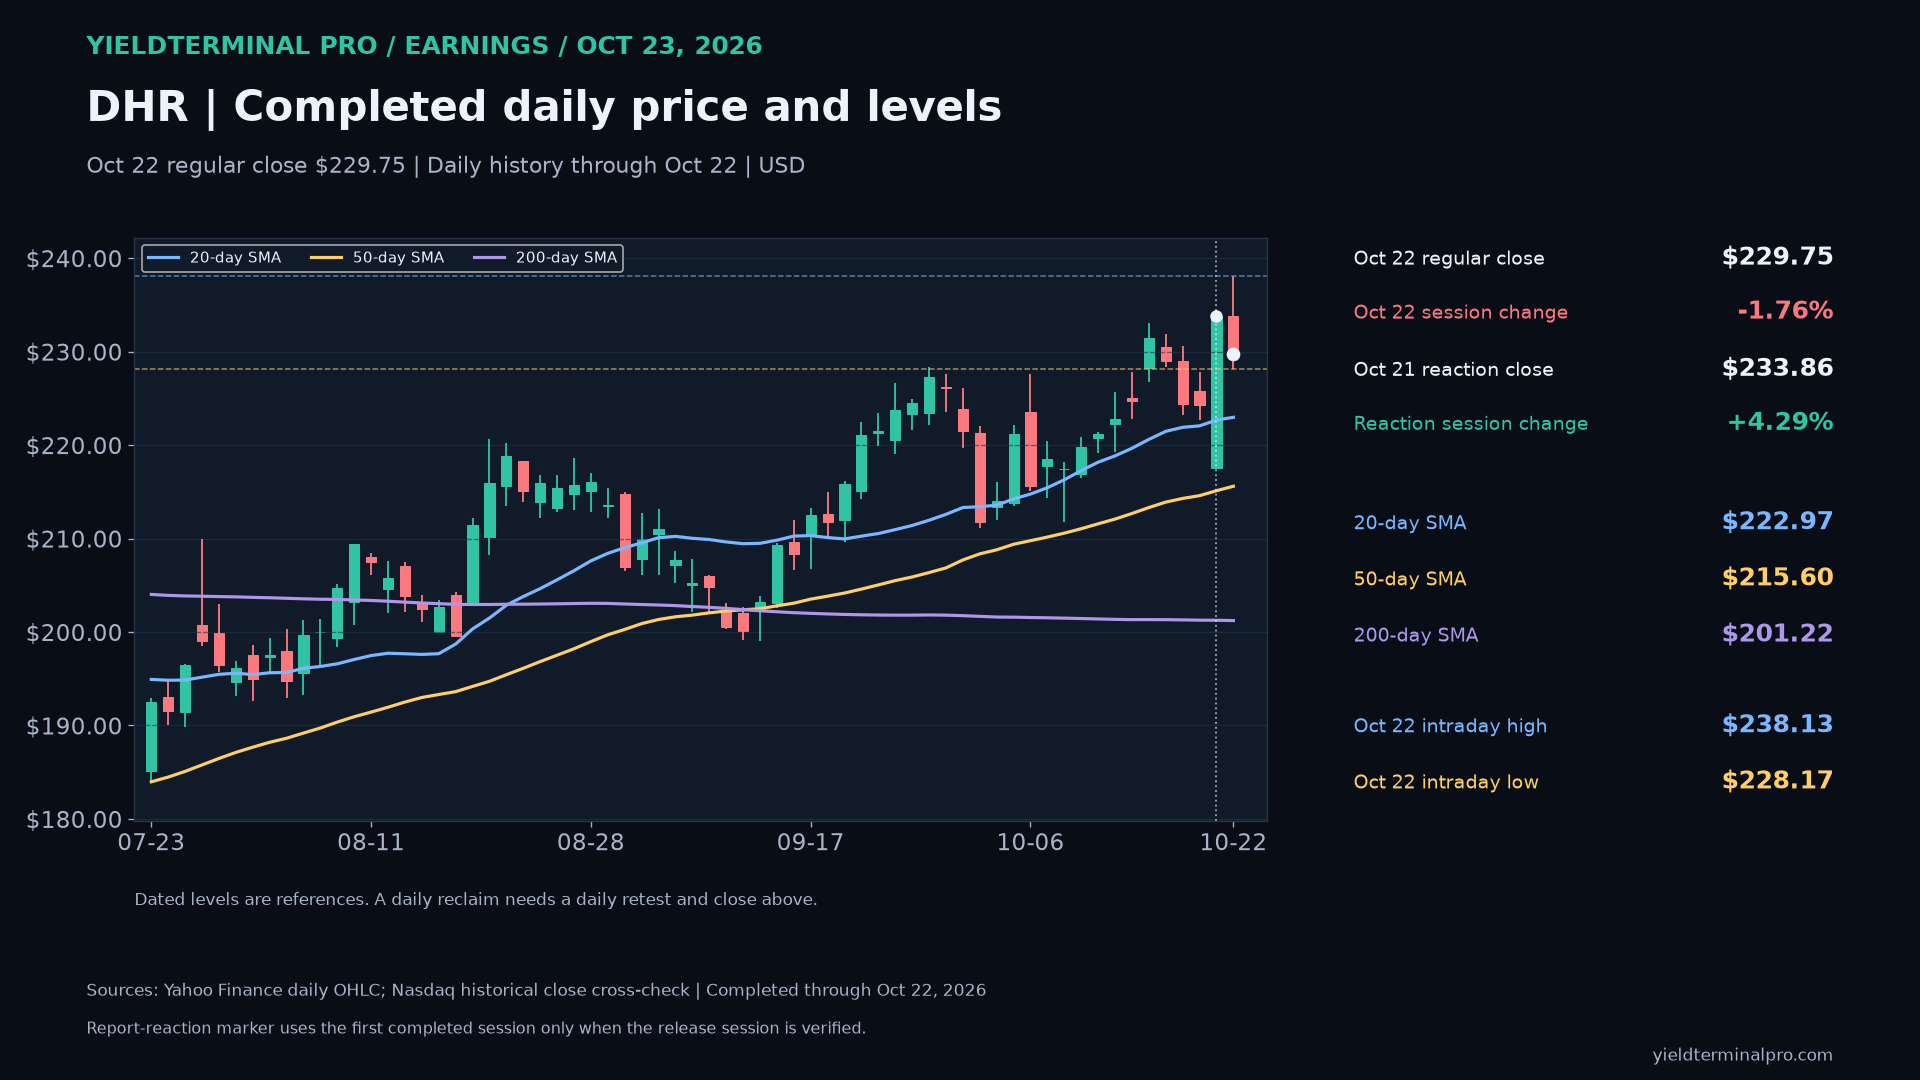
$DHRDanaher — October 23 earnings review 229.75October 22 completed regular-session closeDHR closed October 22 at $229.75, above its 50-day average ($215.60) and above its 200-day average ($201.22). The October 22 high ($238.13) and low ($228.17) are dated reference levels. This is completed daily history, not an October 23 quote.
- October 22 intraday high
- 238.13
- October 22 intraday low
- 228.17
- 50-day SMA through October 22
- 215.60
- 200-day SMA through October 22
- 201.22
Levels measured over Completed US regular-session daily history through October 22, 2026. Daily averages use completed closes; earnings result and price session are separate dated evidence.. A level measured over a different window can be a different number.
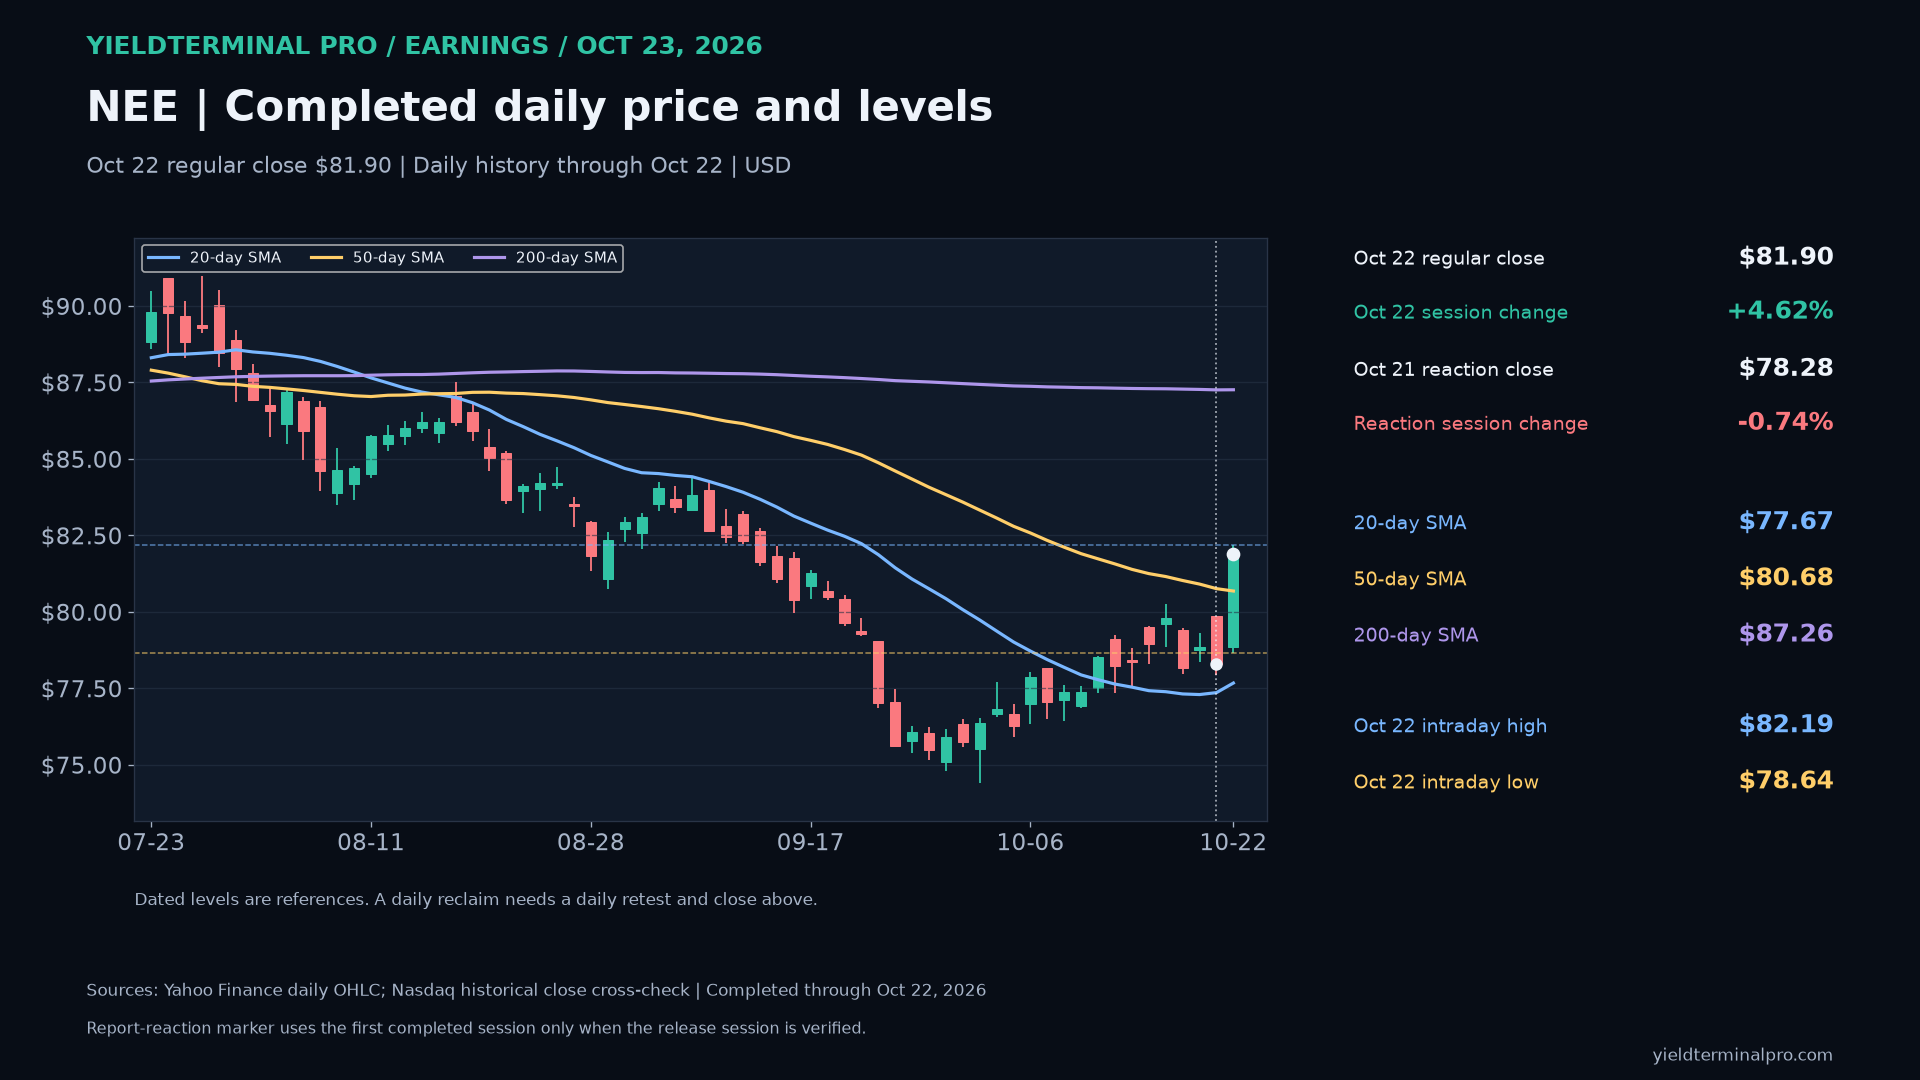
$NEENextEra Energy — October 23 earnings review 81.90October 22 completed regular-session closeNEE closed October 22 at $81.90, above its 50-day average ($80.68) and below its 200-day average ($87.26). The October 22 high ($82.19) and low ($78.64) are dated reference levels. This is completed daily history, not an October 23 quote.
- October 22 intraday high
- 82.19
- October 22 intraday low
- 78.64
- 50-day SMA through October 22
- 80.68
- 200-day SMA through October 22
- 87.26
Levels measured over Completed US regular-session daily history through October 22, 2026. Daily averages use completed closes; earnings result and price session are separate dated evidence.. A level measured over a different window can be a different number.
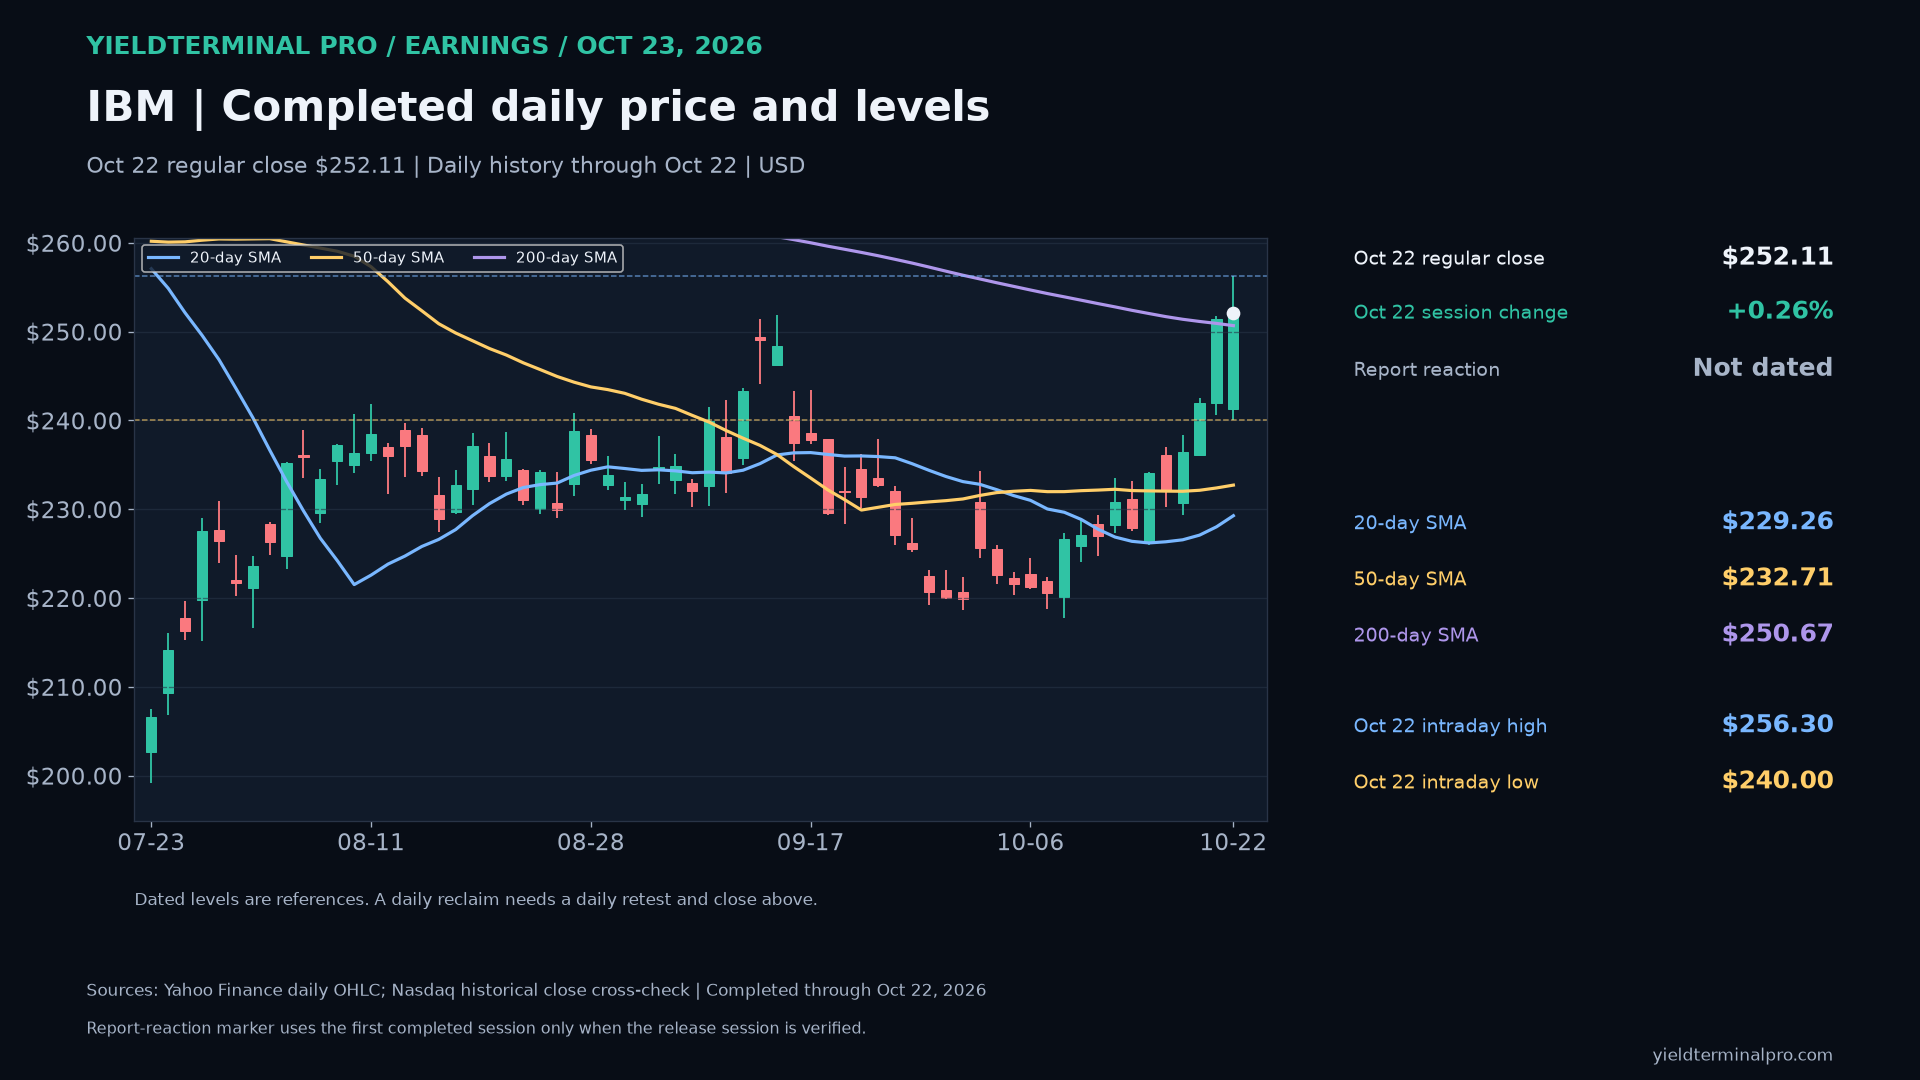
$IBMInternational Business Machines Corporation — October 23 earnings review 252.11October 22 completed regular-session closeIBM closed October 22 at $252.11, above its 50-day average ($232.71) and above its 200-day average ($250.67). The October 22 high ($256.30) and low ($240.00) are dated reference levels. This is completed daily history, not an October 23 quote.
- October 22 intraday high
- 256.30
- October 22 intraday low
- 240.00
- 50-day SMA through October 22
- 232.71
- 200-day SMA through October 22
- 250.67
Levels measured over Completed US regular-session daily history through October 22, 2026. Daily averages use completed closes; earnings result and price session are separate dated evidence.. A level measured over a different window can be a different number.
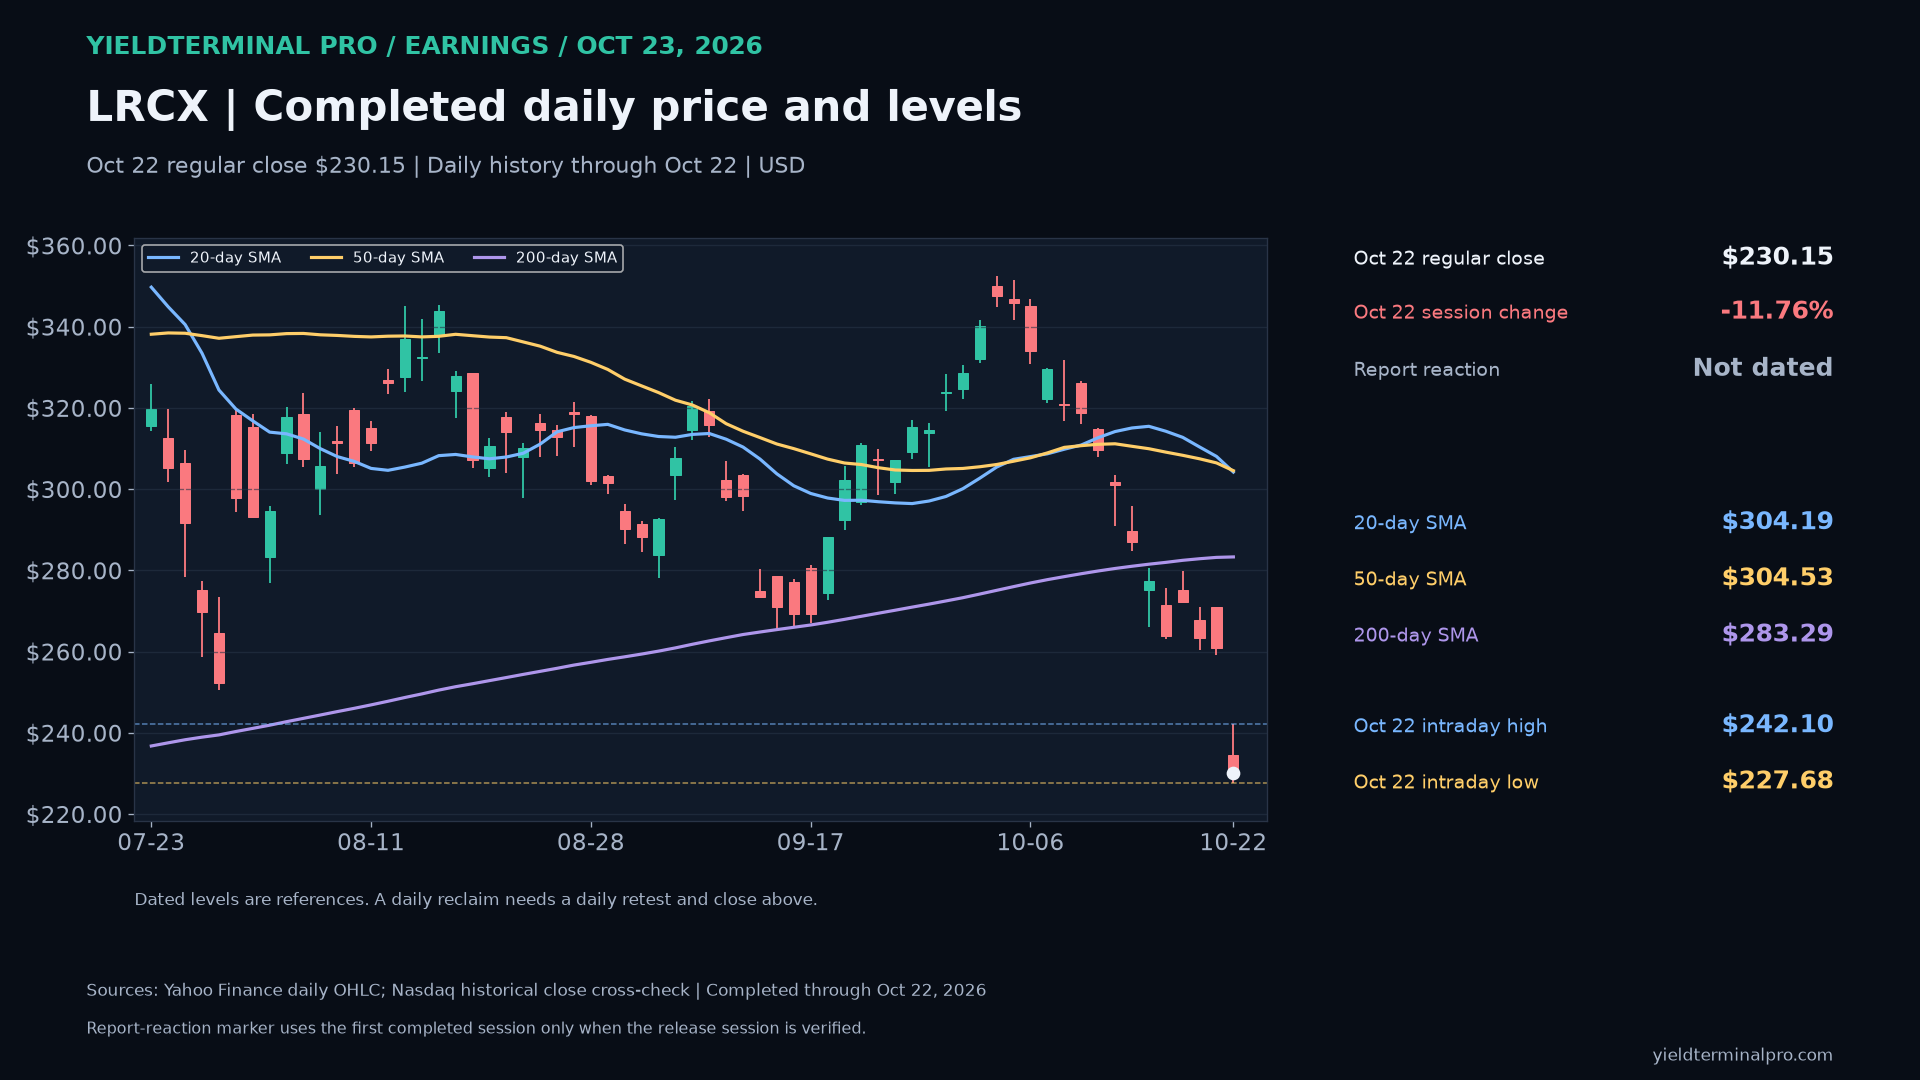
$LRCXLam Research Corporation — October 23 earnings review 230.15October 22 completed regular-session closeLRCX closed October 22 at $230.15, below its 50-day average ($304.53) and below its 200-day average ($283.29). The October 22 high ($242.10) and low ($227.68) are dated reference levels. This is completed daily history, not an October 23 quote.
- October 22 intraday high
- 242.10
- October 22 intraday low
- 227.68
- 50-day SMA through October 22
- 304.53
- 200-day SMA through October 22
- 283.29
Levels measured over Completed US regular-session daily history through October 22, 2026. Daily averages use completed closes; earnings result and price session are separate dated evidence.. A level measured over a different window can be a different number.
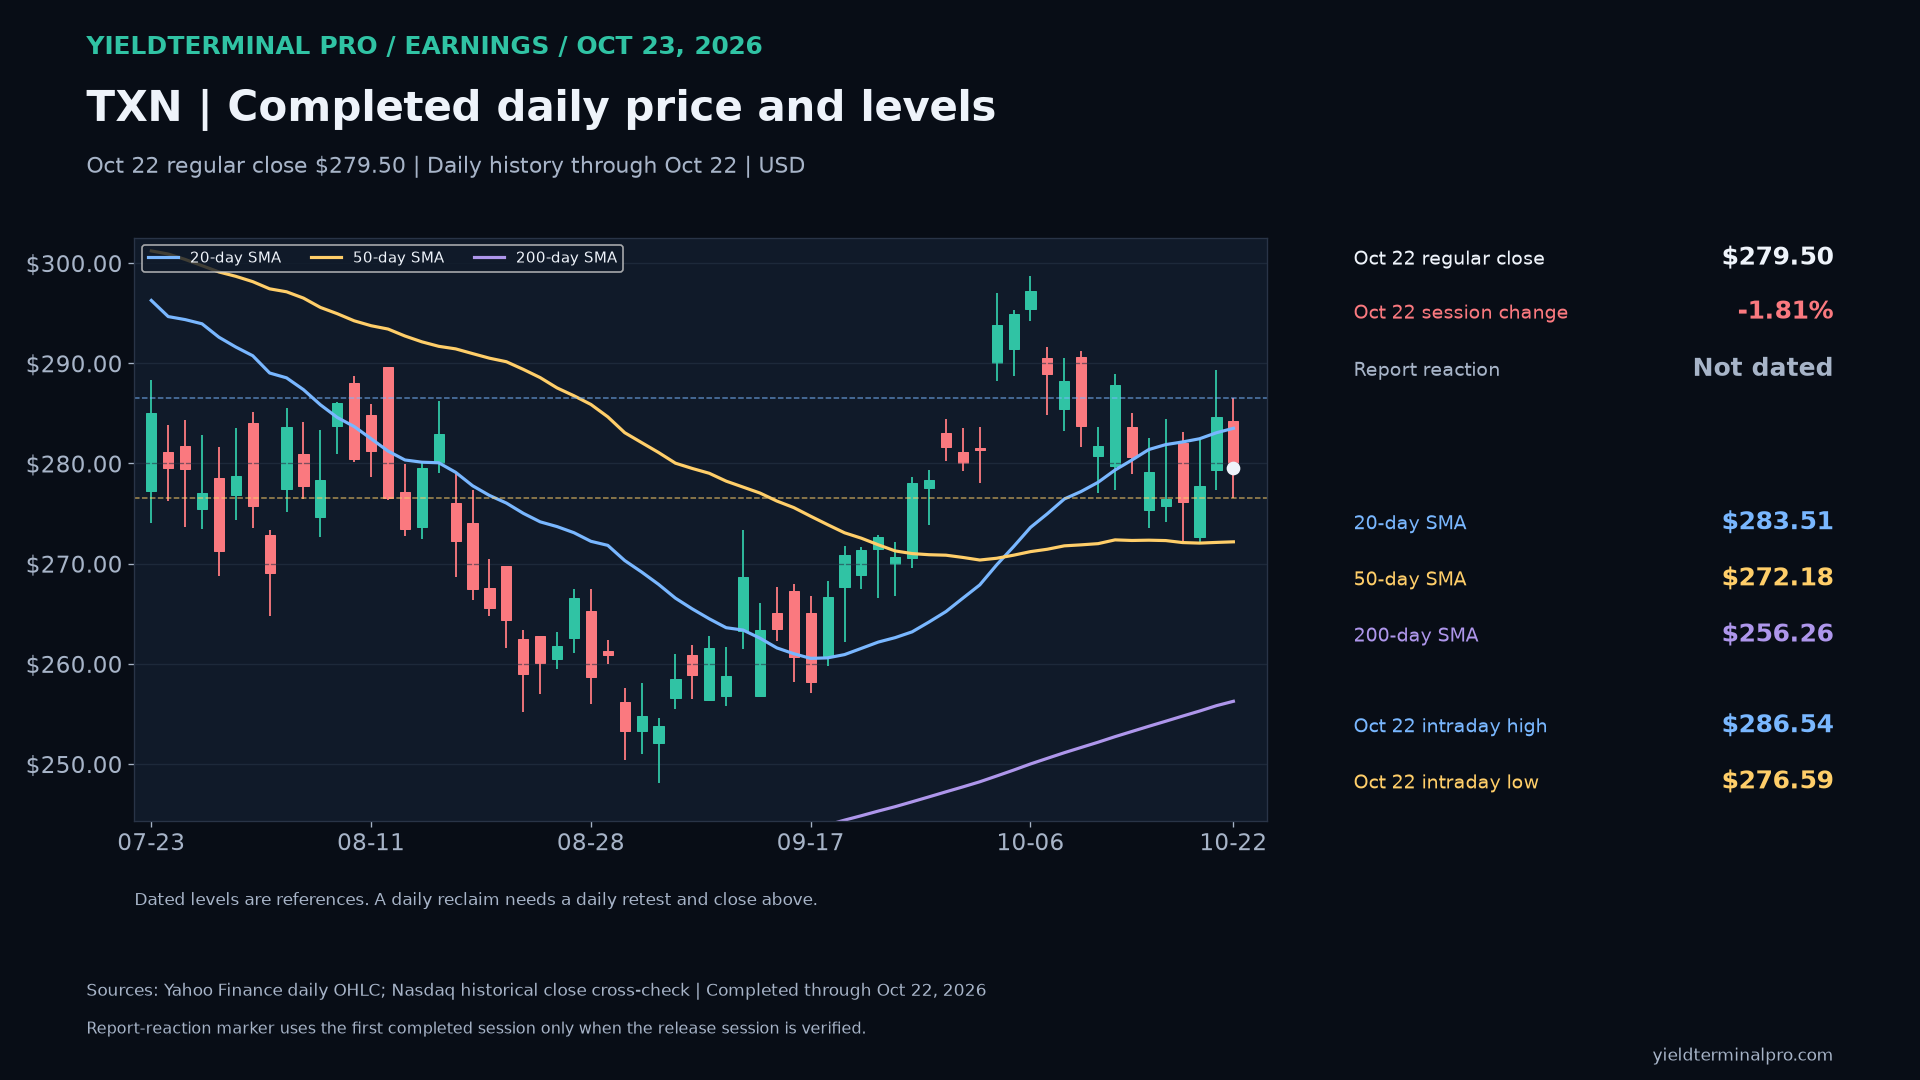
$TXNTexas Instruments Incorporated — October 23 earnings review 279.50October 22 completed regular-session closeTXN closed October 22 at $279.50, above its 50-day average ($272.18) and above its 200-day average ($256.26). The October 22 high ($286.54) and low ($276.59) are dated reference levels. This is completed daily history, not an October 23 quote.
- October 22 intraday high
- 286.54
- October 22 intraday low
- 276.59
- 50-day SMA through October 22
- 272.18
- 200-day SMA through October 22
- 256.26
Levels measured over Completed US regular-session daily history through October 22, 2026. Daily averages use completed closes; earnings result and price session are separate dated evidence.. A level measured over a different window can be a different number.
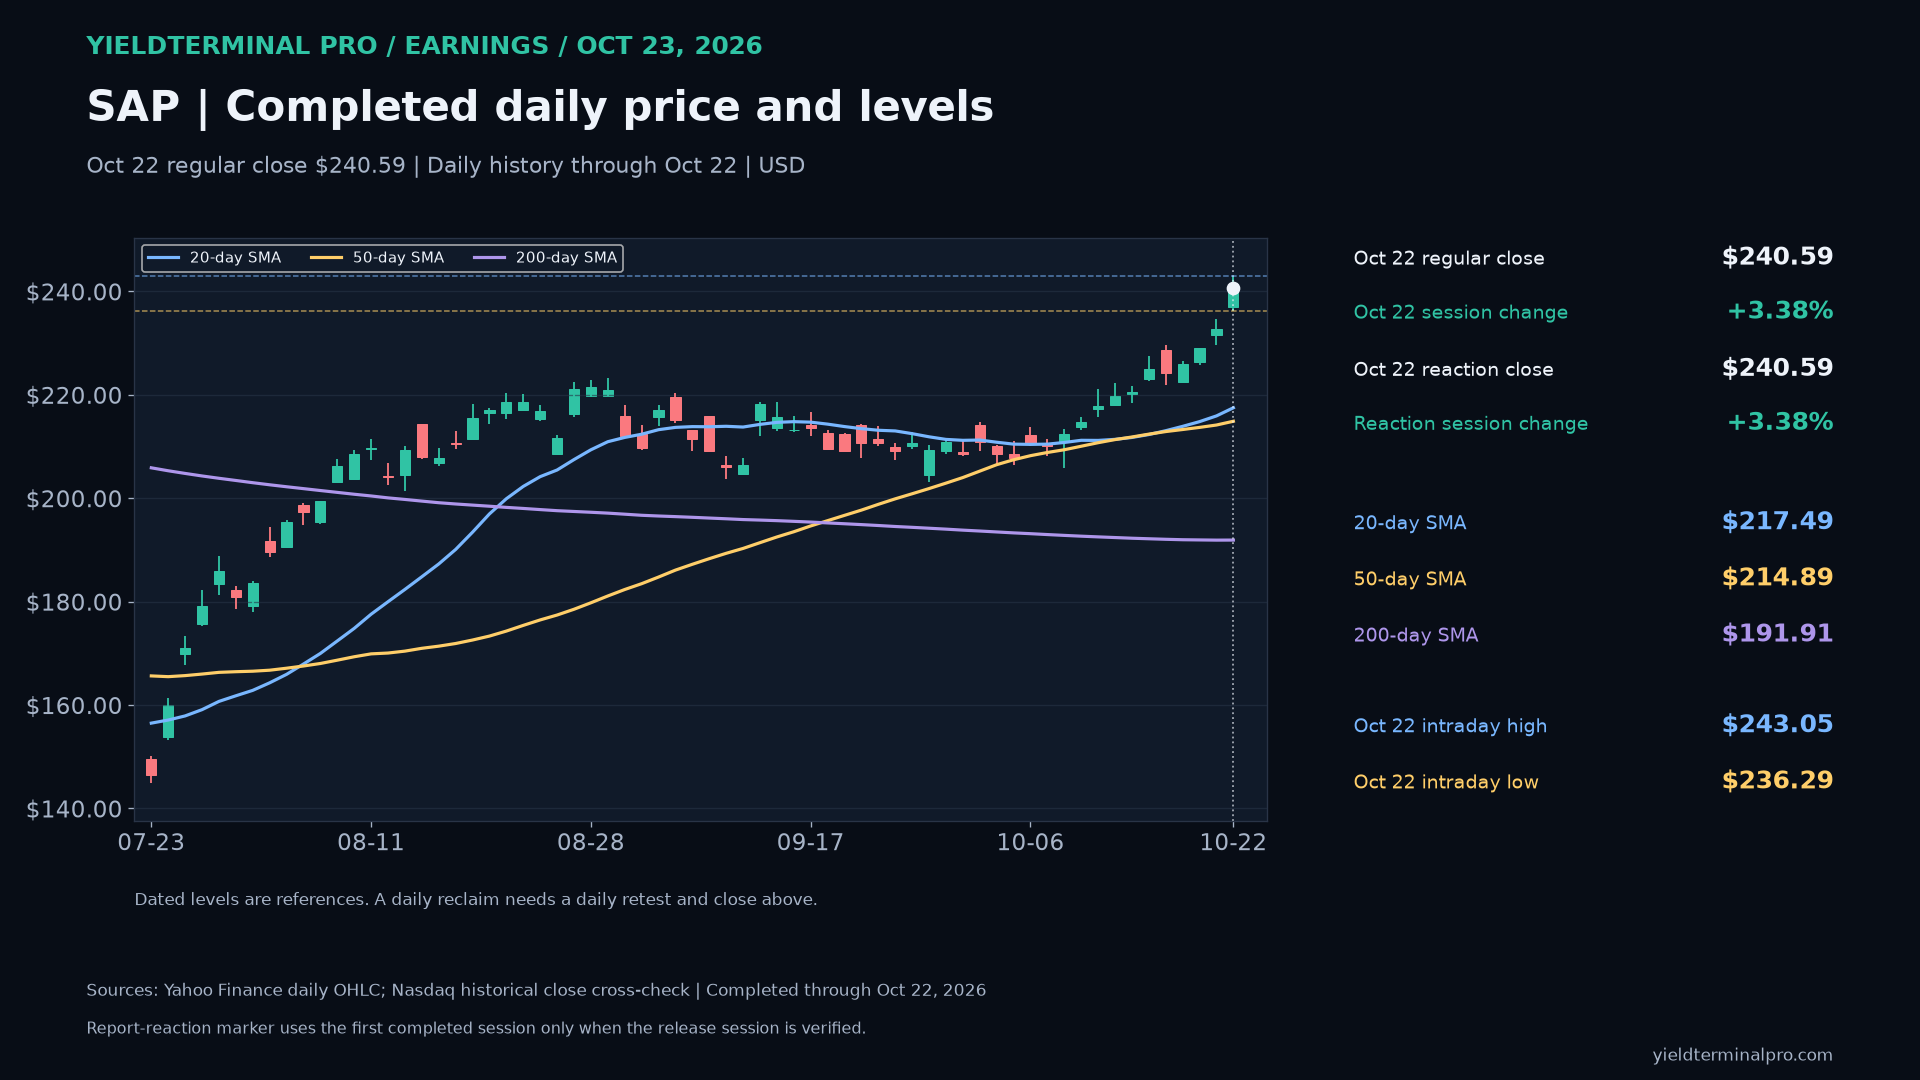
$SAPSAP SE — October 23 earnings review 240.59October 22 completed regular-session closeSAP closed October 22 at $240.59, above its 50-day average ($214.89) and above its 200-day average ($191.91). The October 22 high ($243.05) and low ($236.29) are dated reference levels. This is completed daily history, not an October 23 quote.
- October 22 intraday high
- 243.05
- October 22 intraday low
- 236.29
- 50-day SMA through October 22
- 214.89
- 200-day SMA through October 22
- 191.91
Levels measured over Completed US regular-session daily history through October 22, 2026. Daily averages use completed closes; earnings result and price session are separate dated evidence.. A level measured over a different window can be a different number.
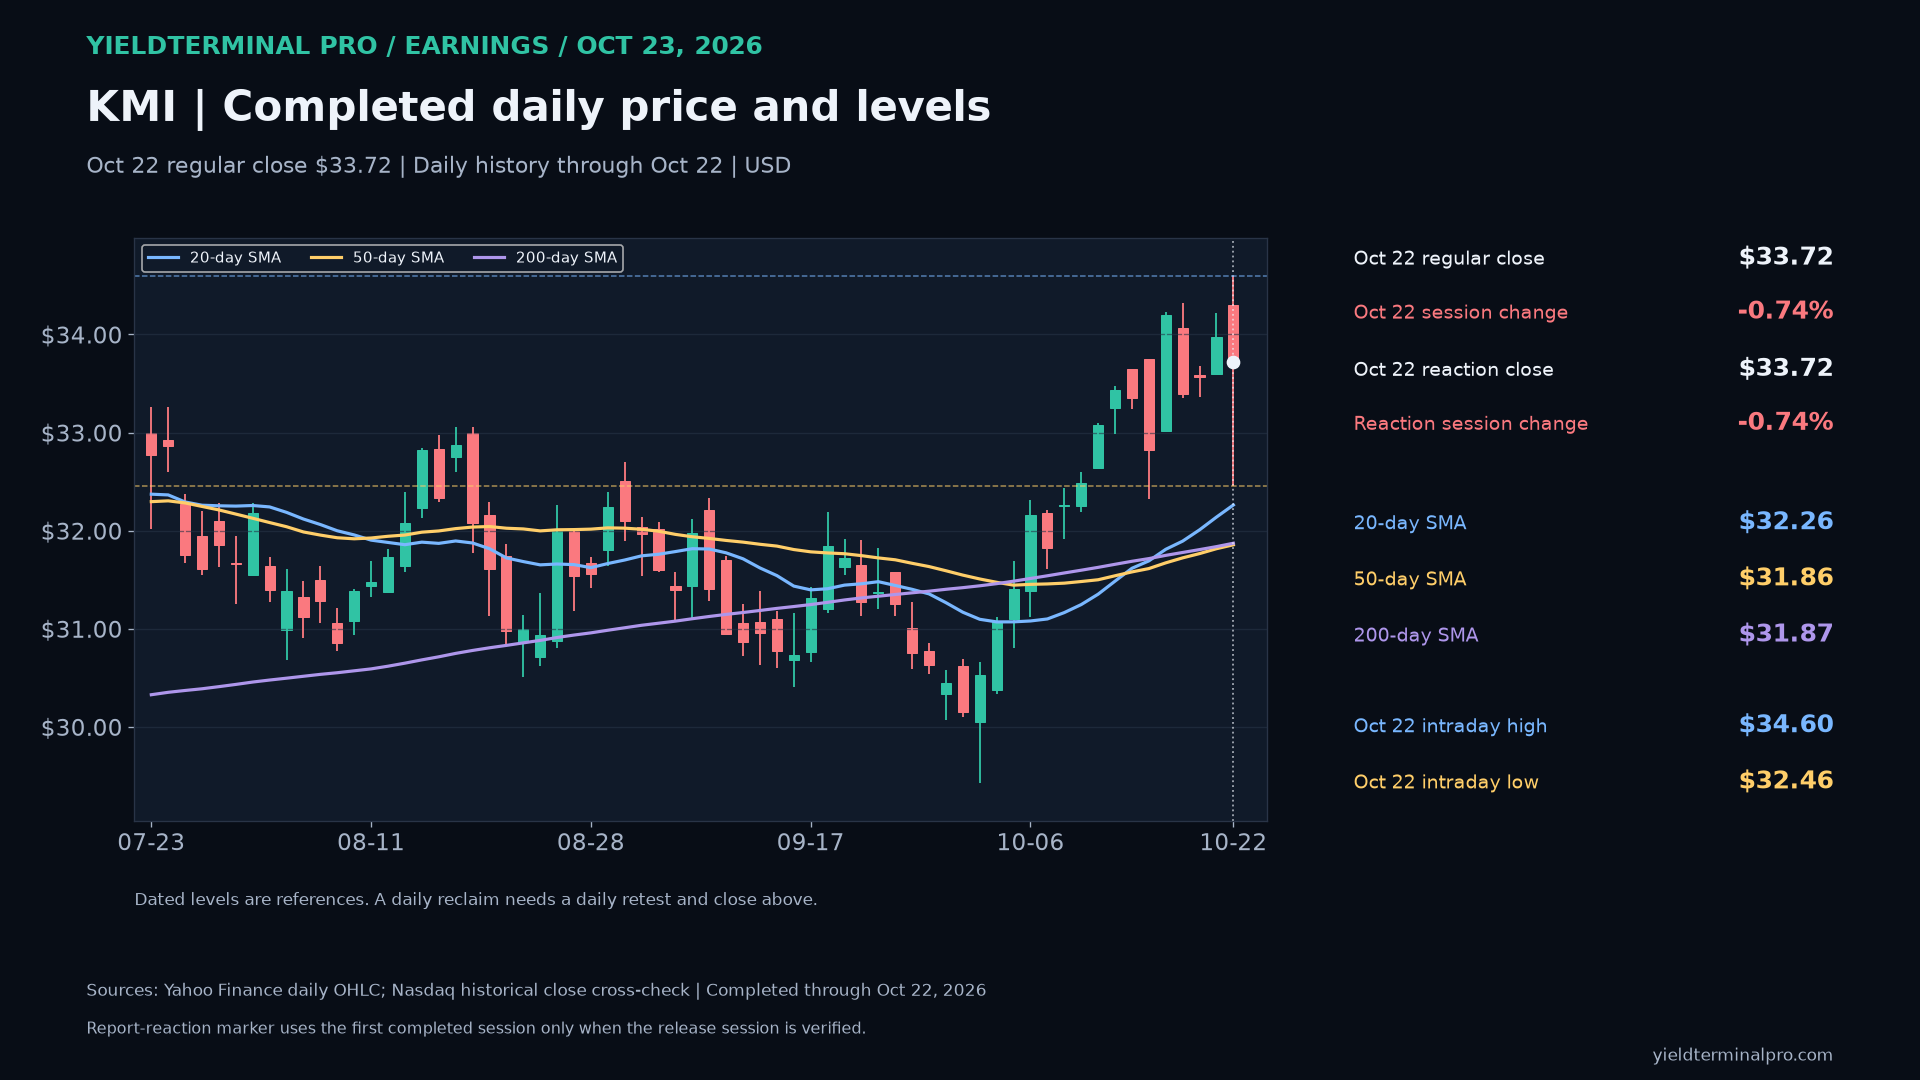
$KMIKinder Morgan — October 23 earnings review 33.72October 22 completed regular-session closeKMI closed October 22 at $33.72, above its 50-day average ($31.86) and above its 200-day average ($31.87). The October 22 high ($34.60) and low ($32.46) are dated reference levels. This is completed daily history, not an October 23 quote.
- October 22 intraday high
- 34.60
- October 22 intraday low
- 32.46
- 50-day SMA through October 22
- 31.86
- 200-day SMA through October 22
- 31.87
Levels measured over Completed US regular-session daily history through October 22, 2026. Daily averages use completed closes; earnings result and price session are separate dated evidence.. A level measured over a different window can be a different number.
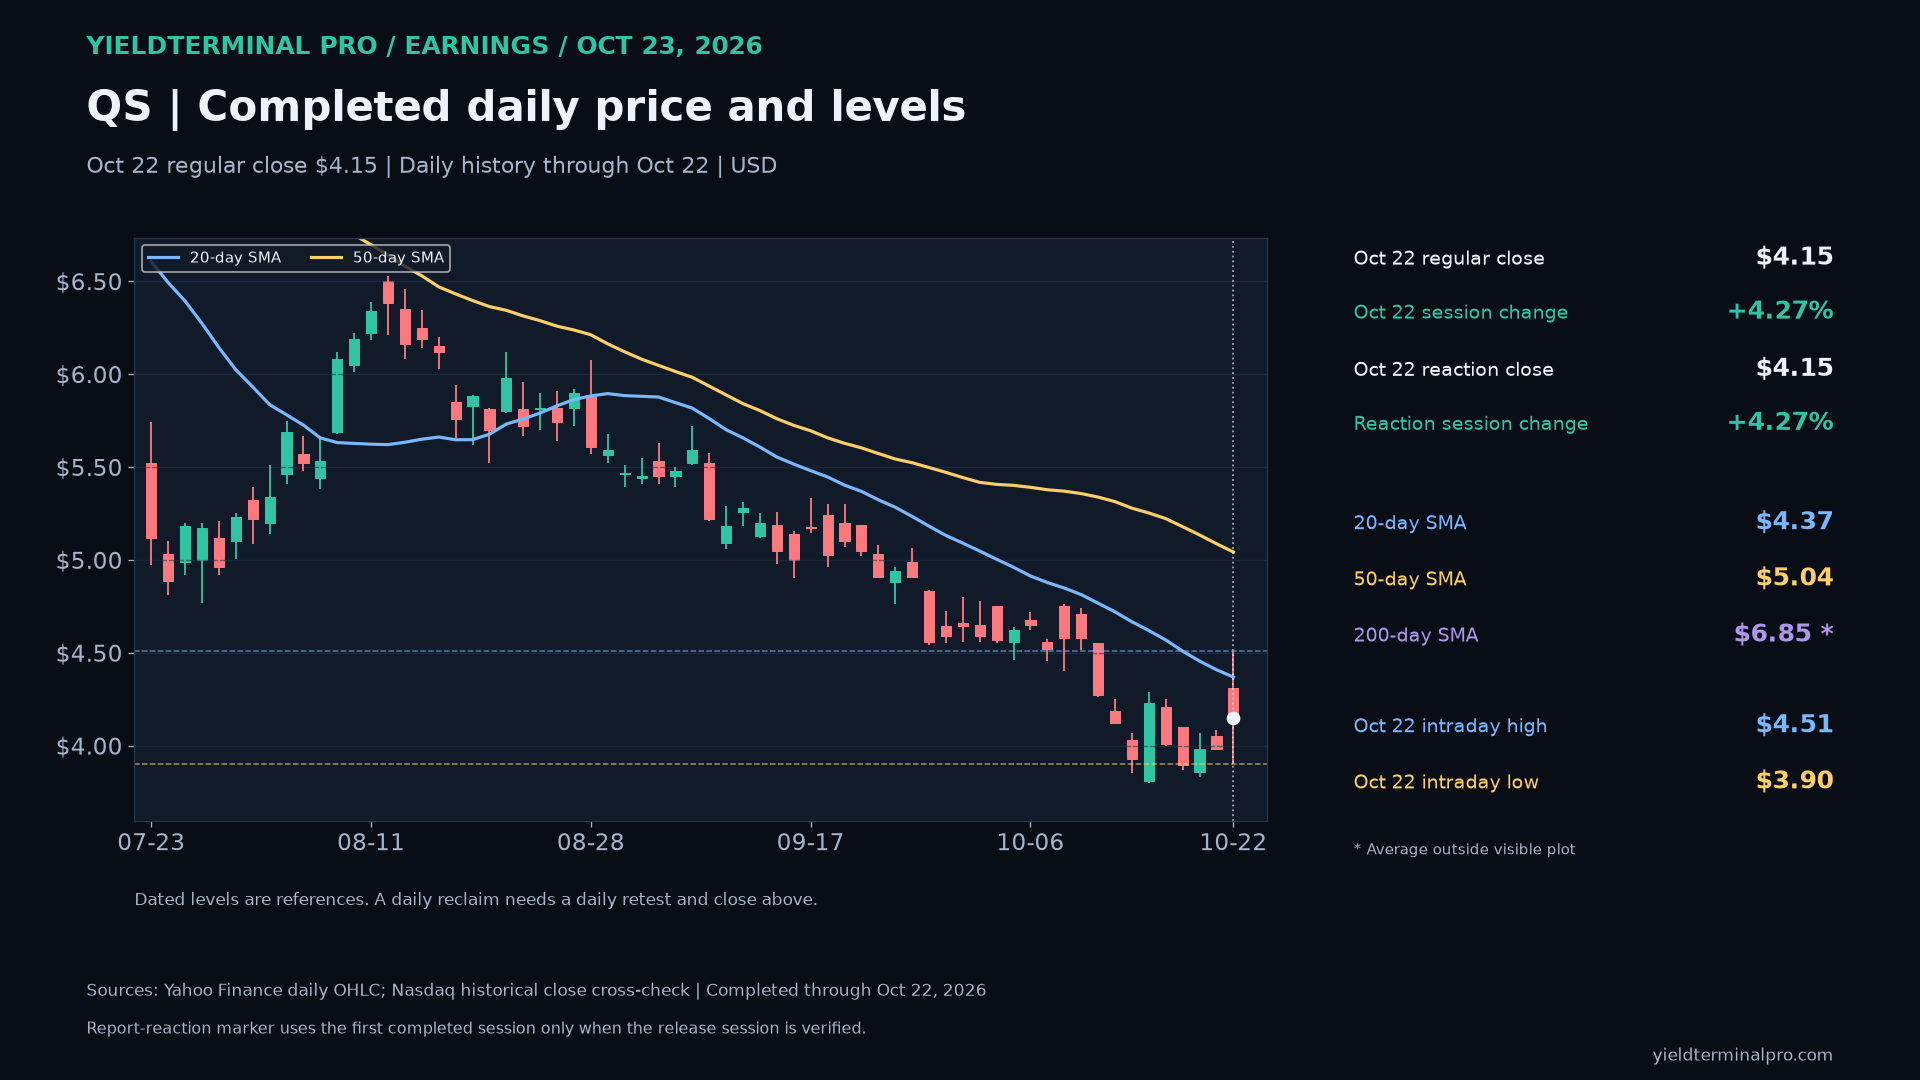
$QSQuantumScape — October 23 earnings review 4.15October 22 completed regular-session closeQS closed October 22 at $4.15, below its 50-day average ($5.04) and below its 200-day average ($6.85). The October 22 high ($4.51) and low ($3.90) are dated reference levels. This is completed daily history, not an October 23 quote. The 200-day average lies outside the visible plot.
- October 22 intraday high
- 4.51
- October 22 intraday low
- 3.90
- 50-day SMA through October 22
- 5.04
- 200-day SMA through October 22
- 6.85
Levels measured over Completed US regular-session daily history through October 22, 2026. Daily averages use completed closes; earnings result and price session are separate dated evidence.. A level measured over a different window can be a different number.
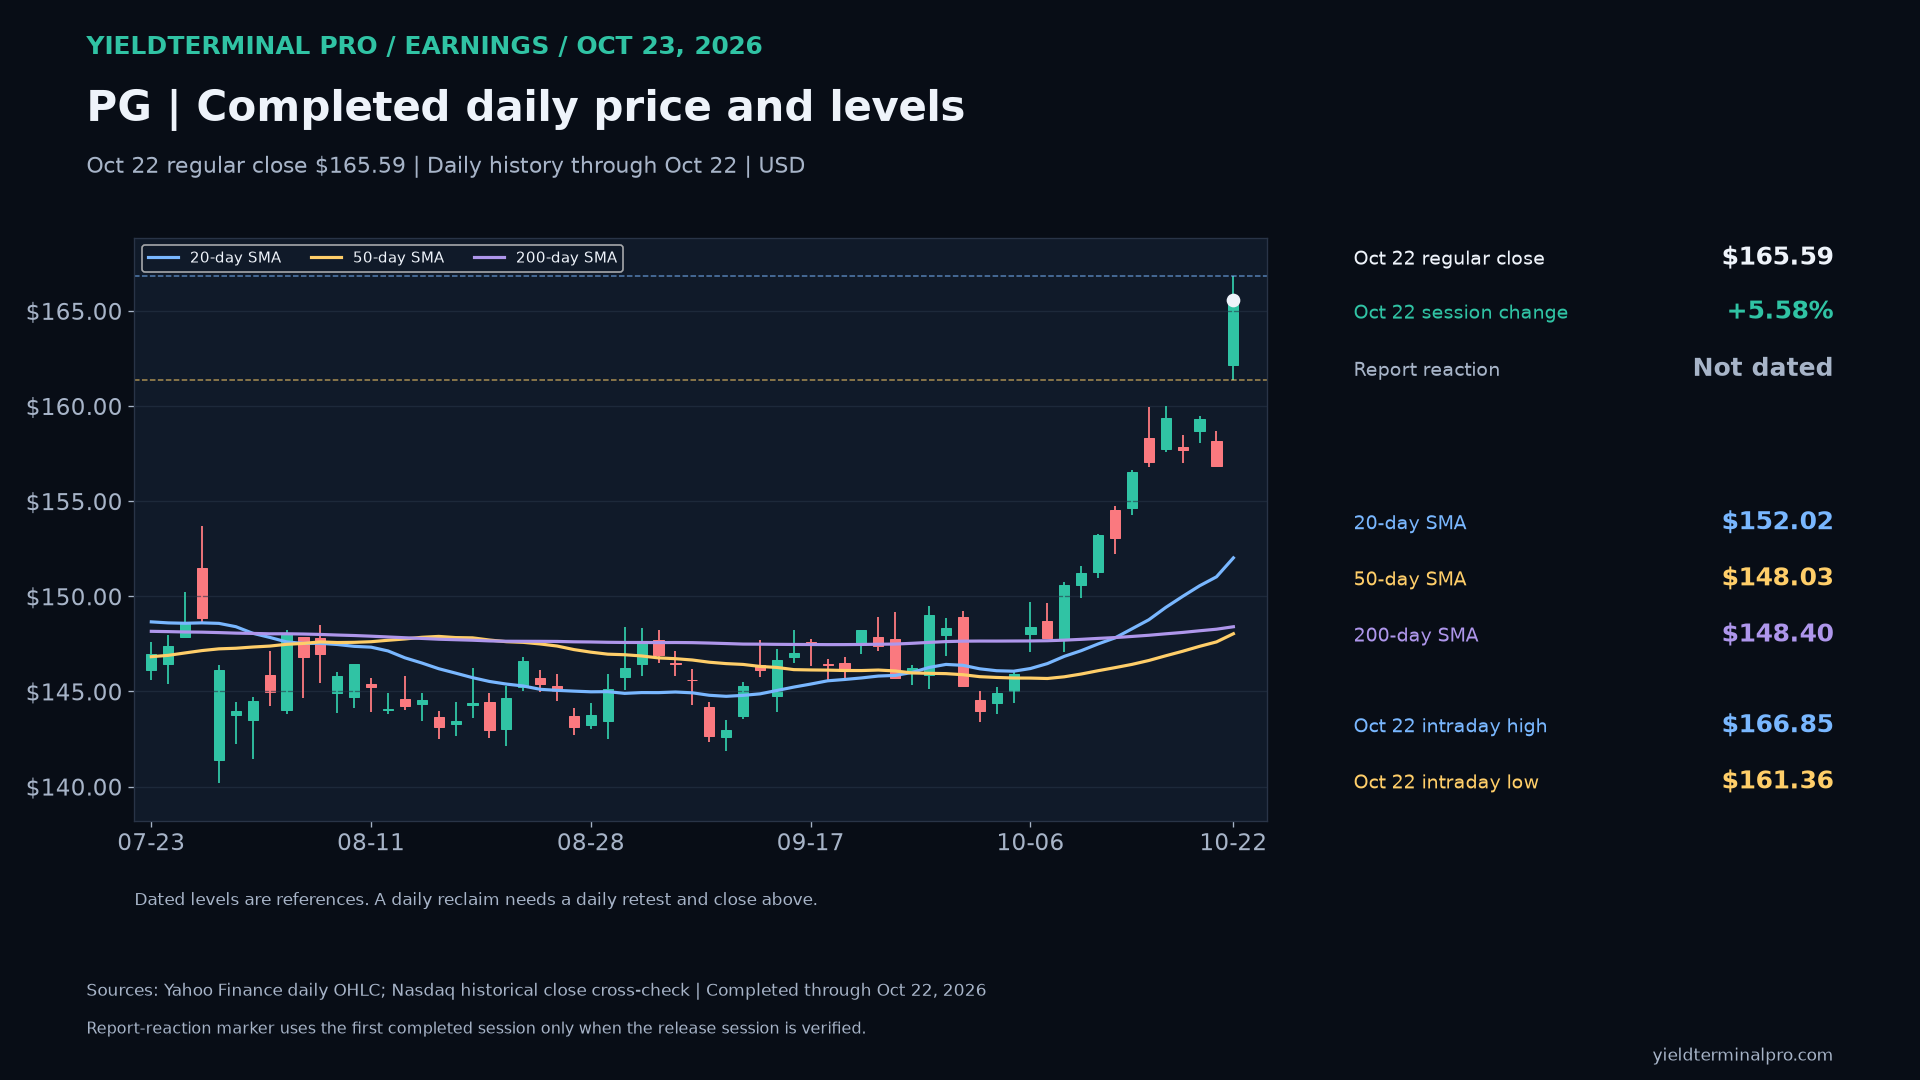
$CCICrown Castle — October 23 earnings review 78.83October 22 completed regular-session closeCCI closed October 22 at $78.83, above its 50-day average ($74.27) and below its 200-day average ($82.22). The October 22 high ($80.40) and low ($76.29) are dated reference levels. This is completed daily history, not an October 23 quote.
- October 22 intraday high
- 80.40
- October 22 intraday low
- 76.29
- 50-day SMA through October 22
- 74.27
- 200-day SMA through October 22
- 82.22
Levels measured over Completed US regular-session daily history through October 22, 2026. Daily averages use completed closes; earnings result and price session are separate dated evidence.. A level measured over a different window can be a different number.
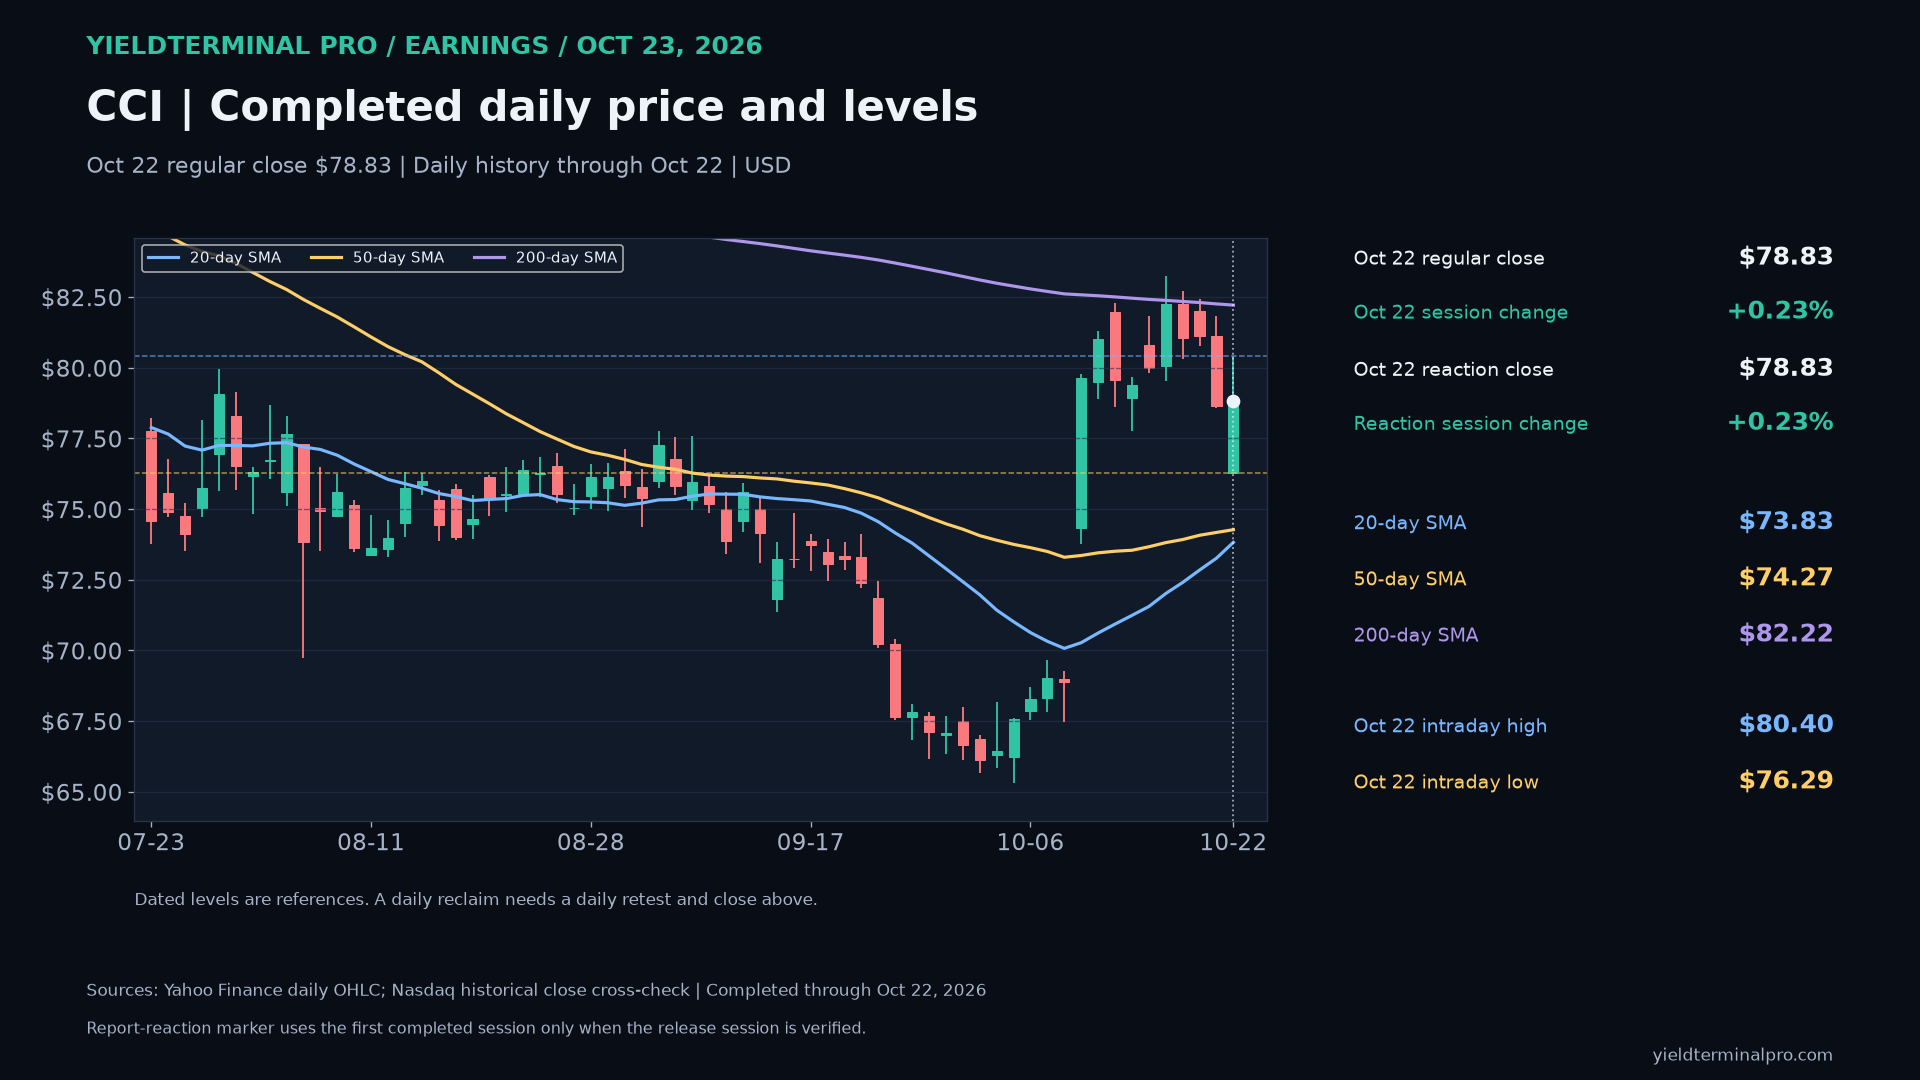
$URIUnited Rentals — October 23 earnings review 1,111.02October 22 completed regular-session closeURI closed October 22 at $1,111.02, above its 50-day average ($1,045.87) and above its 200-day average ($963.78). The October 22 high ($1,117.64) and low ($1,046.68) are dated reference levels. This is completed daily history, not an October 23 quote.
- October 22 intraday high
- 1,117.64
- October 22 intraday low
- 1,046.68
- 50-day SMA through October 22
- 1,045.87
- 200-day SMA through October 22
- 963.78
Levels measured over Completed US regular-session daily history through October 22, 2026. Daily averages use completed closes; earnings result and price session are separate dated evidence.. A level measured over a different window can be a different number.
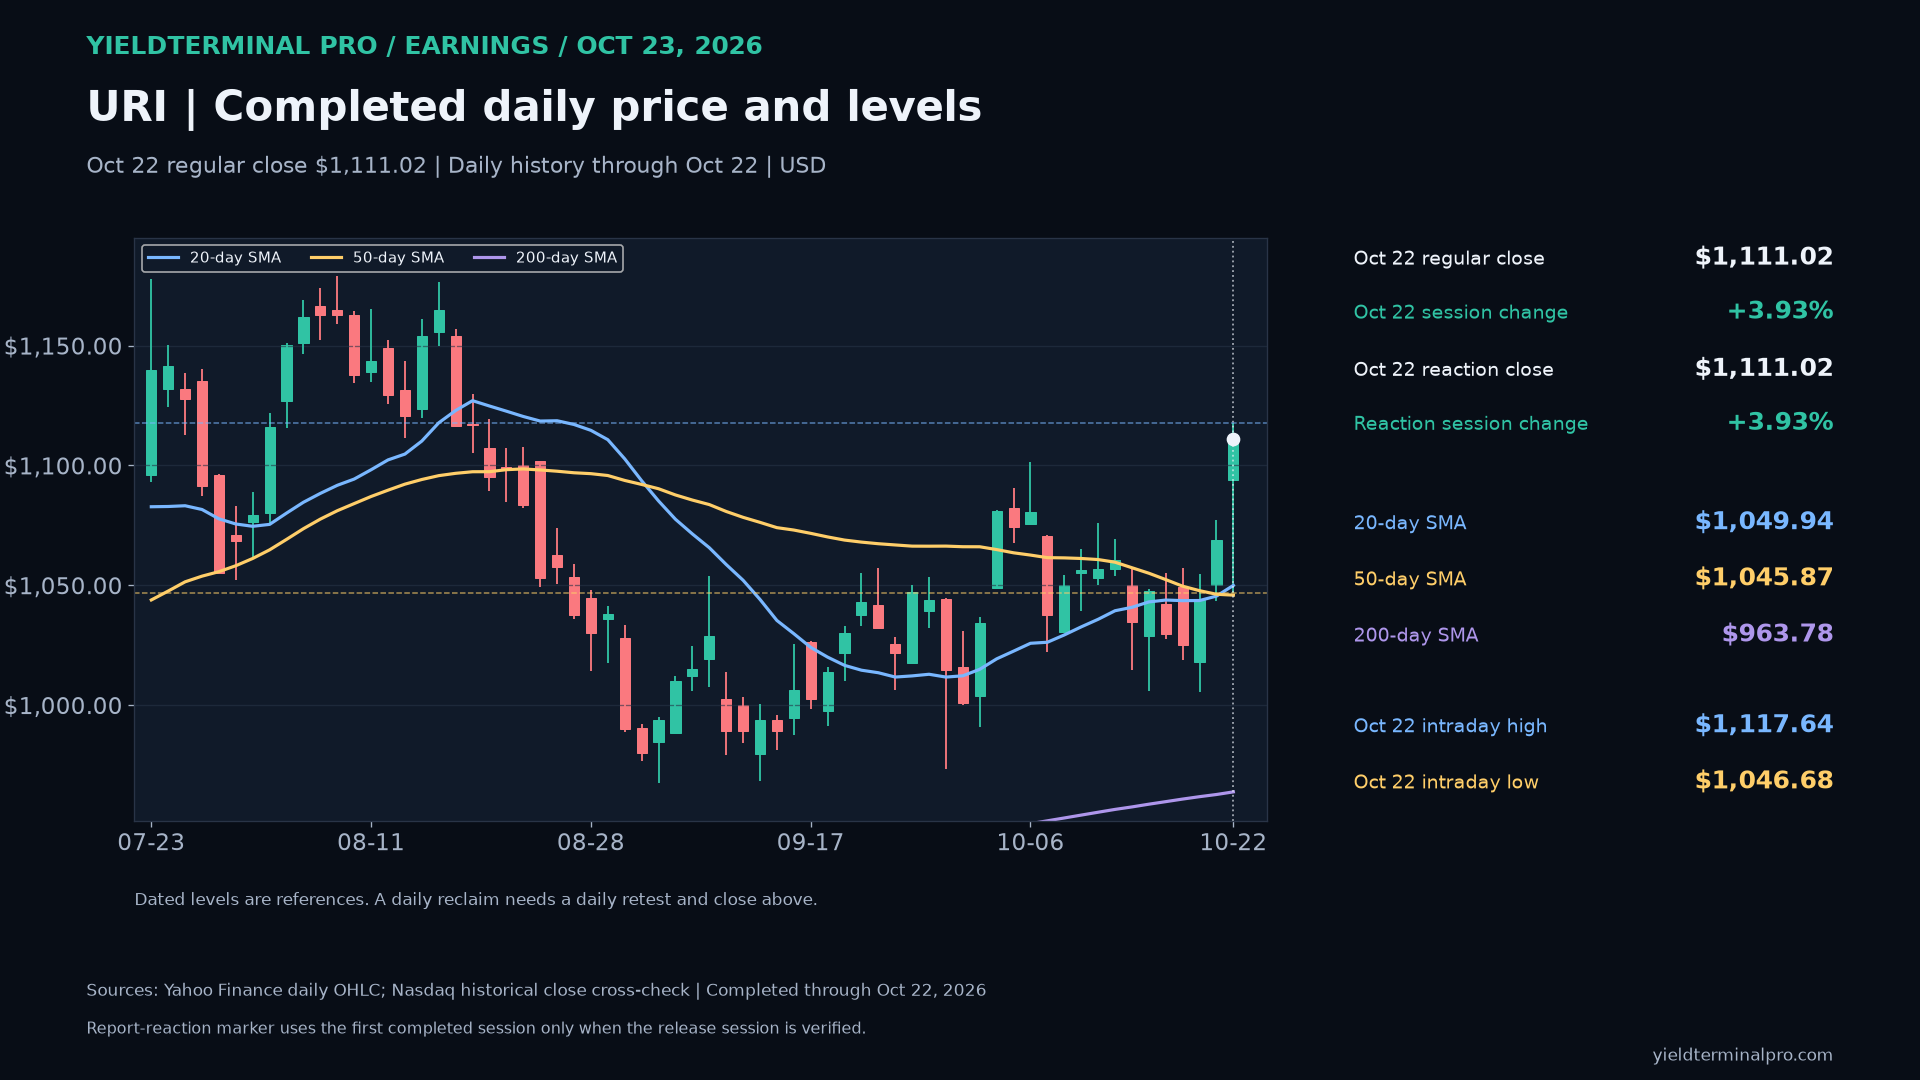
$SPOTSpotify Technology S.A. — October 23 earnings review 583.66October 22 completed regular-session closeSPOT closed October 22 at $583.66, above its 50-day average ($524.29) and above its 200-day average ($496.54). The October 22 high ($588.88) and low ($555.32) are dated reference levels. This is completed daily history, not an October 23 quote.
- October 22 intraday high
- 588.88
- October 22 intraday low
- 555.32
- 50-day SMA through October 22
- 524.29
- 200-day SMA through October 22
- 496.54
Levels measured over Completed US regular-session daily history through October 22, 2026. Daily averages use completed closes; earnings result and price session are separate dated evidence.. A level measured over a different window can be a different number.
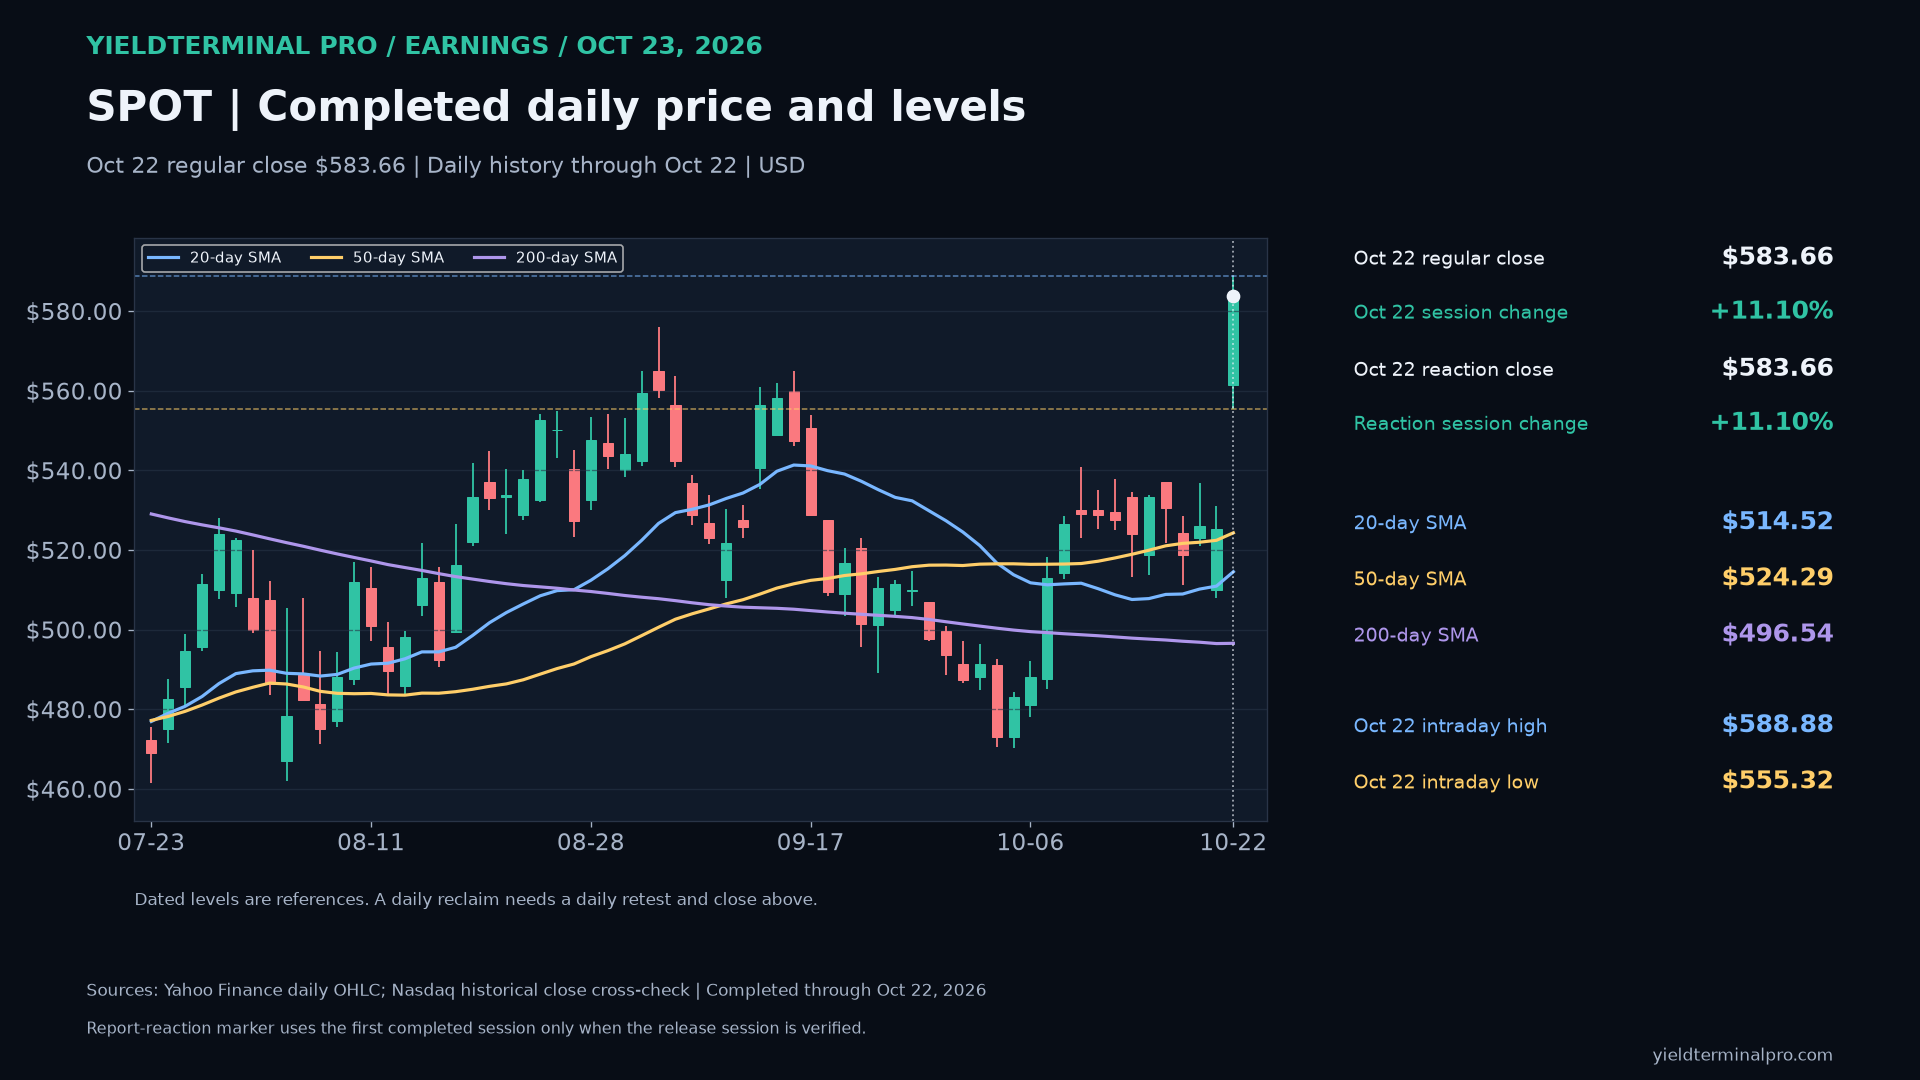
$PGThe Procter & Gamble Company — October 23 earnings review 165.59October 22 completed regular-session closePG closed October 22 at $165.59, above its 50-day average ($148.03) and above its 200-day average ($148.40). The October 22 high ($166.85) and low ($161.36) are dated reference levels. This is completed daily history, not an October 23 quote.
- October 22 intraday high
- 166.85
- October 22 intraday low
- 161.36
- 50-day SMA through October 22
- 148.03
- 200-day SMA through October 22
- 148.40
Levels measured over Completed US regular-session daily history through October 22, 2026. Daily averages use completed closes; earnings result and price session are separate dated evidence.. A level measured over a different window can be a different number.
$LMTLockheed Martin Corporation — October 23 earnings review 589.91October 22 completed regular-session closeLMT closed October 22 at $589.91, above its 50-day average ($540.01) and above its 200-day average ($565.75). The October 22 high ($608.00) and low ($577.24) are dated reference levels. This is completed daily history, not an October 23 quote.
- October 22 intraday high
- 608.00
- October 22 intraday low
- 577.24
- 50-day SMA through October 22
- 540.01
- 200-day SMA through October 22
- 565.75
Levels measured over Completed US regular-session daily history through October 22, 2026. Daily averages use completed closes; earnings result and price session are separate dated evidence.. A level measured over a different window can be a different number.
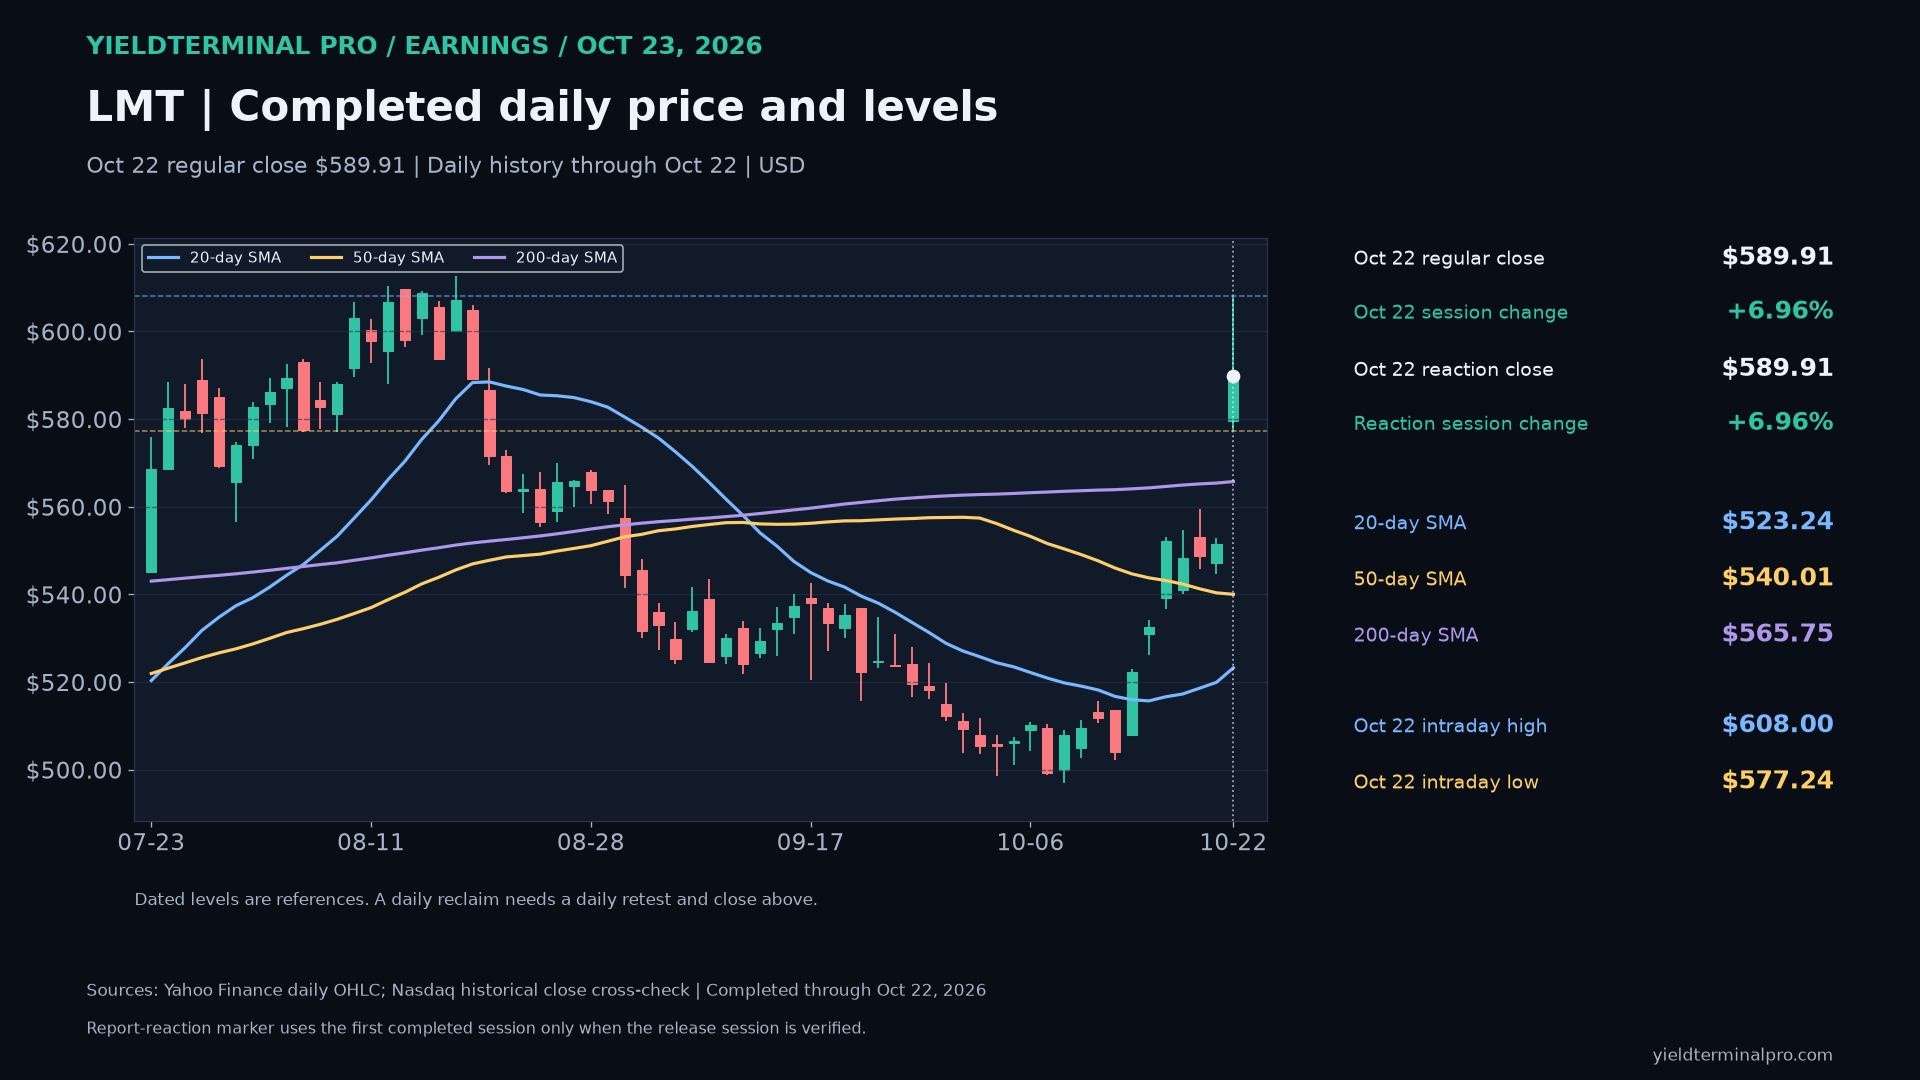
$AALAmerican Airlines — October 23 earnings review 12.60October 22 completed regular-session closeAAL closed October 22 at $12.60, below its 50-day average ($13.17) and below its 200-day average ($13.62). The October 22 high ($12.71) and low ($11.70) are dated reference levels. This is completed daily history, not an October 23 quote.
- October 22 intraday high
- 12.71
- October 22 intraday low
- 11.70
- 50-day SMA through October 22
- 13.17
- 200-day SMA through October 22
- 13.62
Levels measured over Completed US regular-session daily history through October 22, 2026. Daily averages use completed closes; earnings result and price session are separate dated evidence.. A level measured over a different window can be a different number.
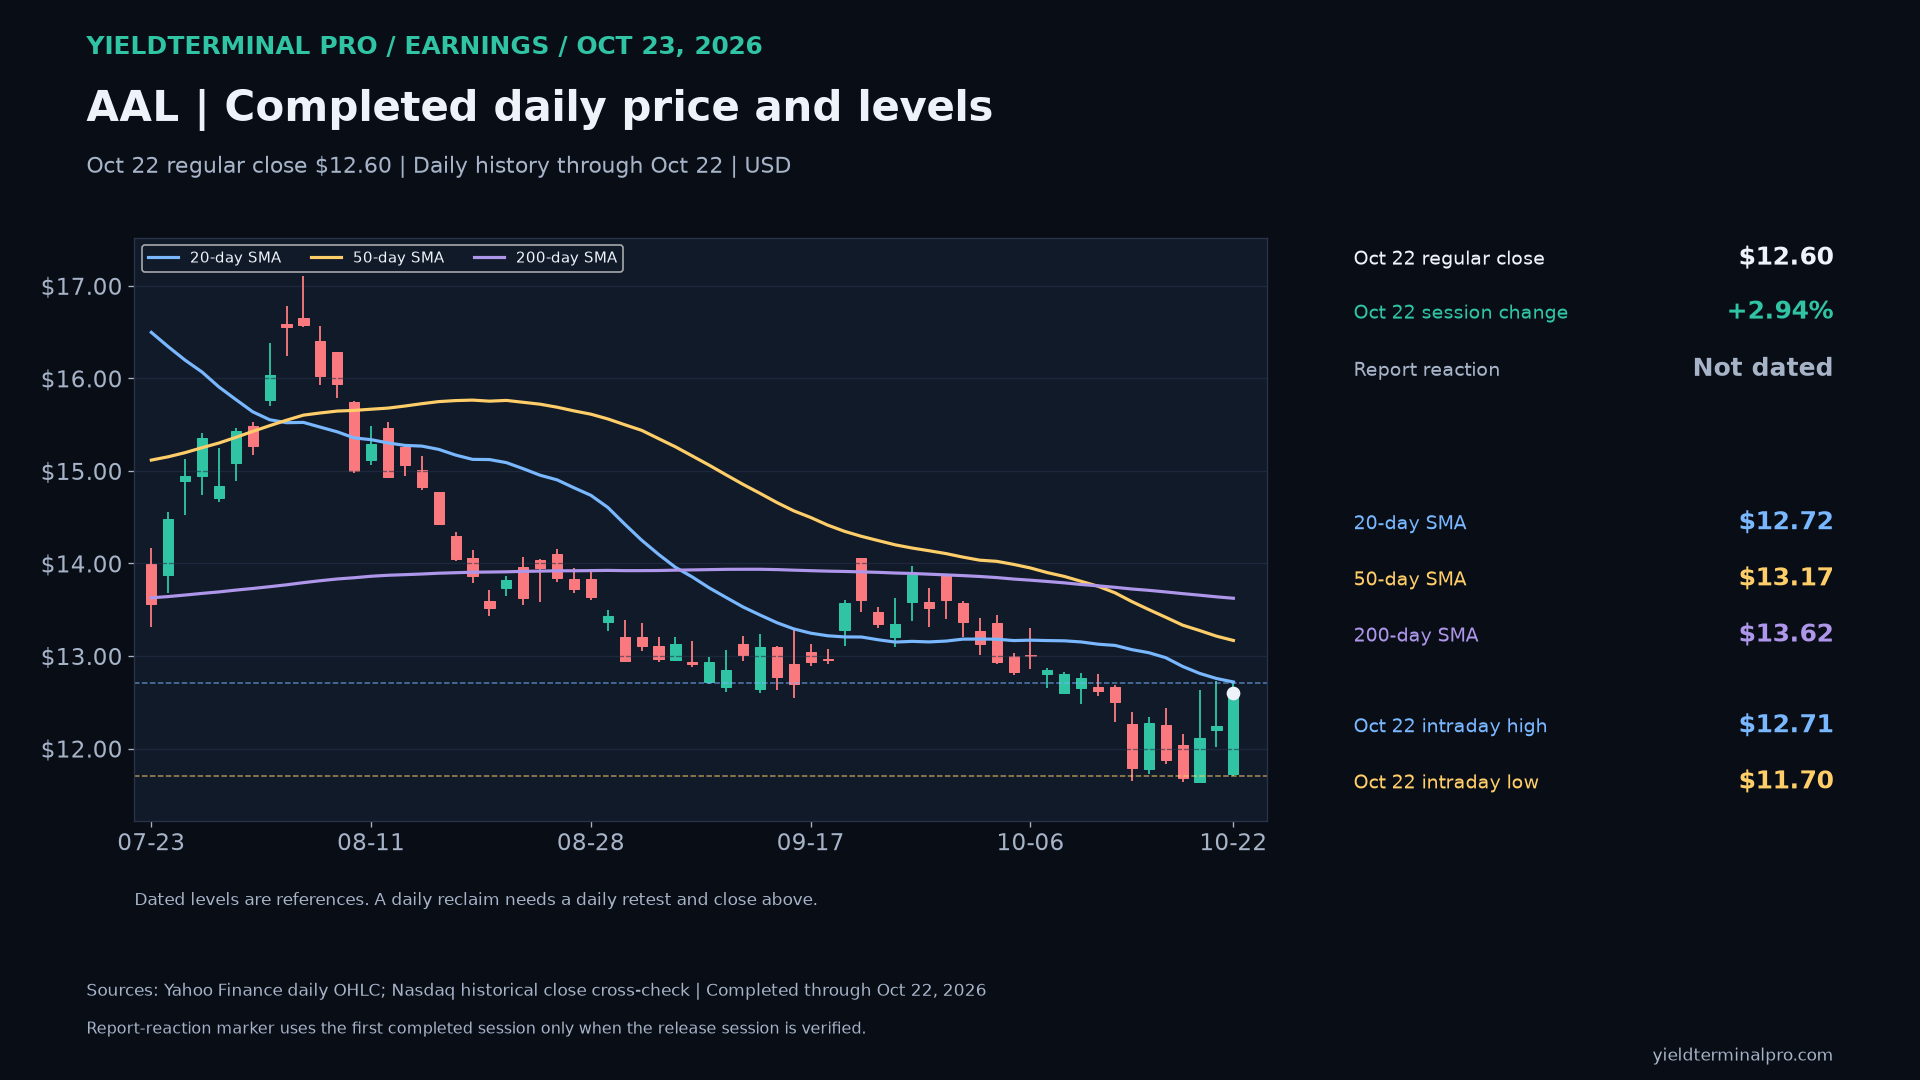
$NOKNokia — October 23 earnings review 7.88October 22 completed regular-session closeNOK closed October 22 at $7.88, below its 50-day average ($10.17) and below its 200-day average ($10.24). The October 22 high ($8.62) and low ($7.78) are dated reference levels. This is completed daily history, not an October 23 quote.
- October 22 intraday high
- 8.62
- October 22 intraday low
- 7.78
- 50-day SMA through October 22
- 10.17
- 200-day SMA through October 22
- 10.24
Levels measured over Completed US regular-session daily history through October 22, 2026. Daily averages use completed closes; earnings result and price session are separate dated evidence.. A level measured over a different window can be a different number.
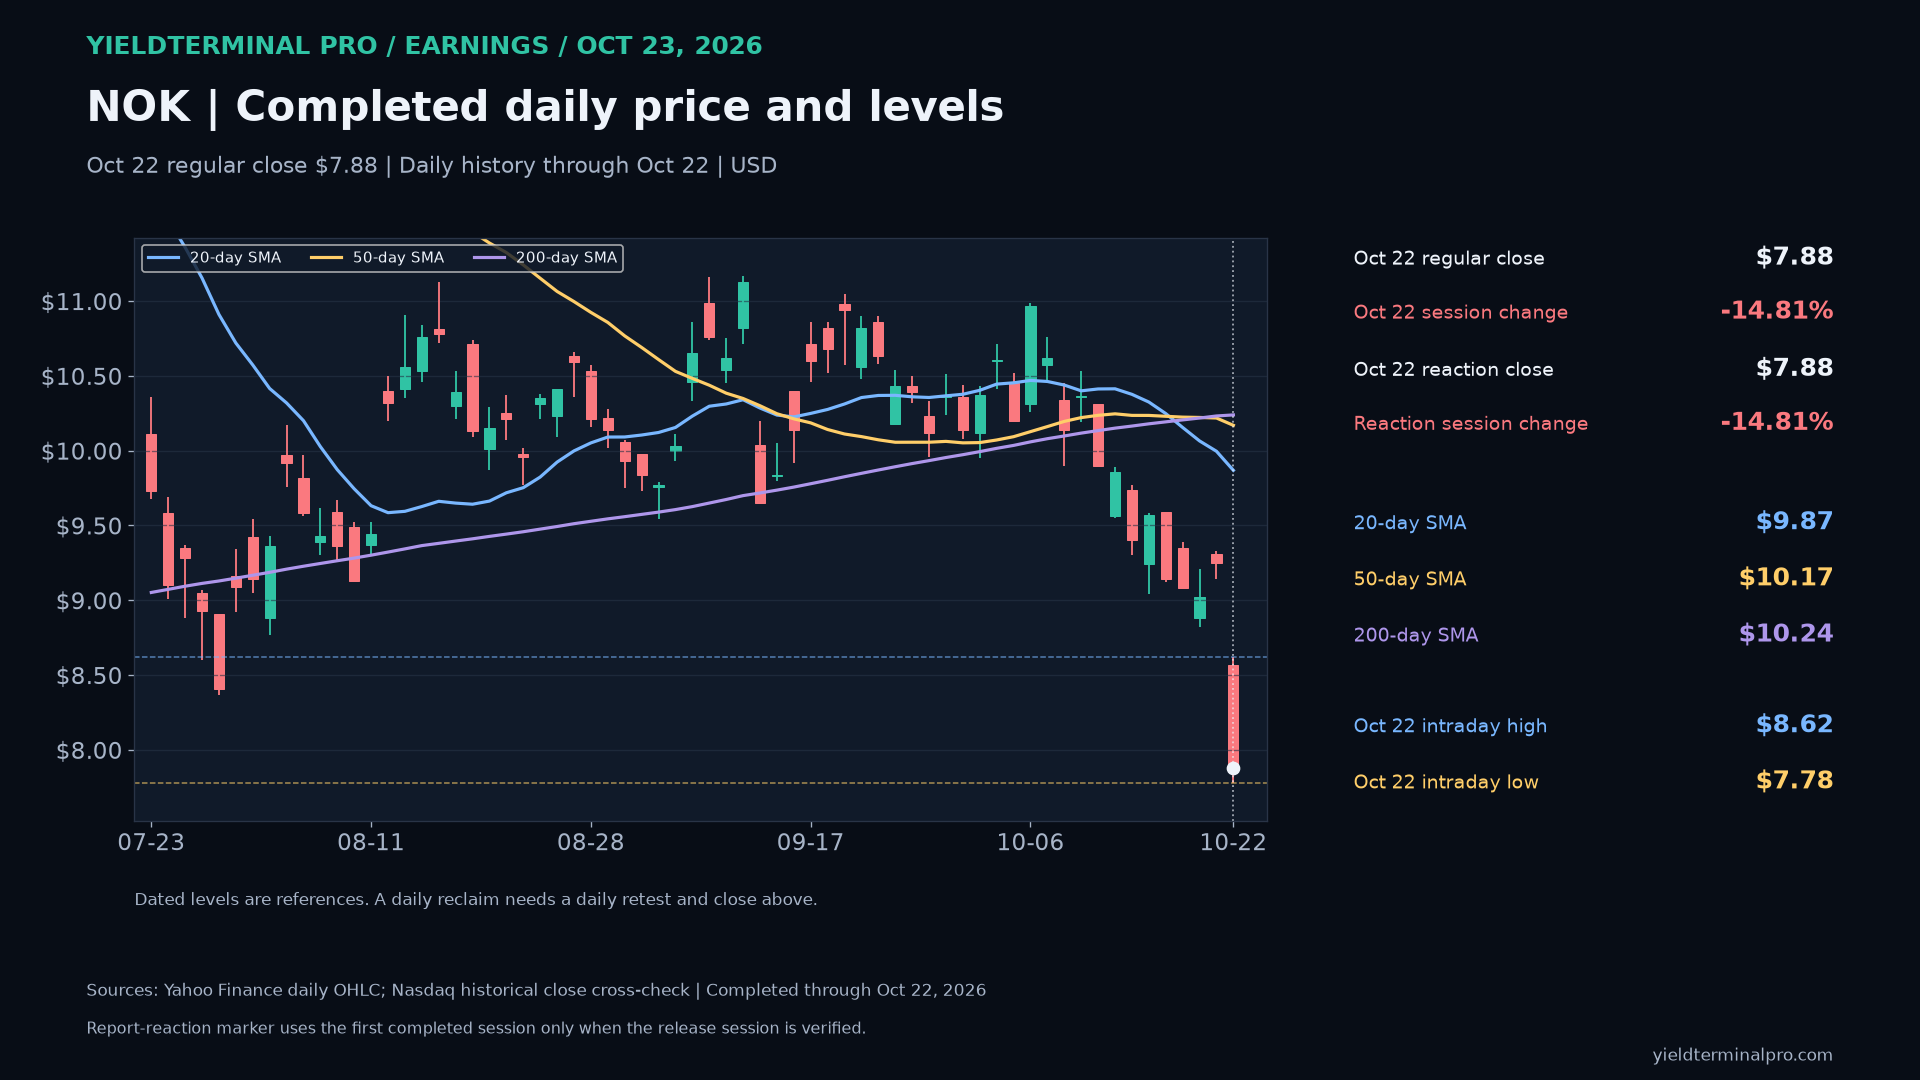
$BXBlackstone — October 23 earnings review 118.75October 22 completed regular-session closeBX closed October 22 at $118.75, below its 50-day average ($125.66) and below its 200-day average ($125.28). The October 22 high ($118.93) and low ($105.50) are dated reference levels. This is completed daily history, not an October 23 quote.
- October 22 intraday high
- 118.93
- October 22 intraday low
- 105.50
- 50-day SMA through October 22
- 125.66
- 200-day SMA through October 22
- 125.28
Levels measured over Completed US regular-session daily history through October 22, 2026. Daily averages use completed closes; earnings result and price session are separate dated evidence.. A level measured over a different window can be a different number.
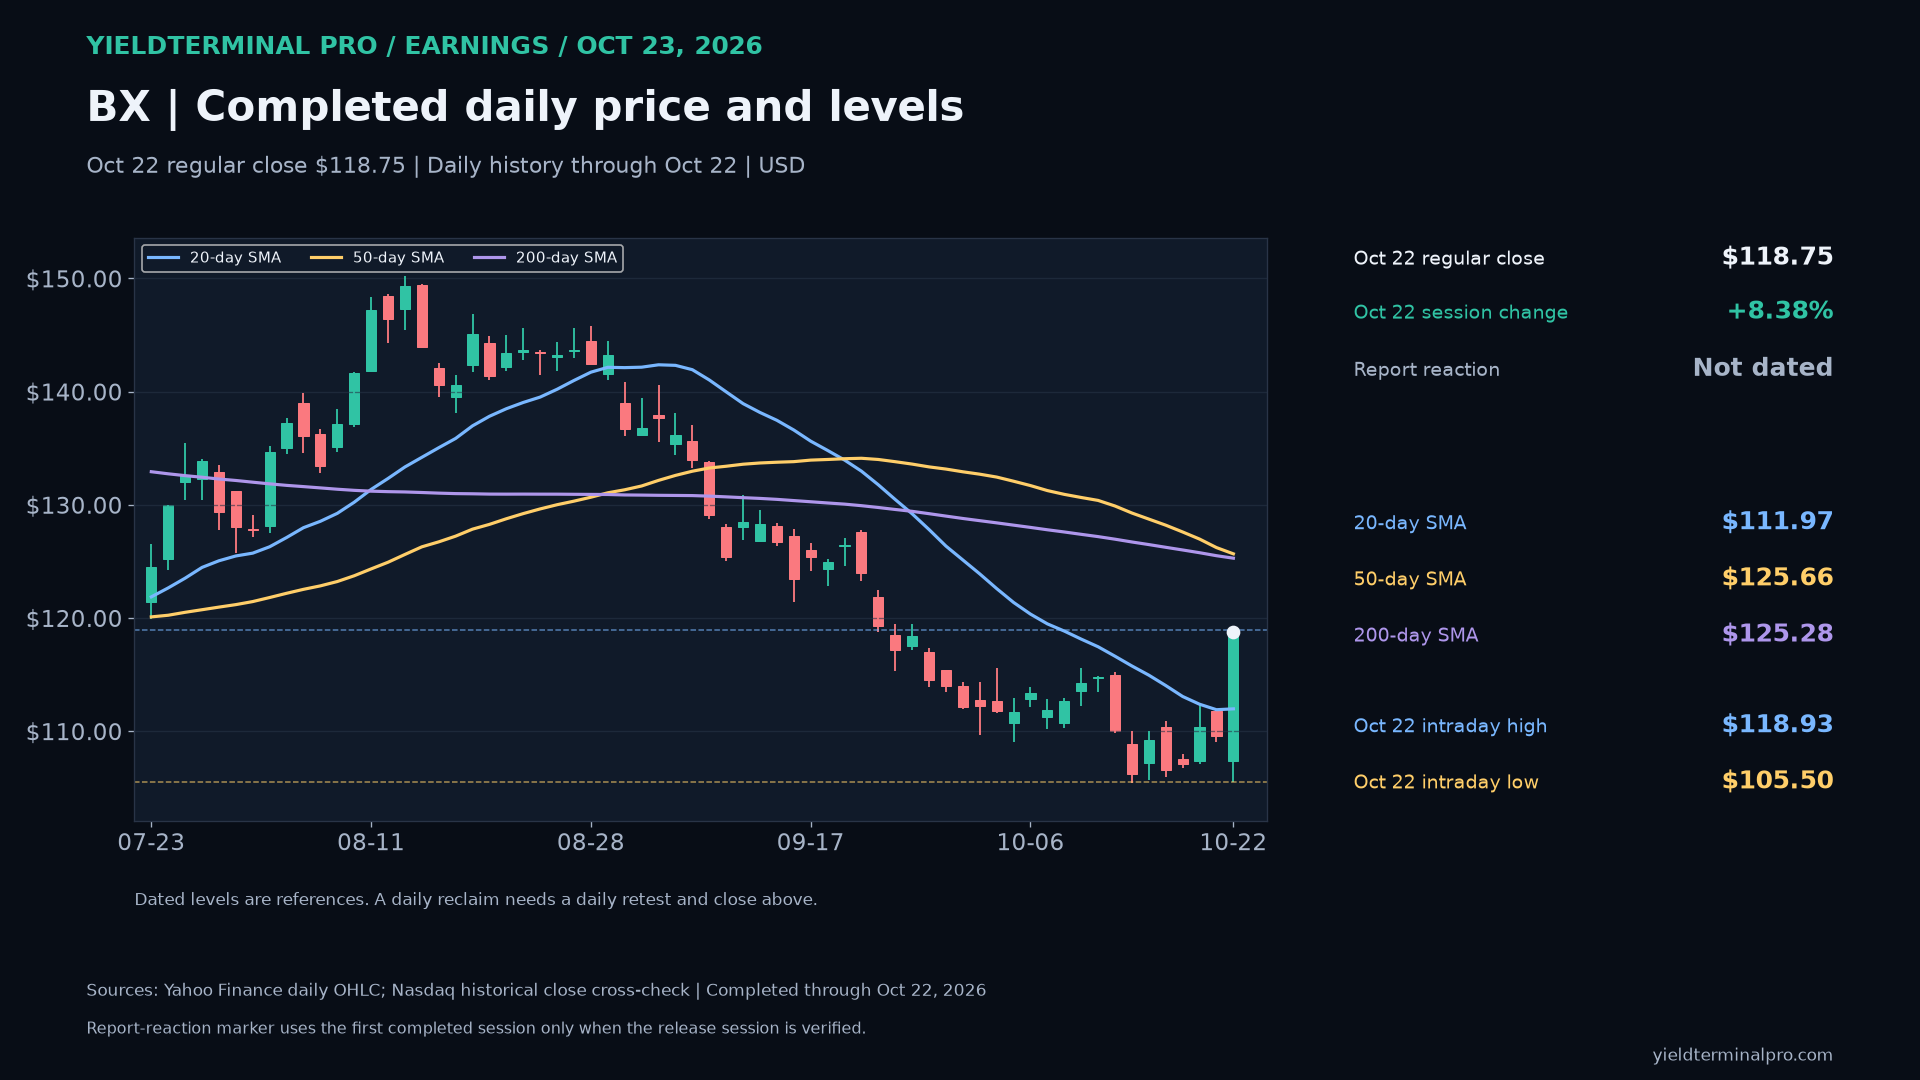
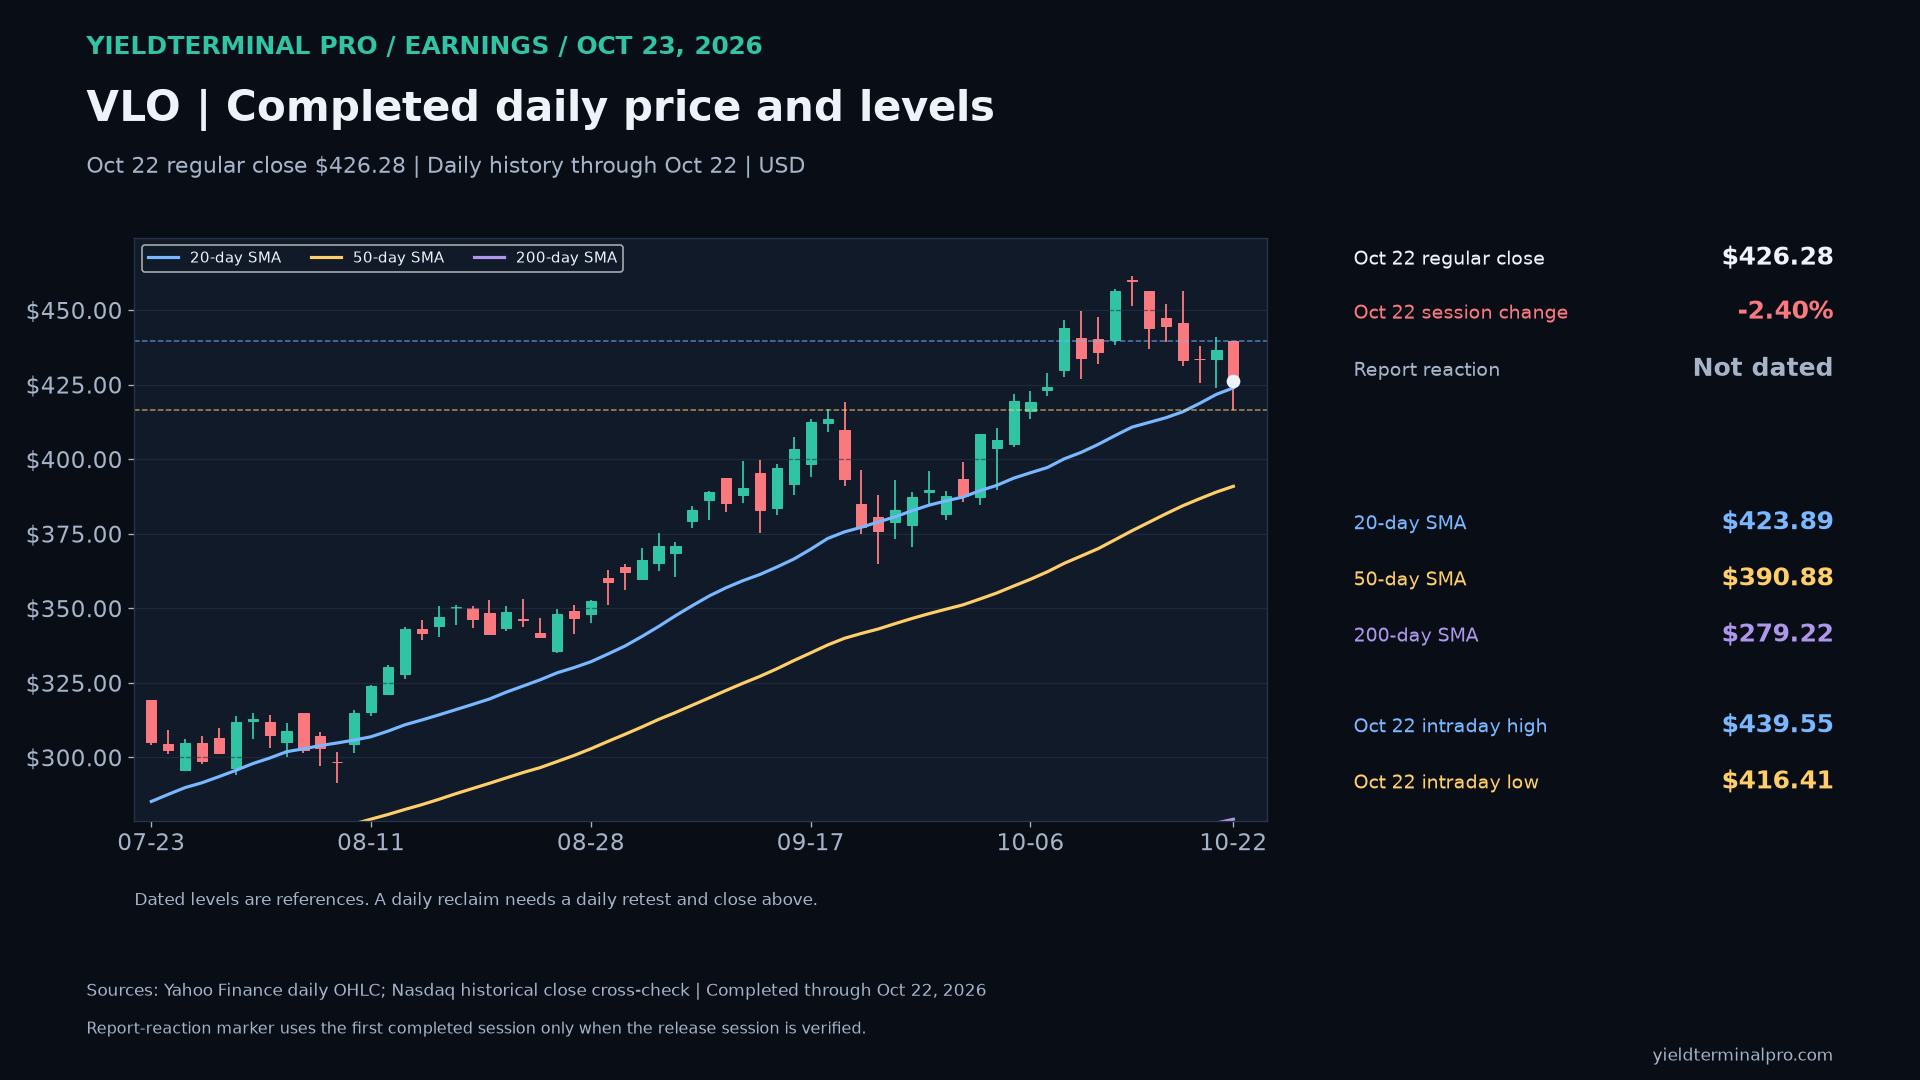
$VLOValero Energy — October 23 earnings review 426.28October 22 completed regular-session closeVLO closed October 22 at $426.28, above its 50-day average ($390.88) and above its 200-day average ($279.22). The October 22 high ($439.55) and low ($416.41) are dated reference levels. This is completed daily history, not an October 23 quote.
- October 22 intraday high
- 439.55
- October 22 intraday low
- 416.41
- 50-day SMA through October 22
- 390.88
- 200-day SMA through October 22
- 279.22
Levels measured over Completed US regular-session daily history through October 22, 2026. Daily averages use completed closes; earnings result and price session are separate dated evidence.. A level measured over a different window can be a different number.
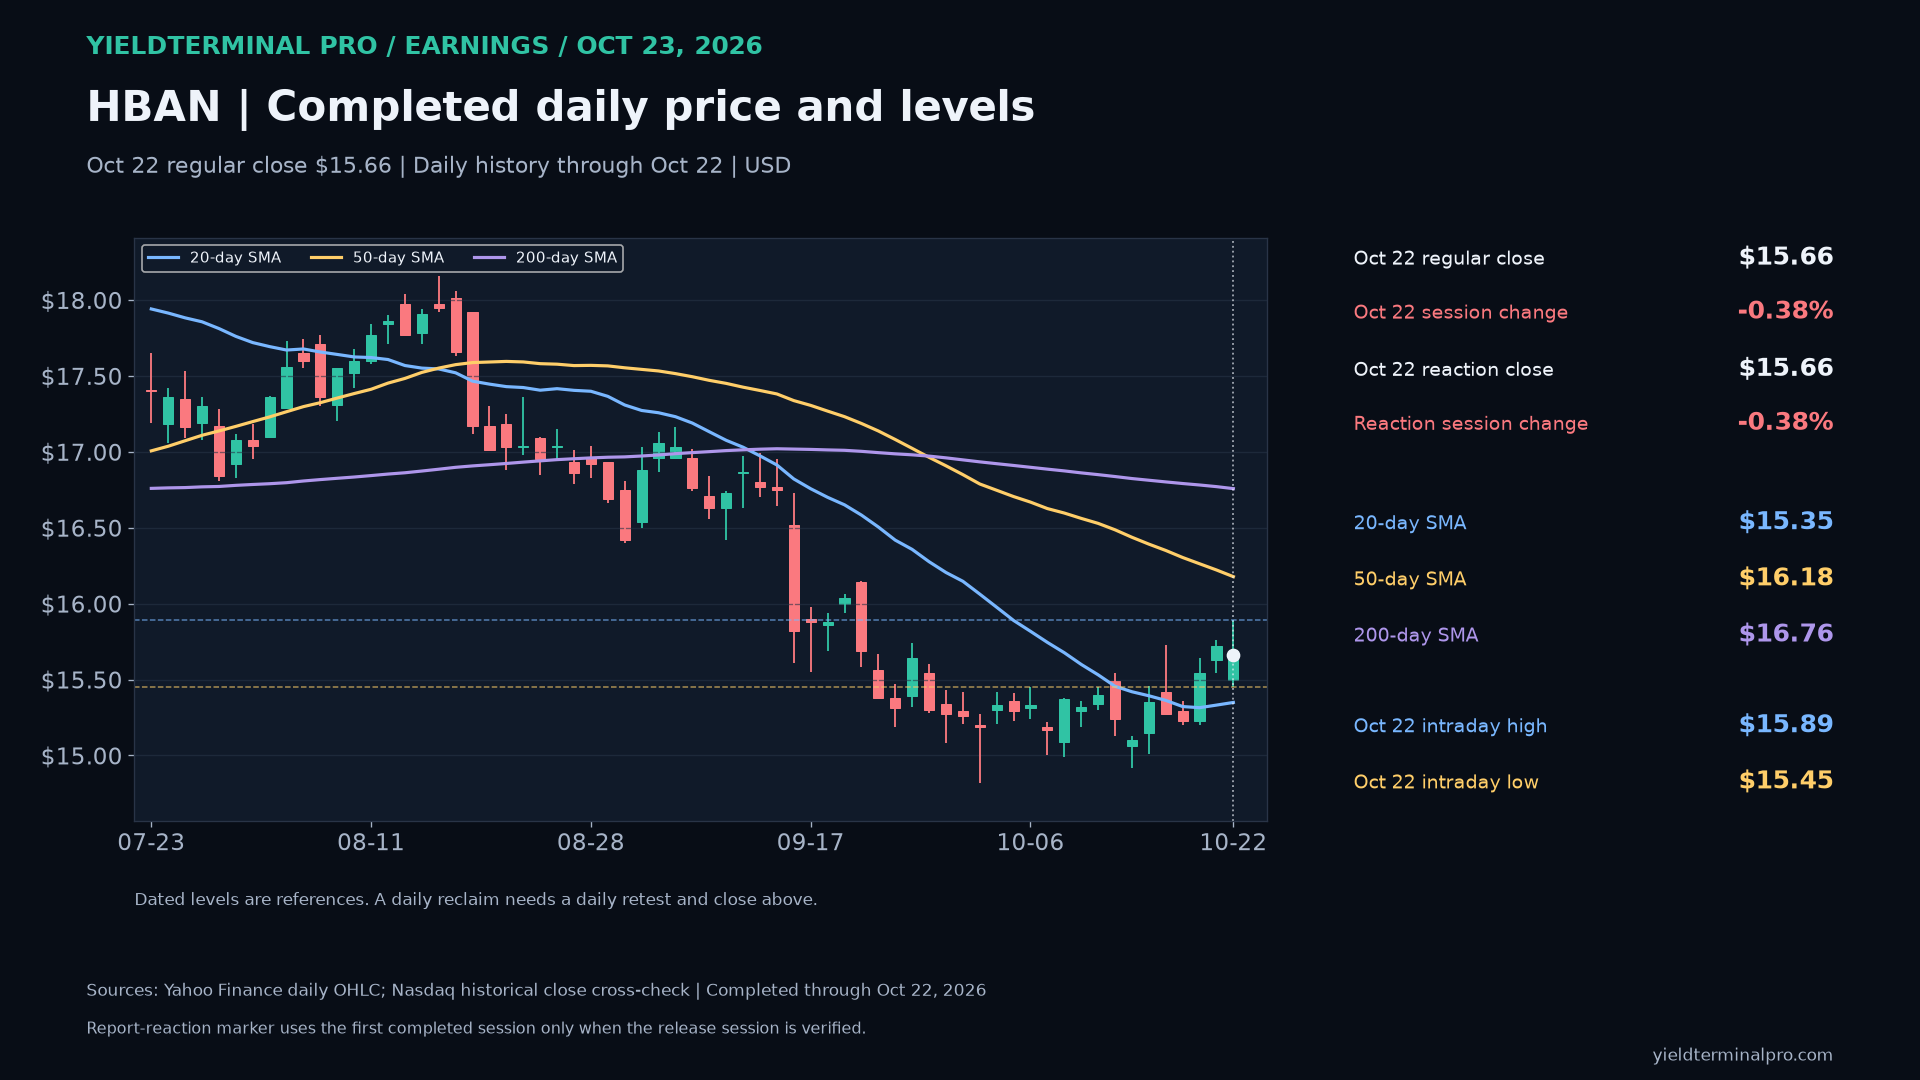
$HBANHuntington Bancshares — October 23 earnings review 15.66October 22 completed regular-session closeHBAN closed October 22 at $15.66, below its 50-day average ($16.18) and below its 200-day average ($16.76). The October 22 high ($15.89) and low ($15.45) are dated reference levels. This is completed daily history, not an October 23 quote.
- October 22 intraday high
- 15.89
- October 22 intraday low
- 15.45
- 50-day SMA through October 22
- 16.18
- 200-day SMA through October 22
- 16.76
Levels measured over Completed US regular-session daily history through October 22, 2026. Daily averages use completed closes; earnings result and price session are separate dated evidence.. A level measured over a different window can be a different number.
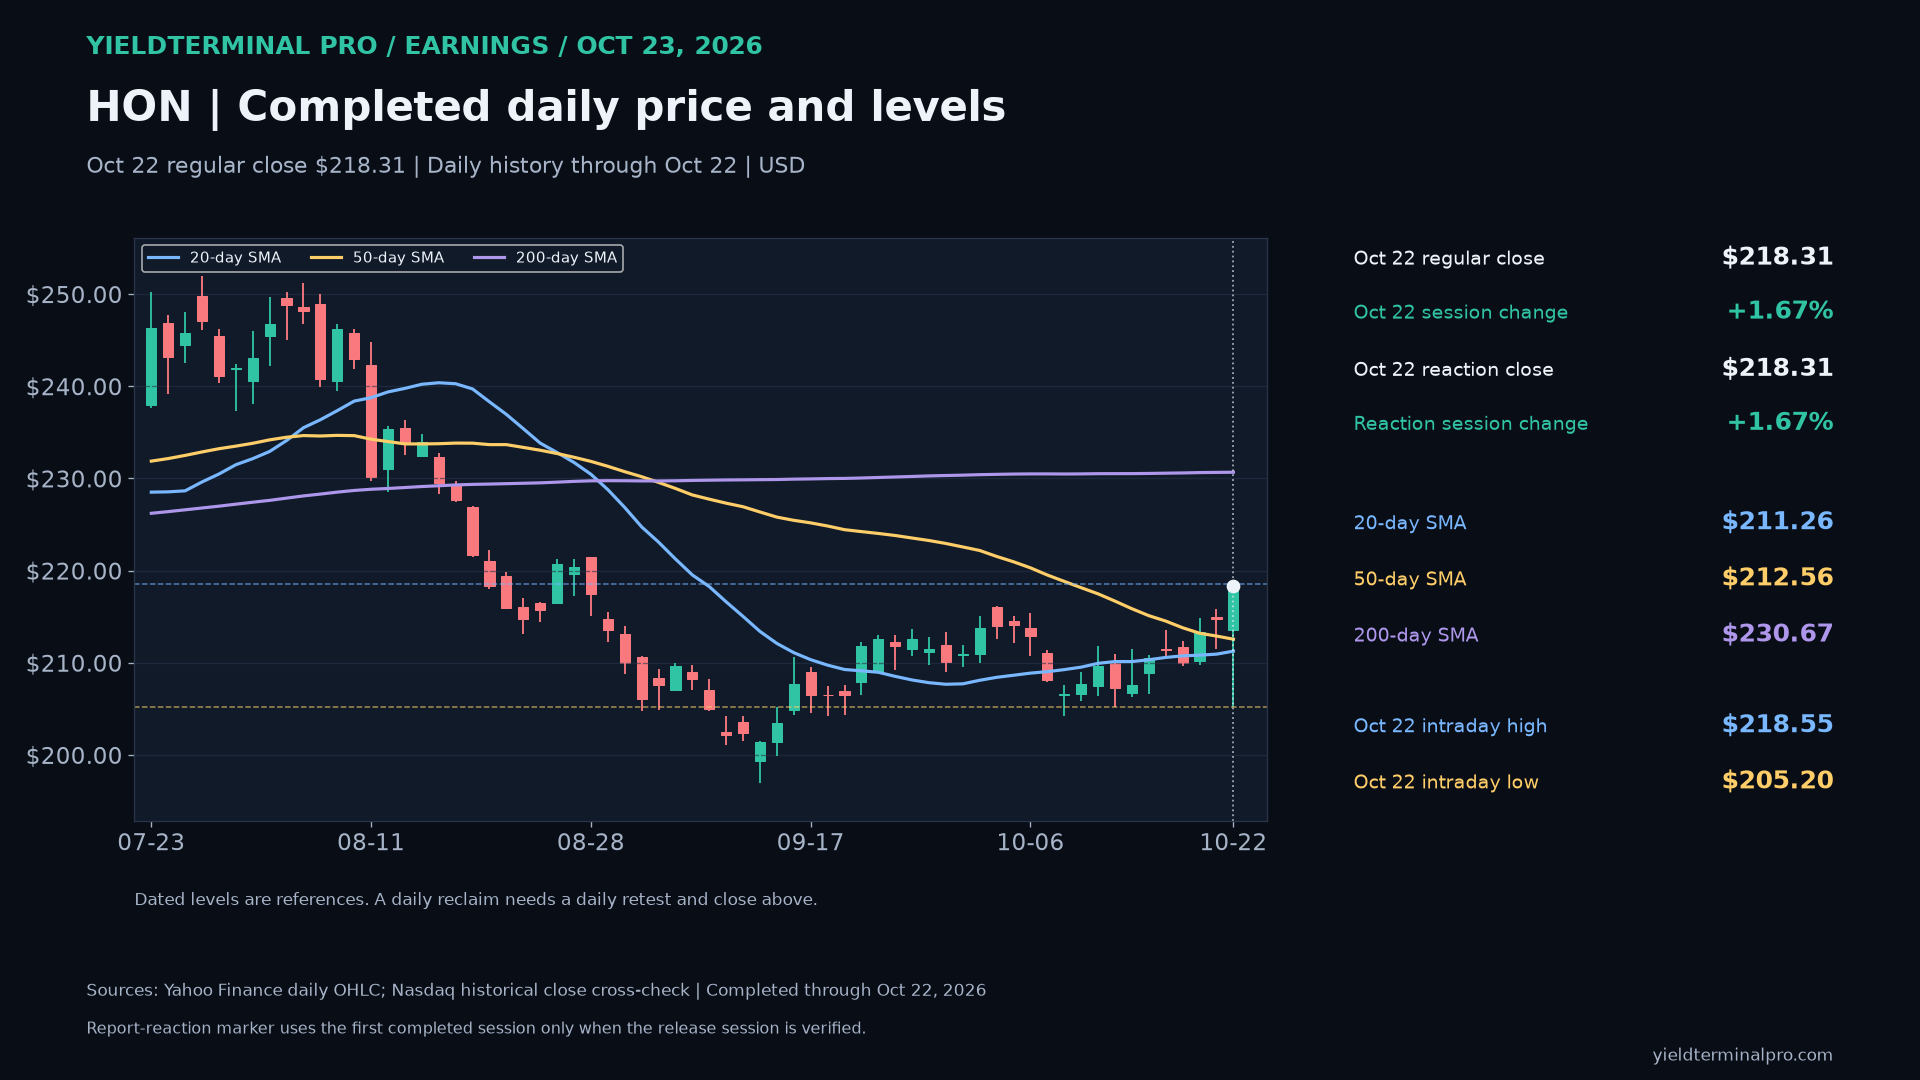
$HONHoneywell Technologies — October 23 earnings review 218.31October 22 completed regular-session closeHON closed October 22 at $218.31, above its 50-day average ($212.56) and below its 200-day average ($230.67). The October 22 high ($218.55) and low ($205.20) are dated reference levels. This is completed daily history, not an October 23 quote.
- October 22 intraday high
- 218.55
- October 22 intraday low
- 205.20
- 50-day SMA through October 22
- 212.56
- 200-day SMA through October 22
- 230.67
Levels measured over Completed US regular-session daily history through October 22, 2026. Daily averages use completed closes; earnings result and price session are separate dated evidence.. A level measured over a different window can be a different number.
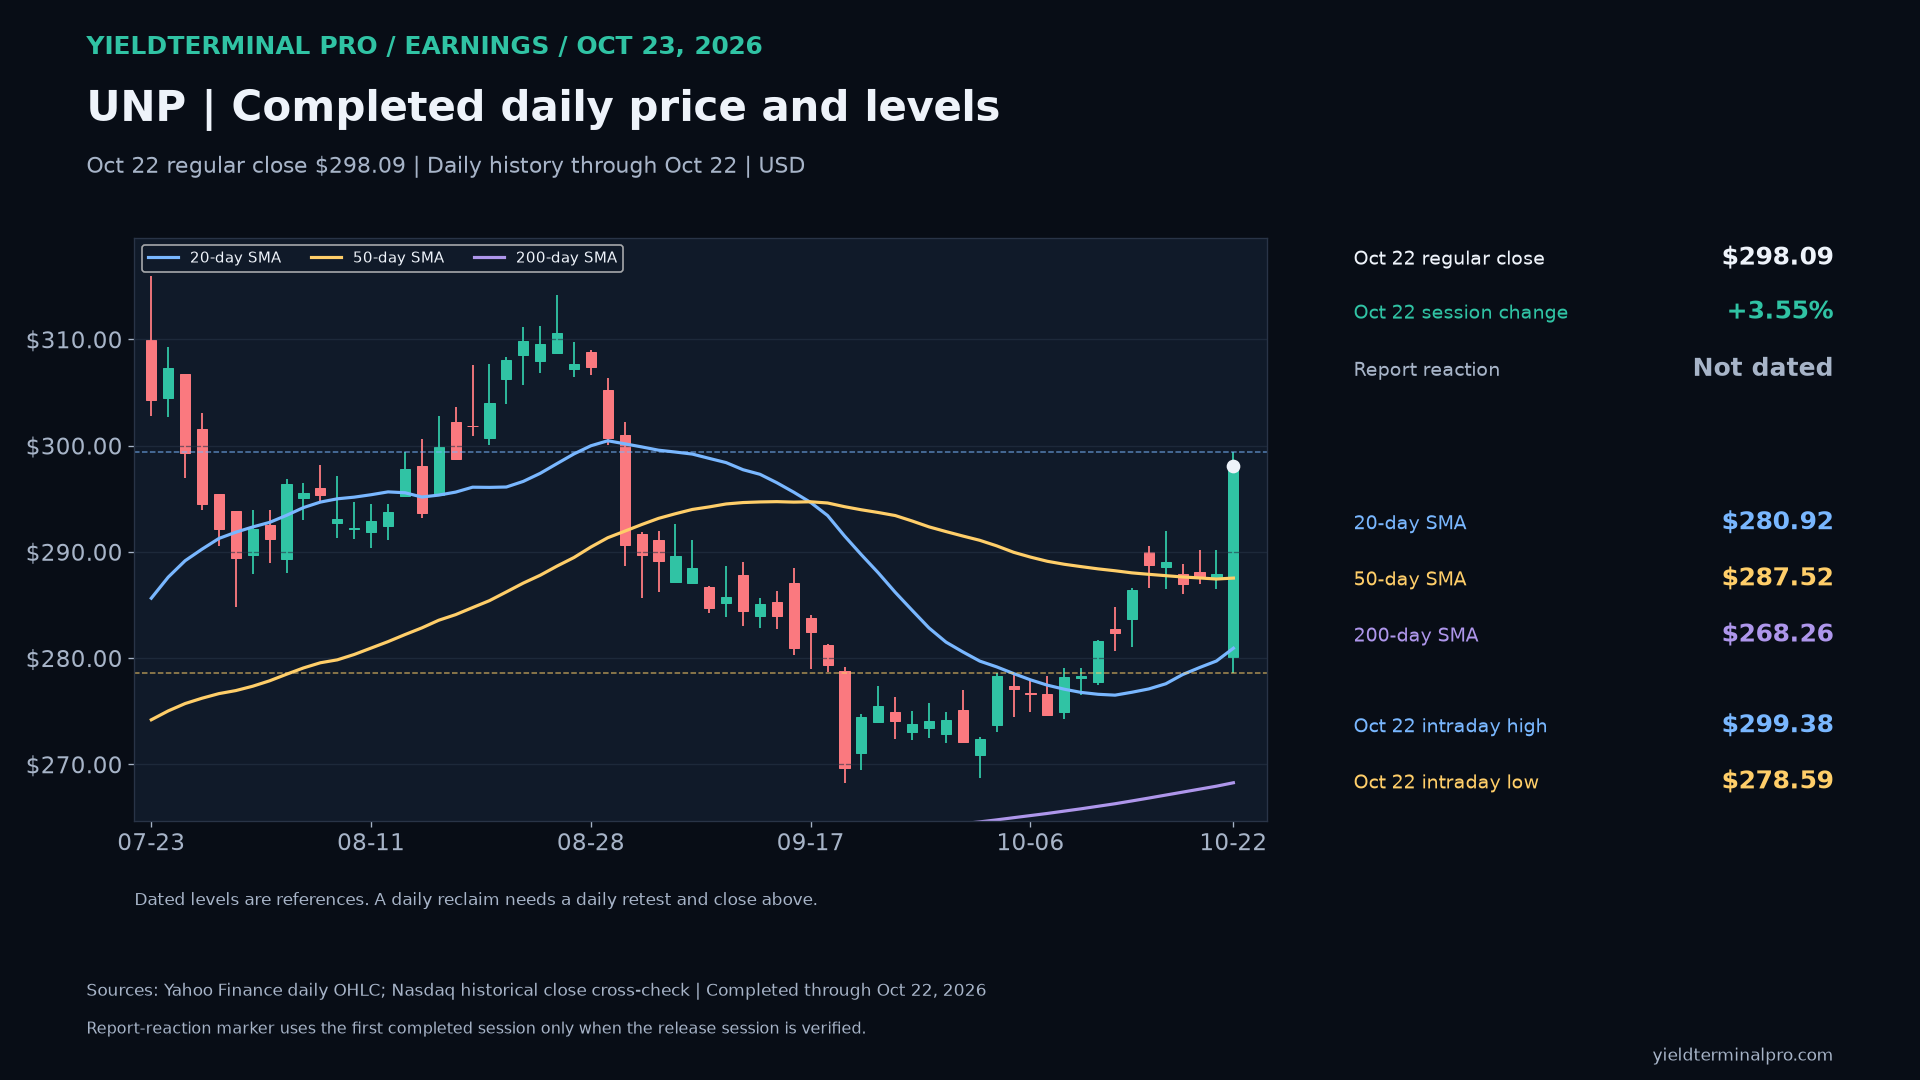
$UNPUnion Pacific Corporation — October 23 earnings review 298.09October 22 completed regular-session closeUNP closed October 22 at $298.09, above its 50-day average ($287.52) and above its 200-day average ($268.26). The Oct 22 high ($299.38) and low ($278.59) are dated reference levels. This is completed daily history.
- October 22 intraday high
- 299.38
- October 22 intraday low
- 278.59
- 50-day SMA through October 22
- 287.52
- 200-day SMA through October 22
- 268.26
Levels measured over Completed US regular-session daily history through October 22, 2026. Daily averages use completed closes; earnings result and price session are separate dated evidence.. A level measured over a different window can be a different number.
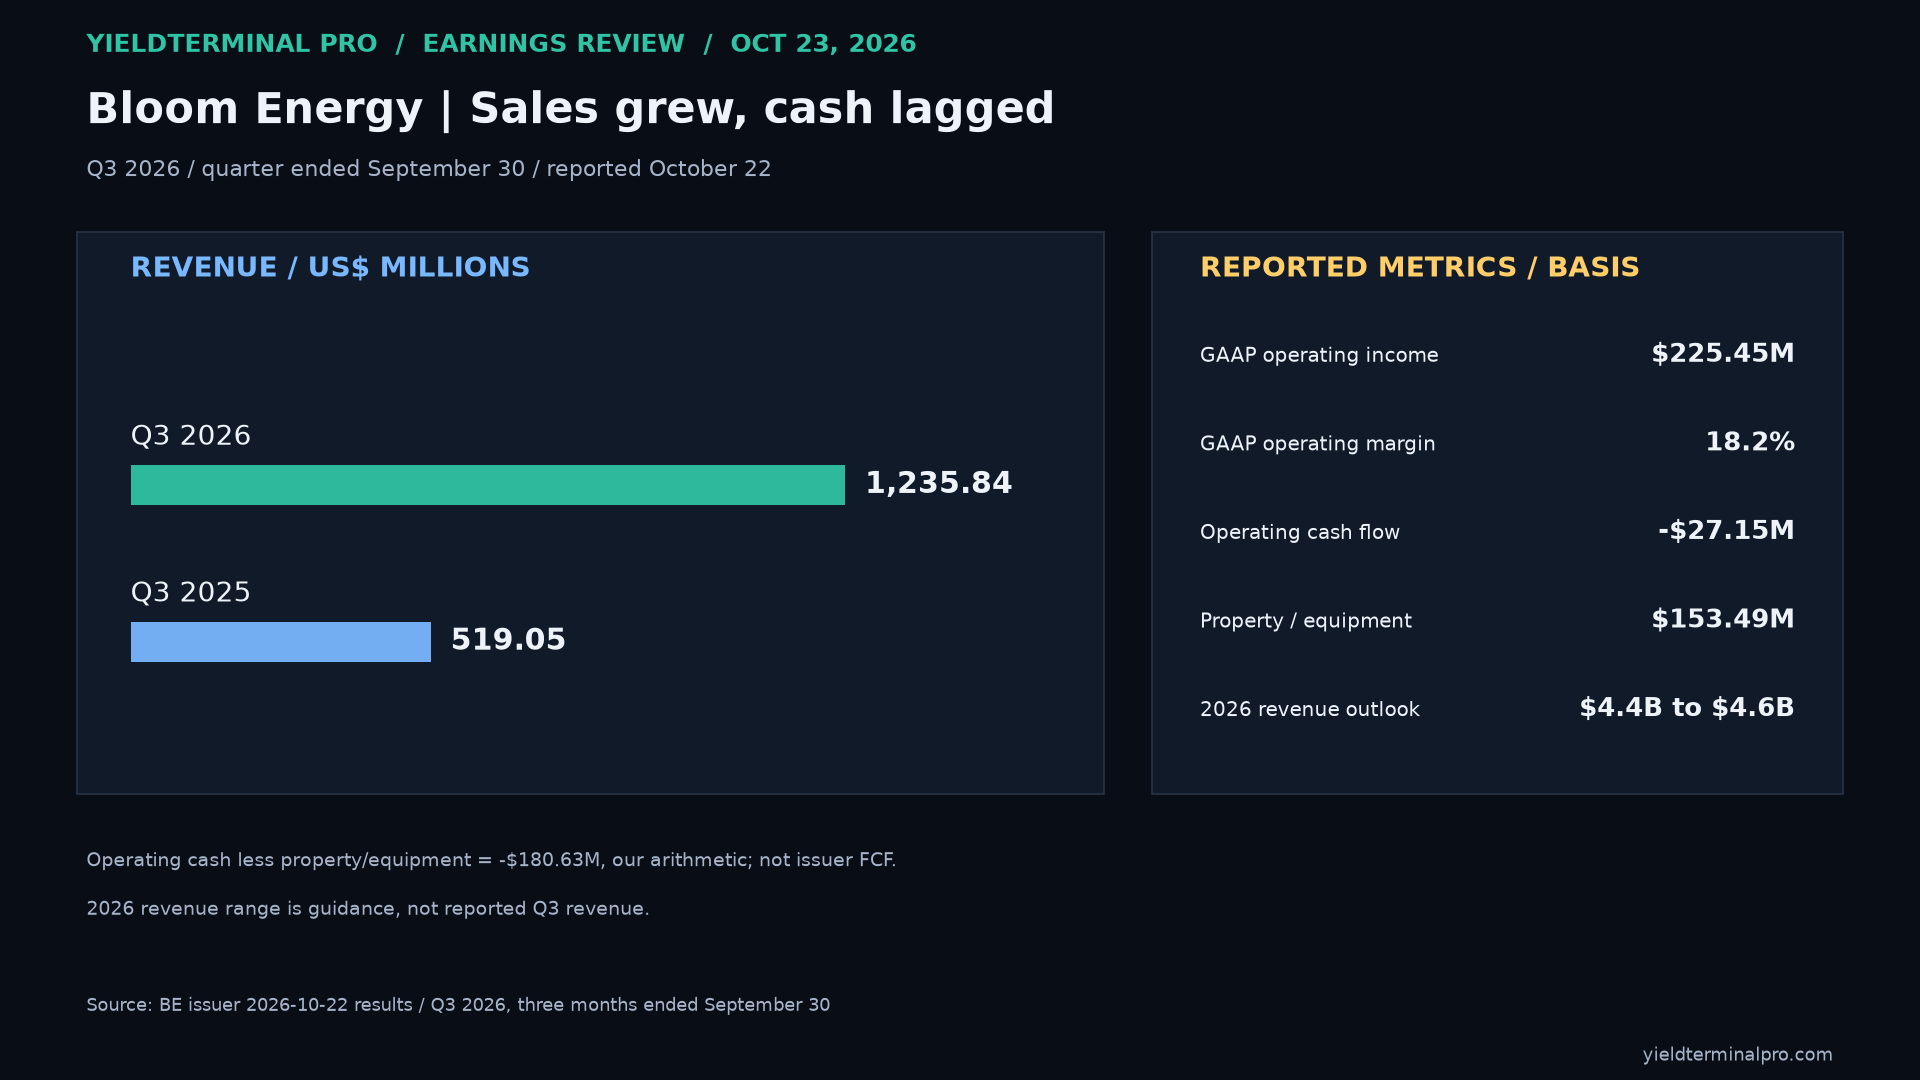
$BEBloom Energy — Q3 2026, three months ended September 30 issuer results Q3 revenue rose to $1.236 billion from $0.519 billion; operating cash flow was negative $27.15 million.
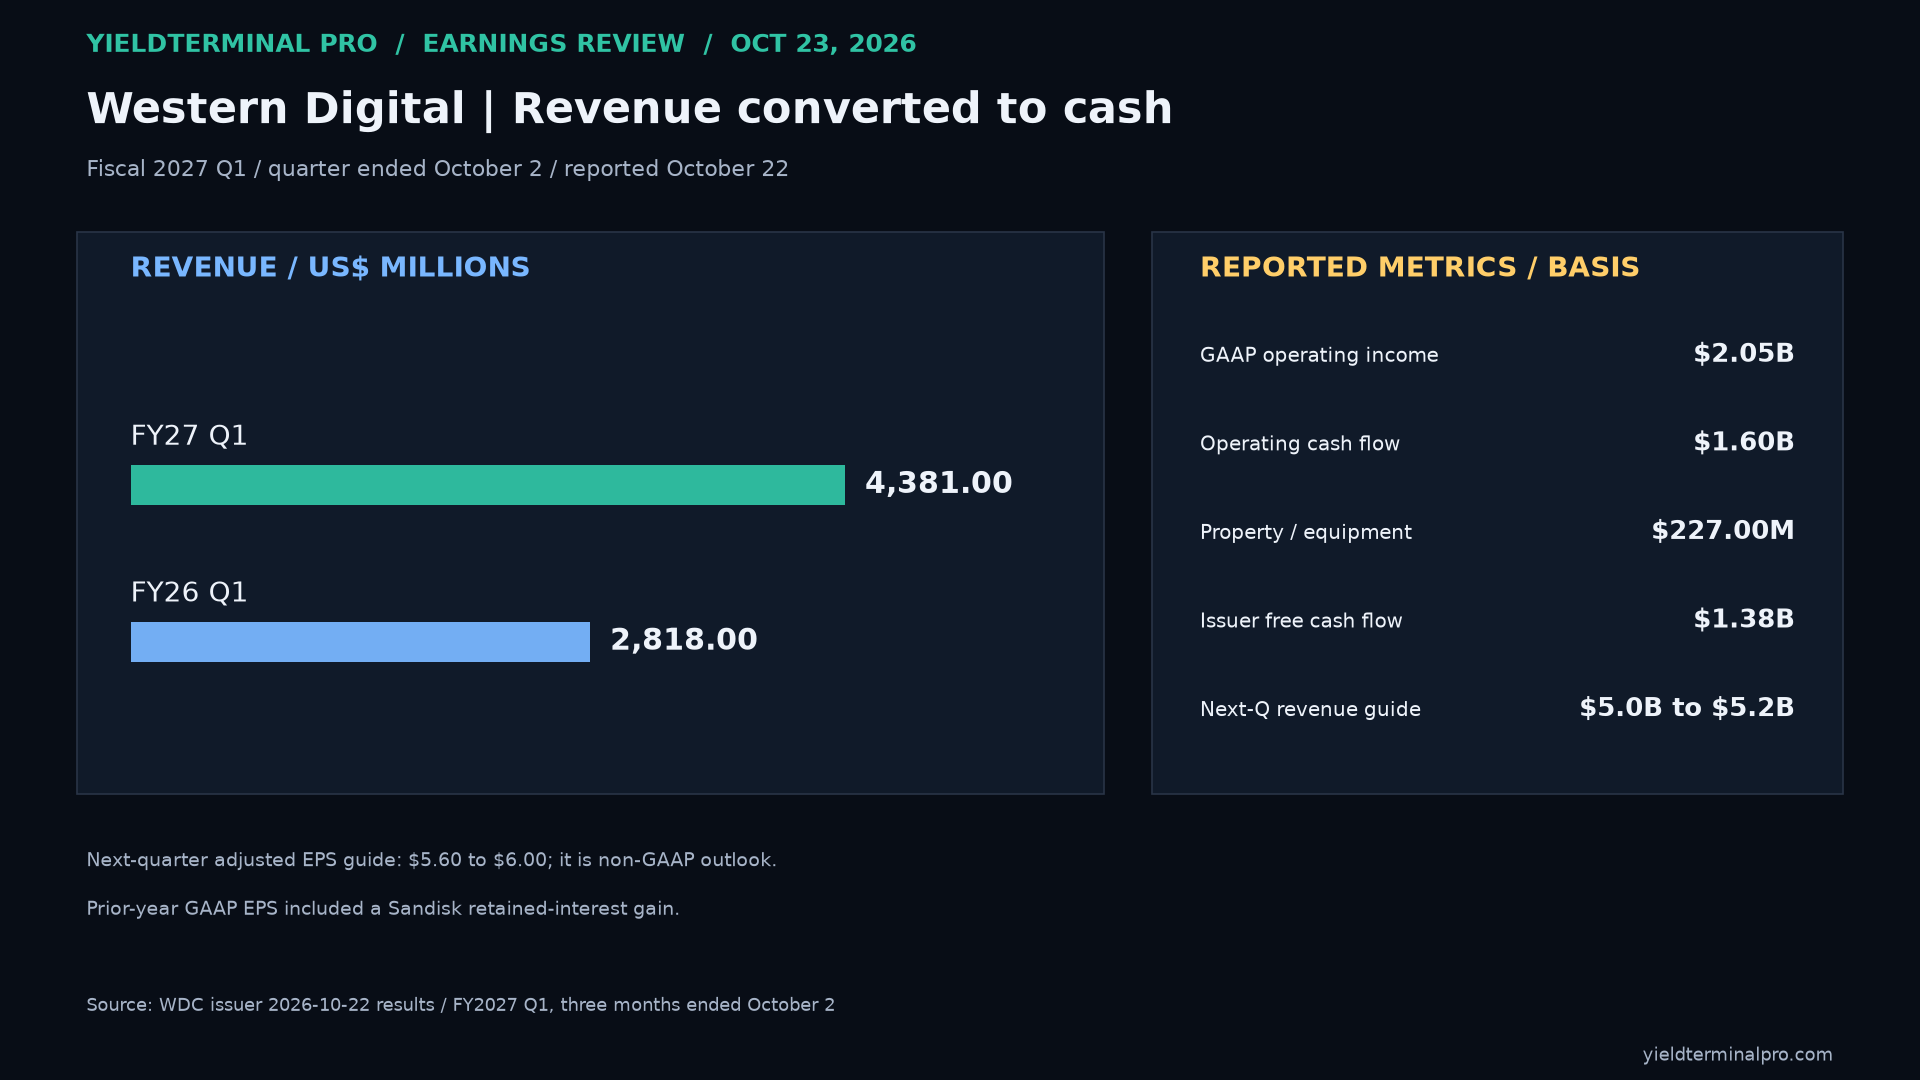
$WDCWestern Digital Corporation — FY2027 Q1, three months ended October 2 issuer results Fiscal 2027 Q1 revenue rose to $4.381 billion from $2.818 billion; issuer-defined free cash flow was $1.377 billion.
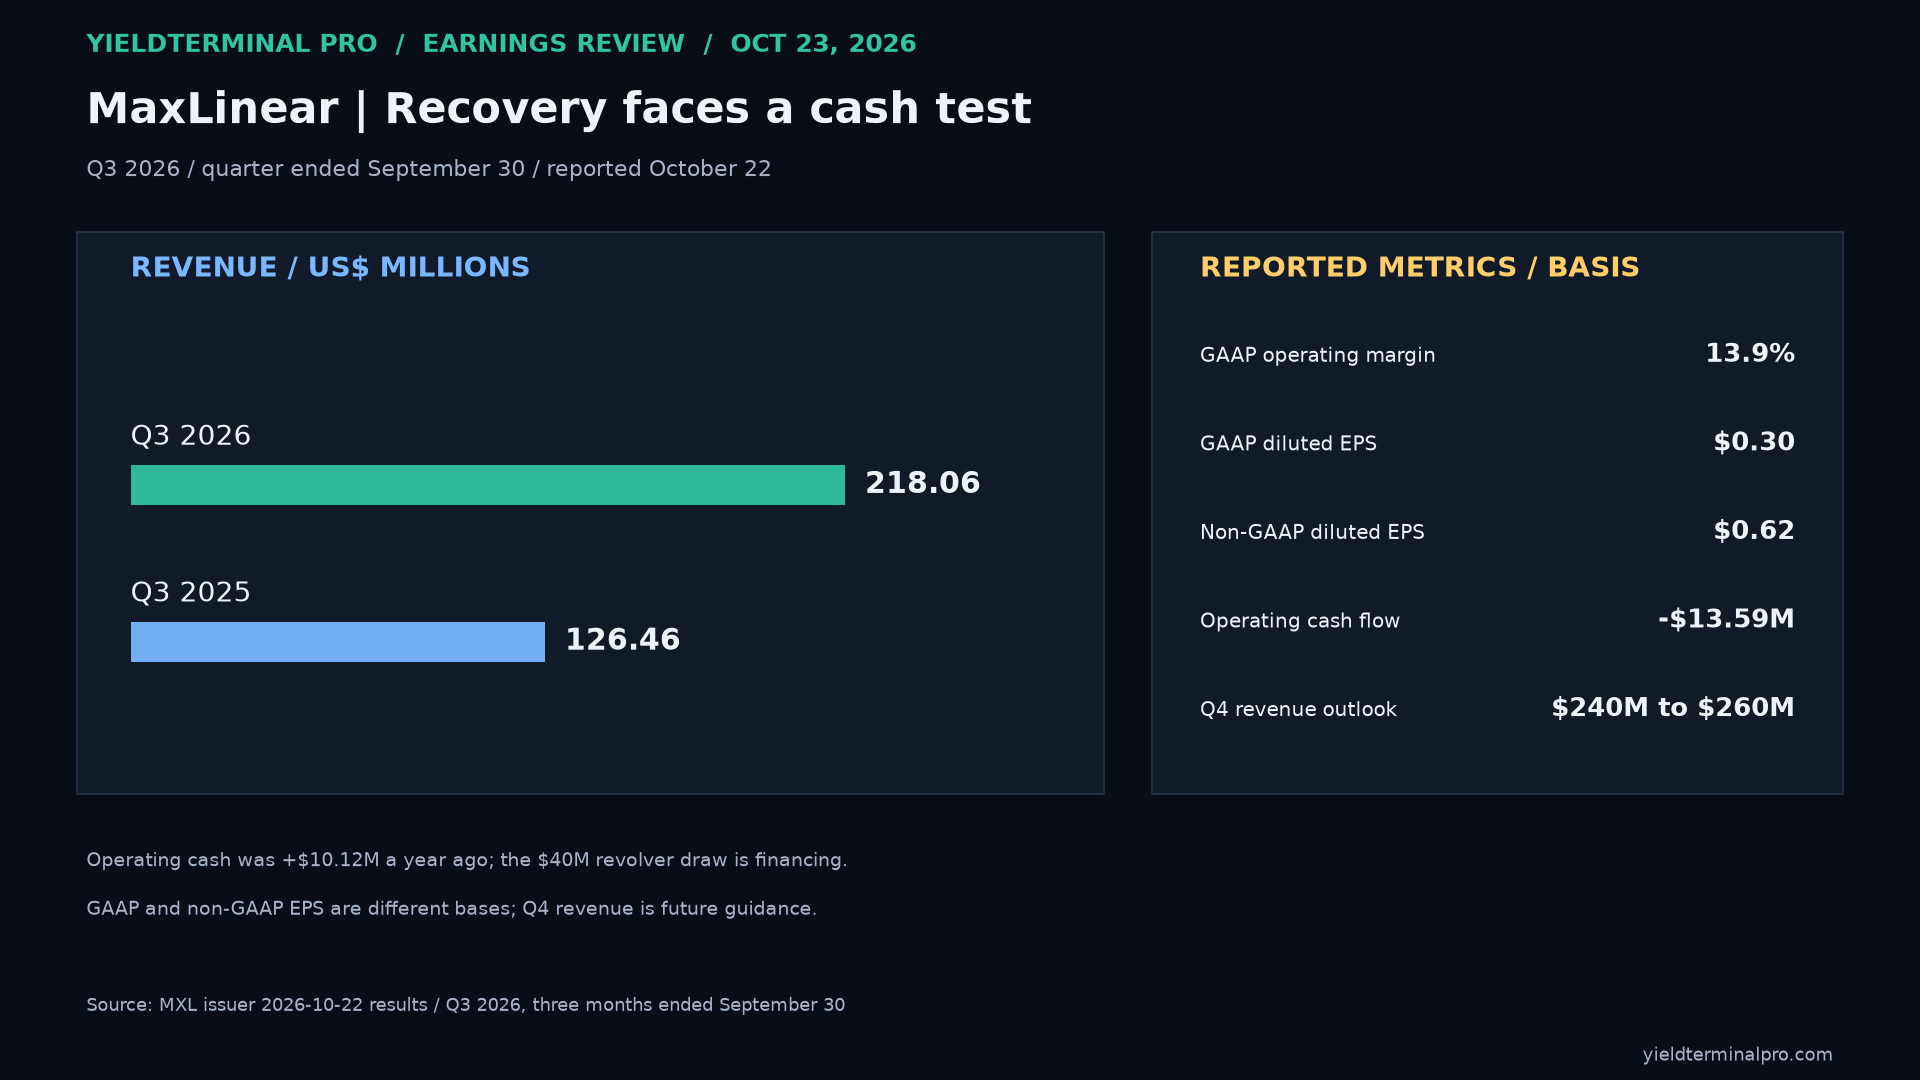
$MXLMaxLinear — Q3 2026, three months ended September 30 issuer results Q3 revenue rose to $218.06 million from $126.46 million, while operating cash flow was negative $13.59 million.
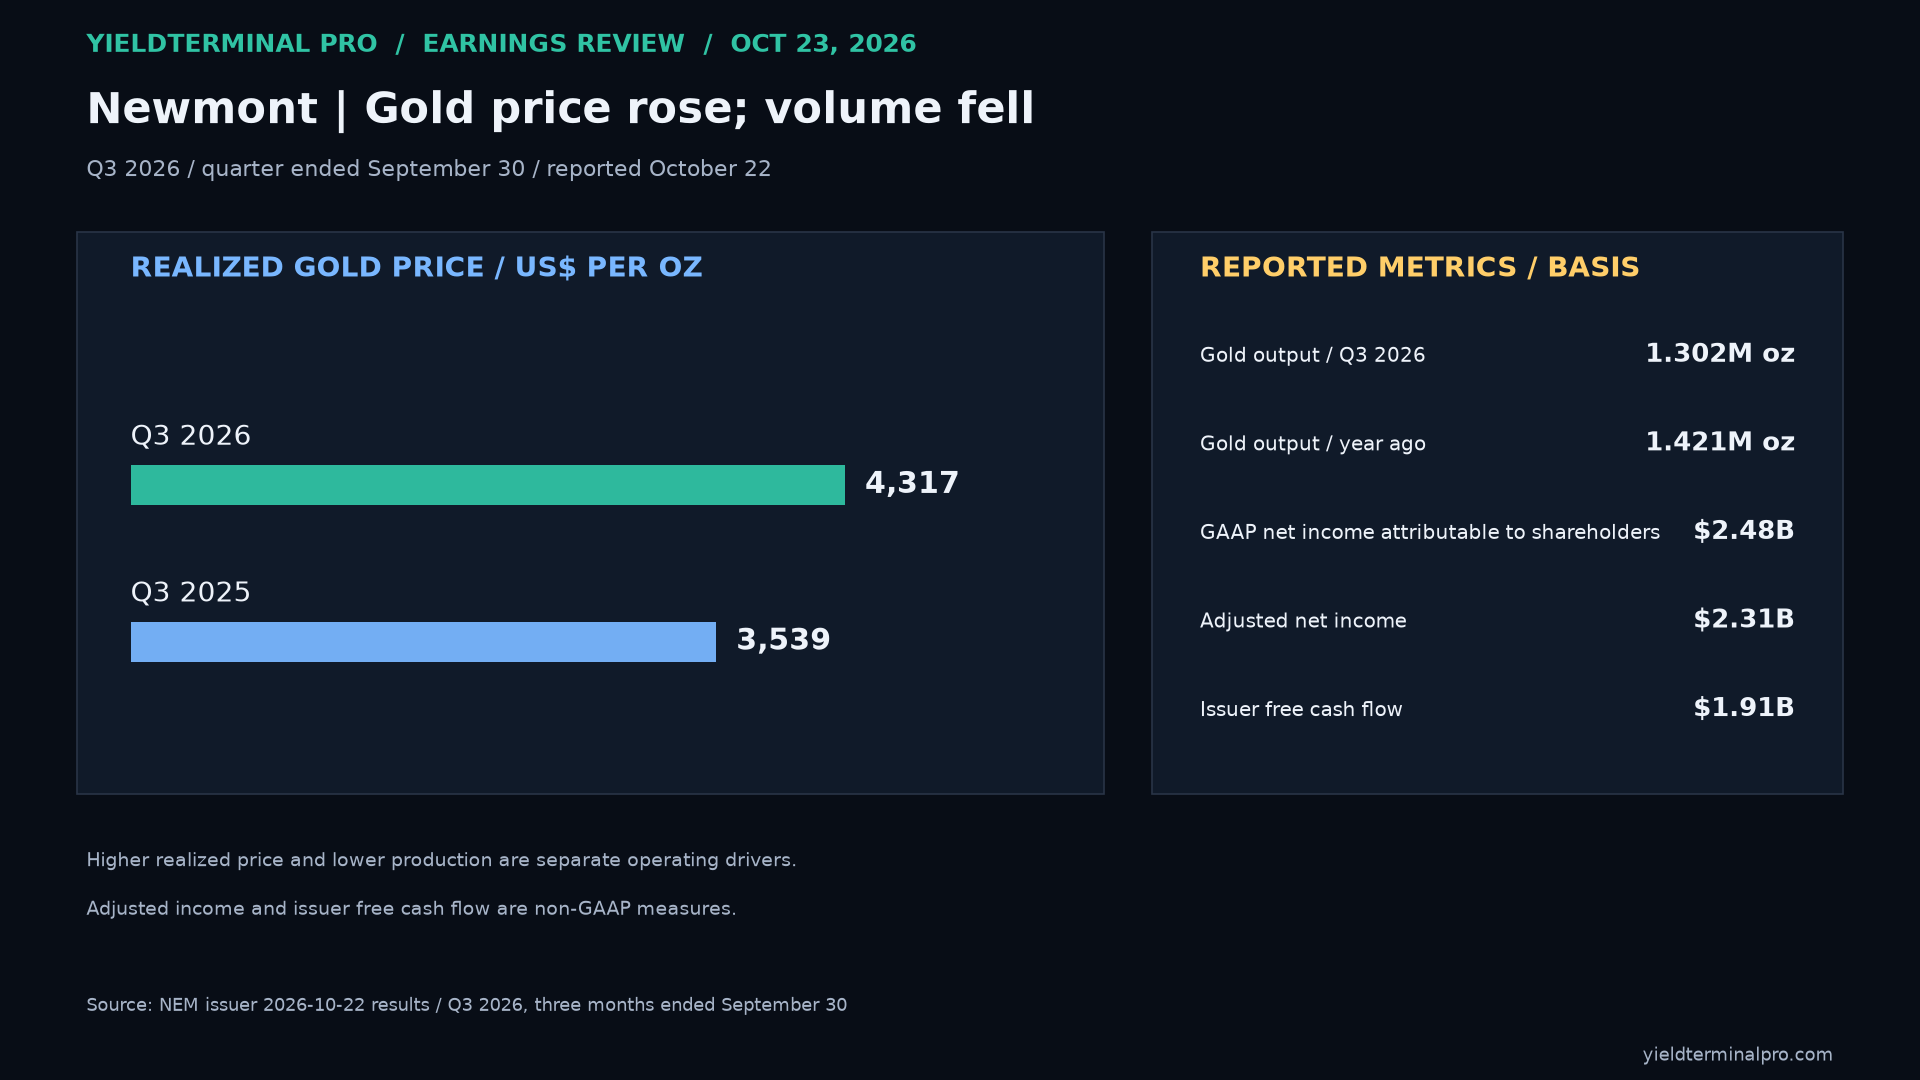
$NEMNewmont Corporation — Q3 2026, three months ended September 30 issuer results Q3 realized gold price rose to $4,317 per ounce from $3,539; production fell to 1.302 million ounces from 1.421 million.
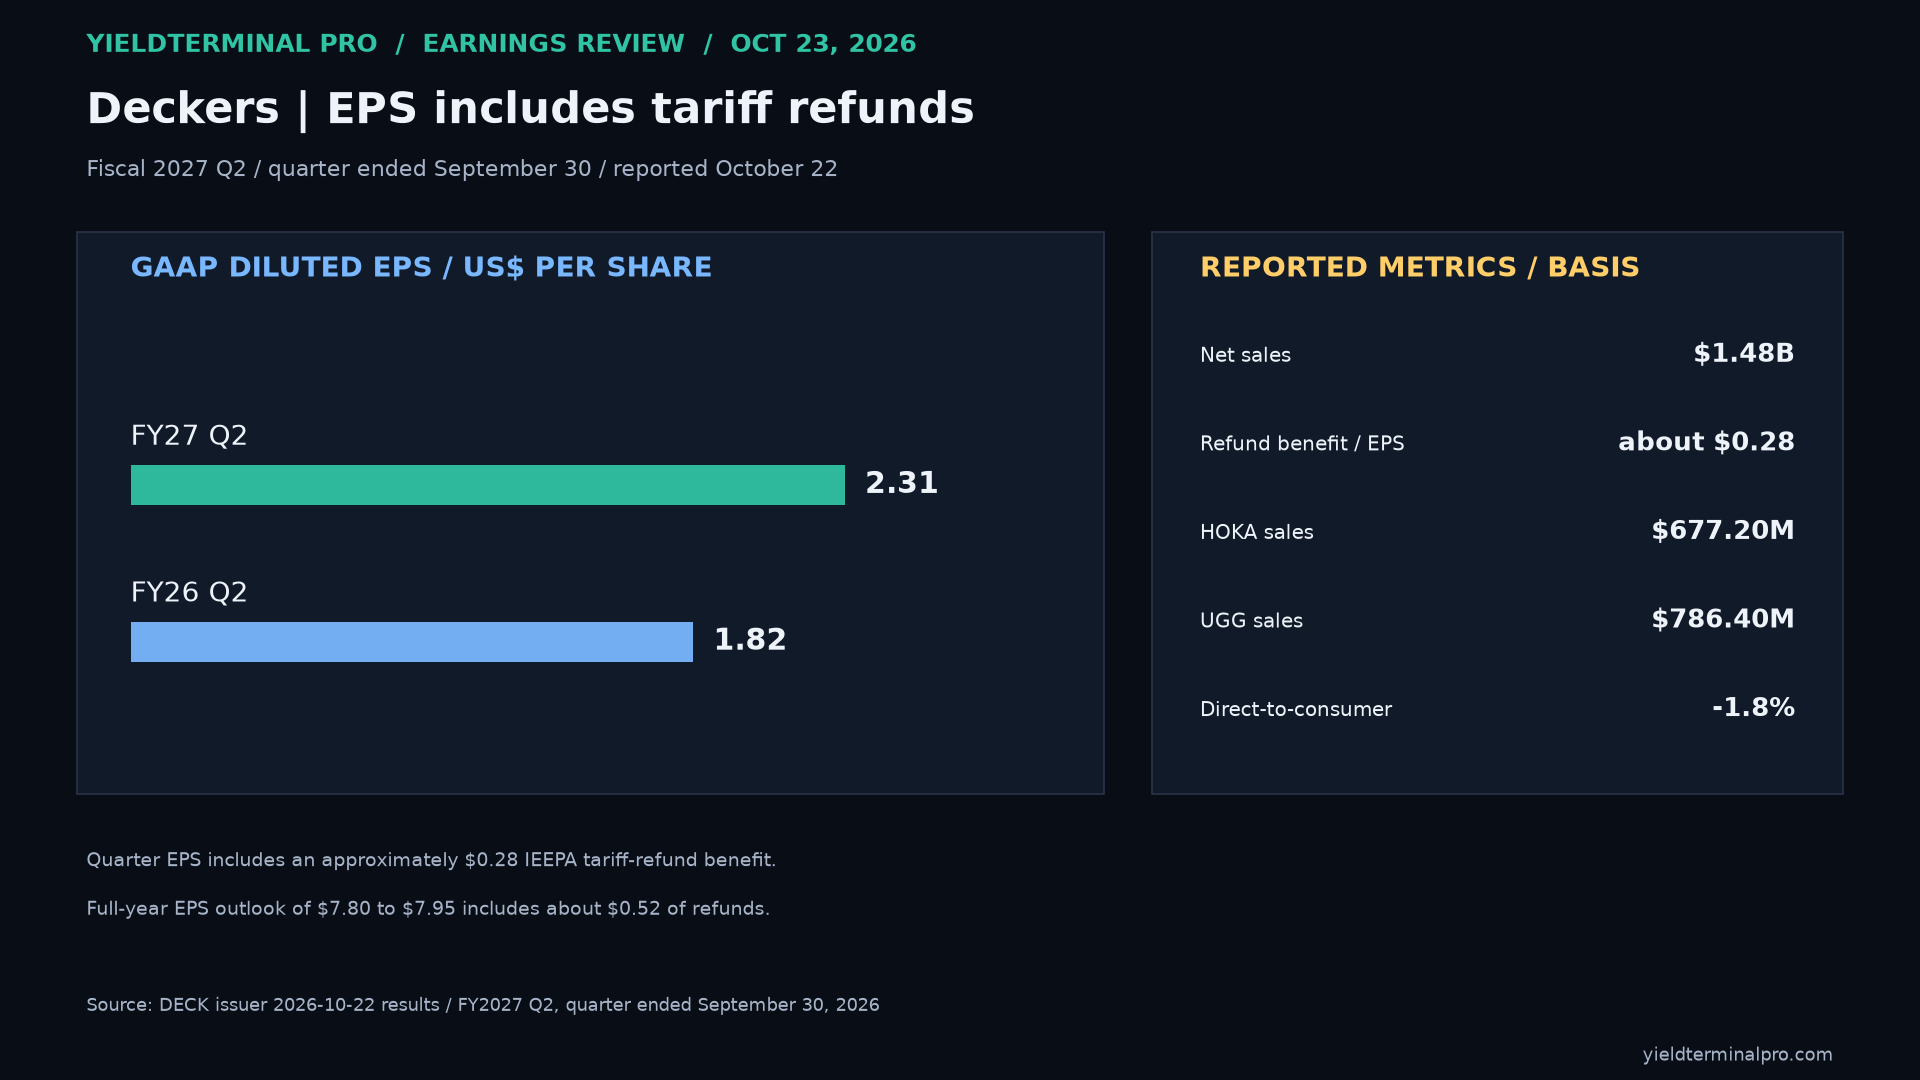
$DECKDeckers Outdoor Corporation — FY2027 Q2, quarter ended September 30, 2026 issuer results Fiscal 2027 Q2 GAAP EPS was $2.31, including about $0.28 from tariff refunds; net sales rose 3.5%.
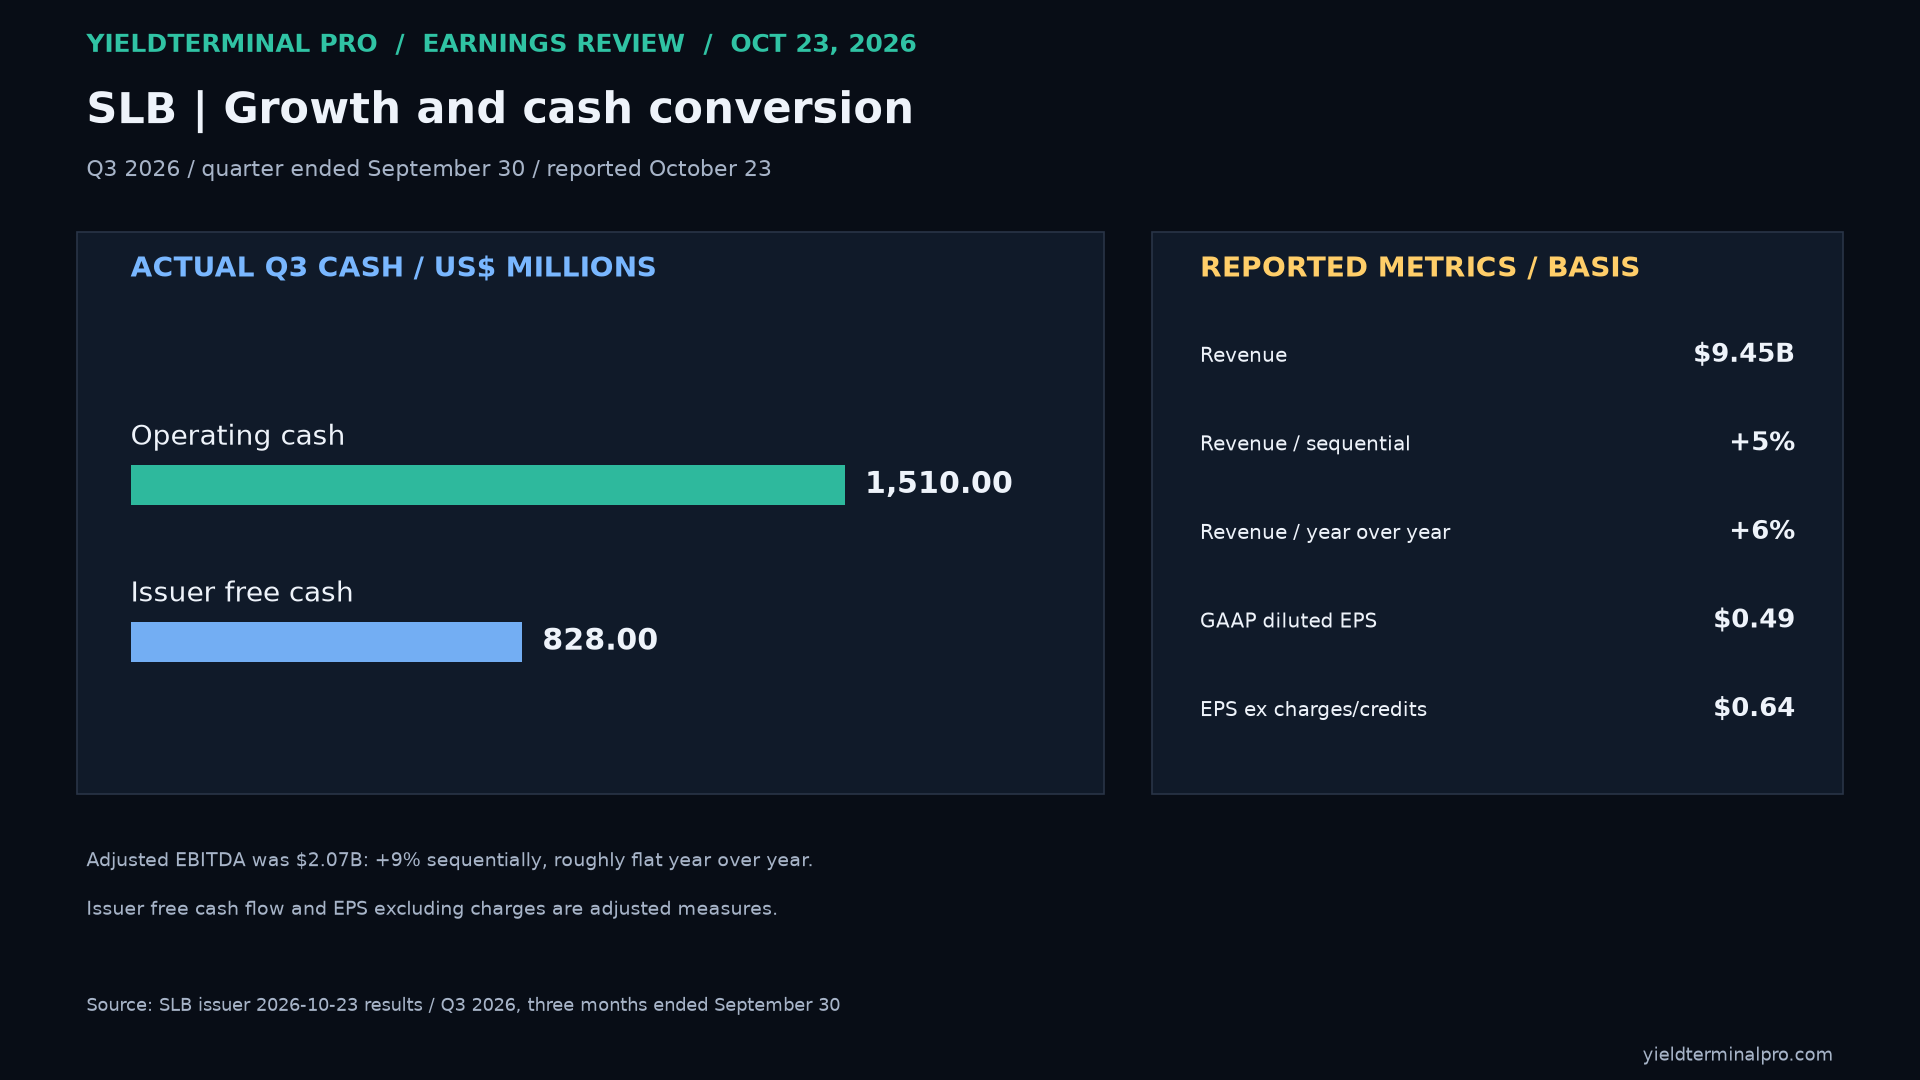
$SLBSLB — Q3 2026, three months ended September 30 issuer results Q3 revenue was $9.45 billion; GAAP EPS was $0.49 and EPS excluding charges and credits was $0.64.
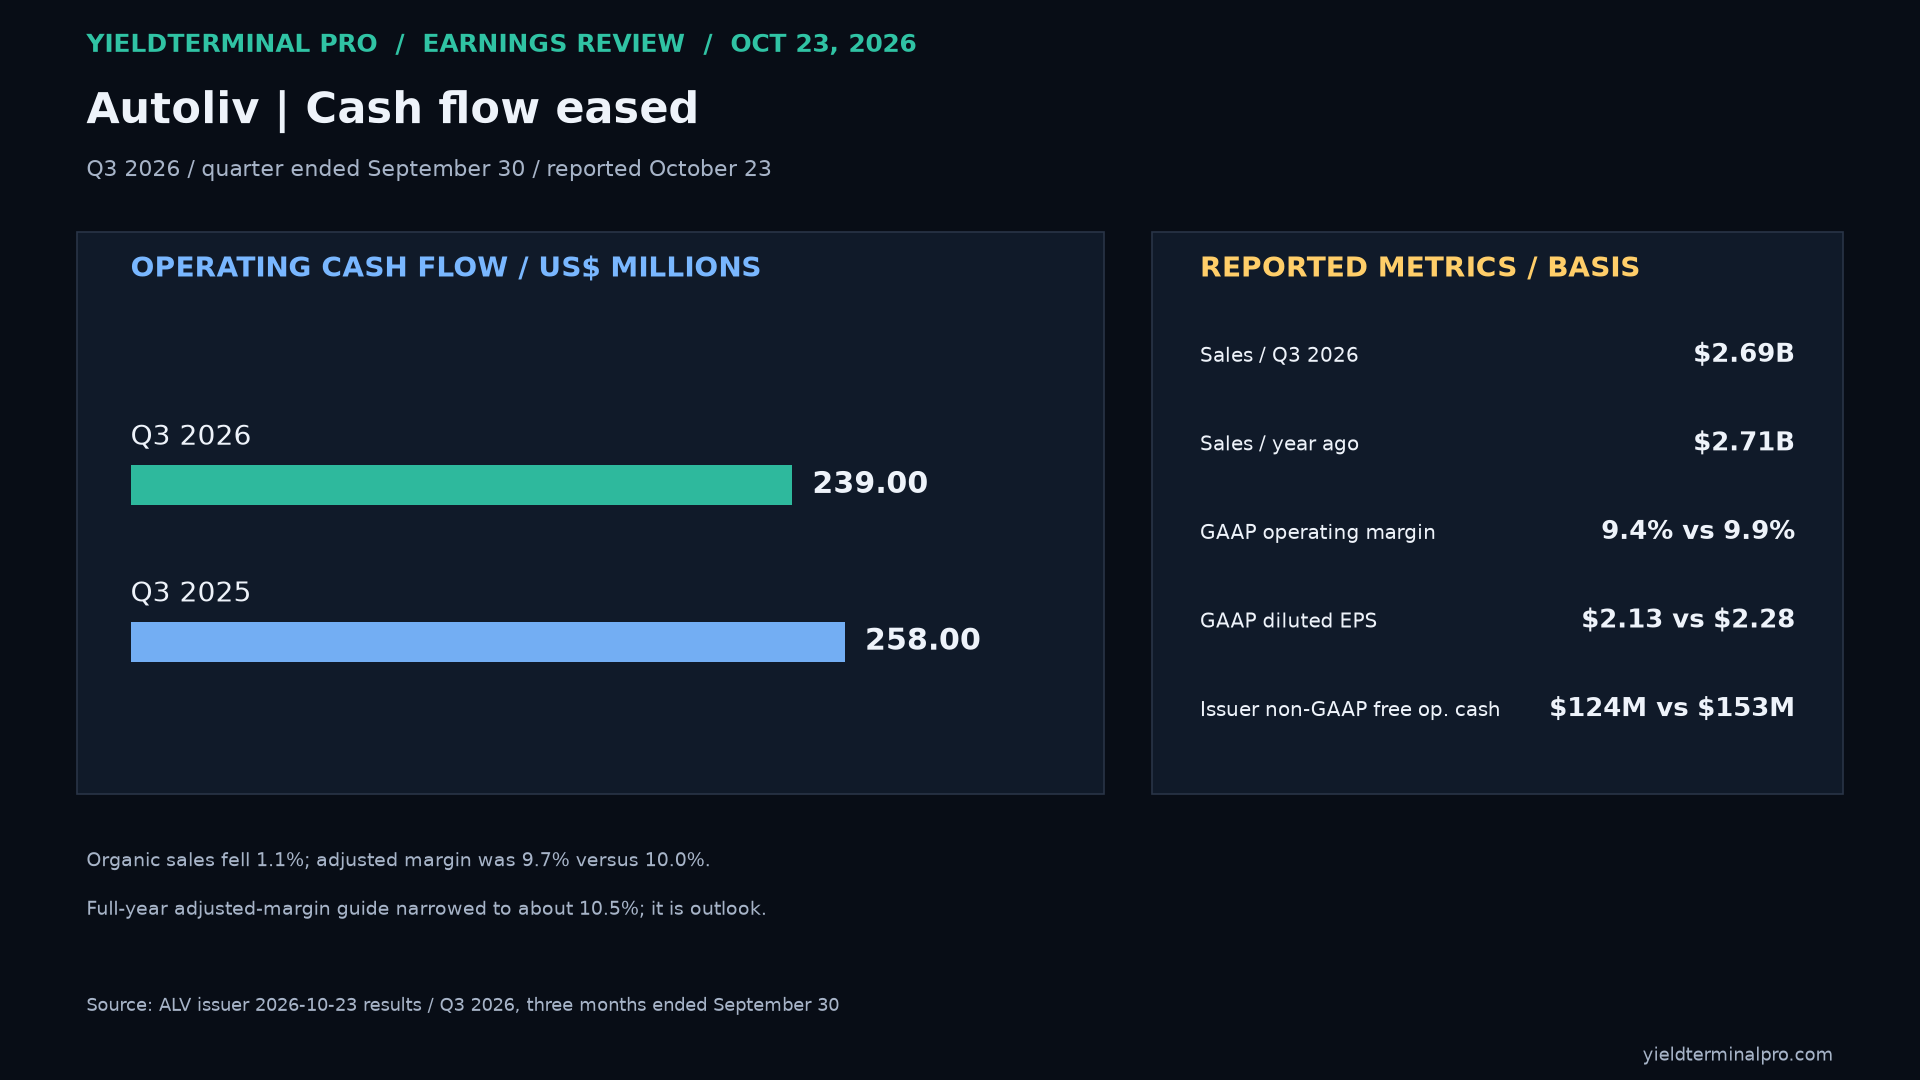
$ALVAutoliv — Q3 2026, three months ended September 30 issuer results Q3 net sales were $2.693 billion versus $2.706 billion; GAAP operating margin narrowed to 9.4% from 9.9%.
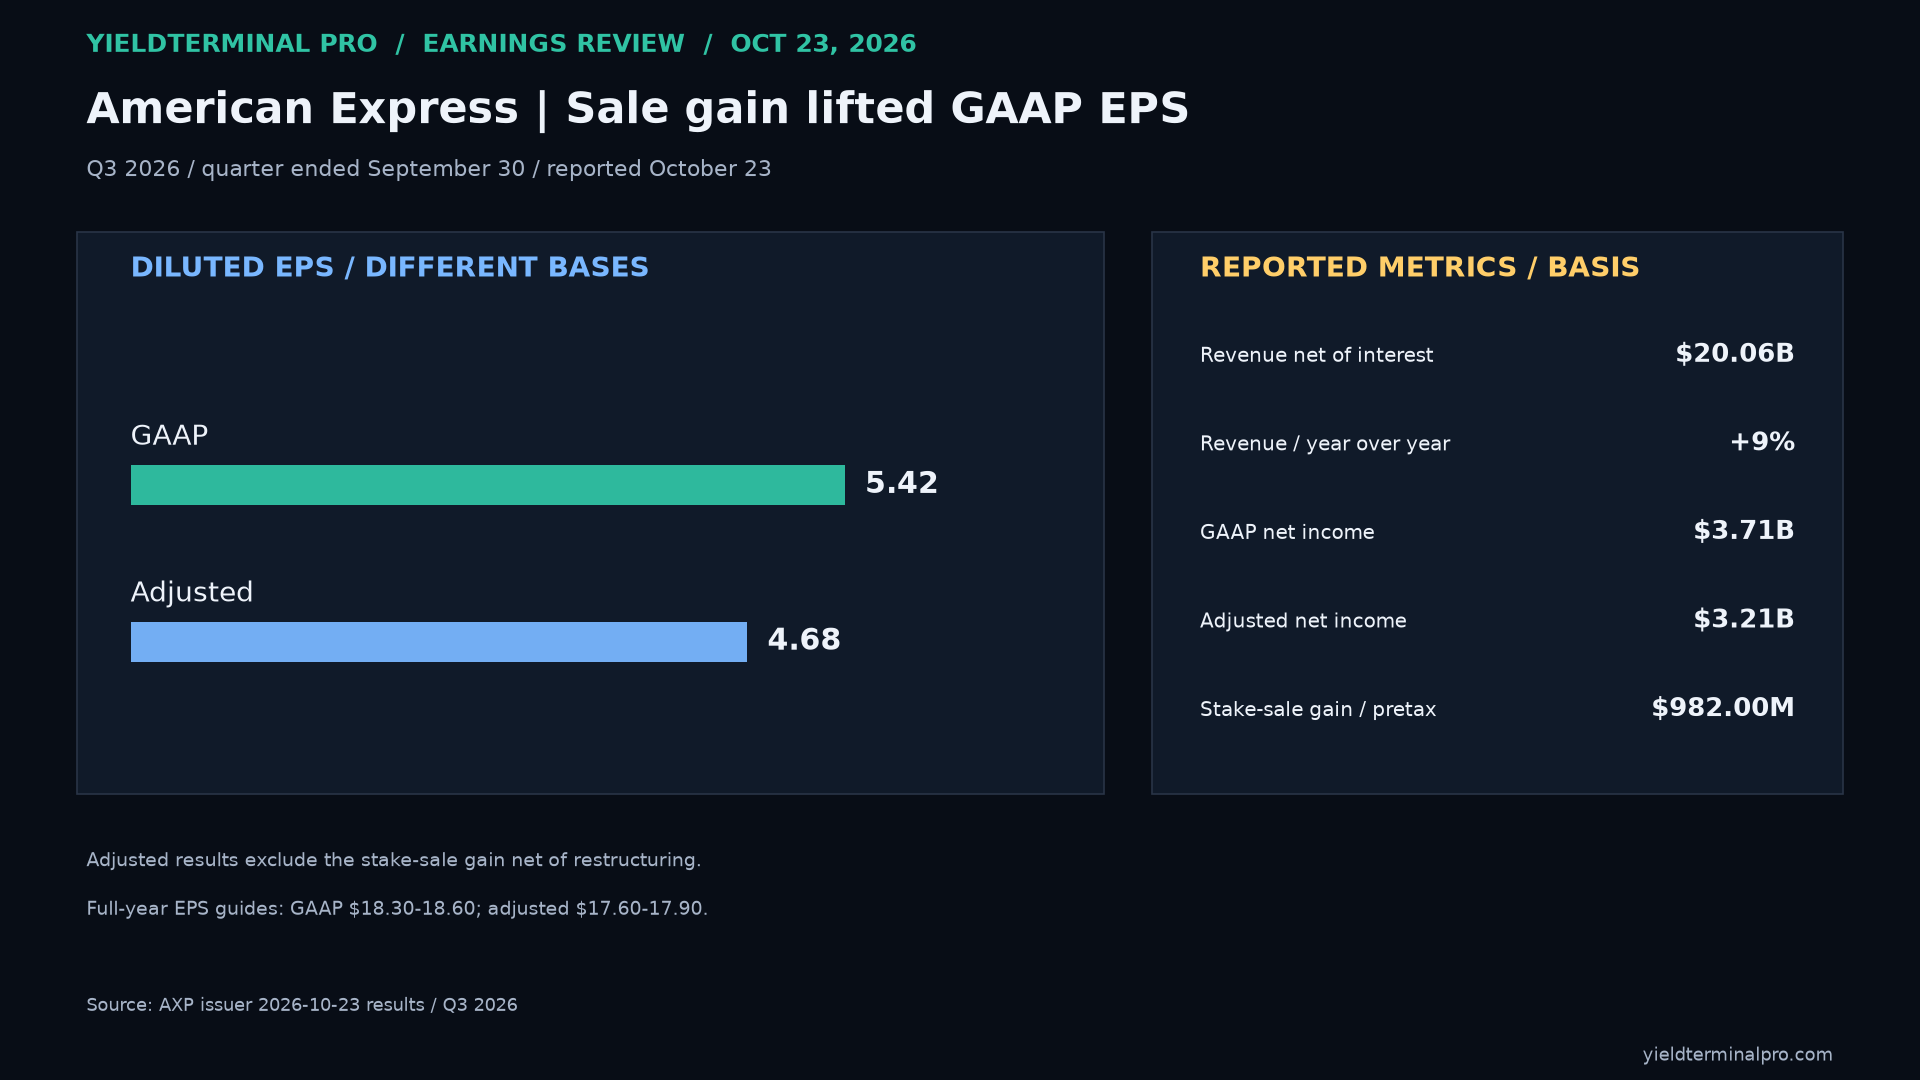
$AXPAmerican Express Company — Q3 2026 issuer results Q3 GAAP EPS was $5.42, including a stake-sale gain; adjusted EPS was $4.68. Revenues net of interest expense reached $20.062 billion.
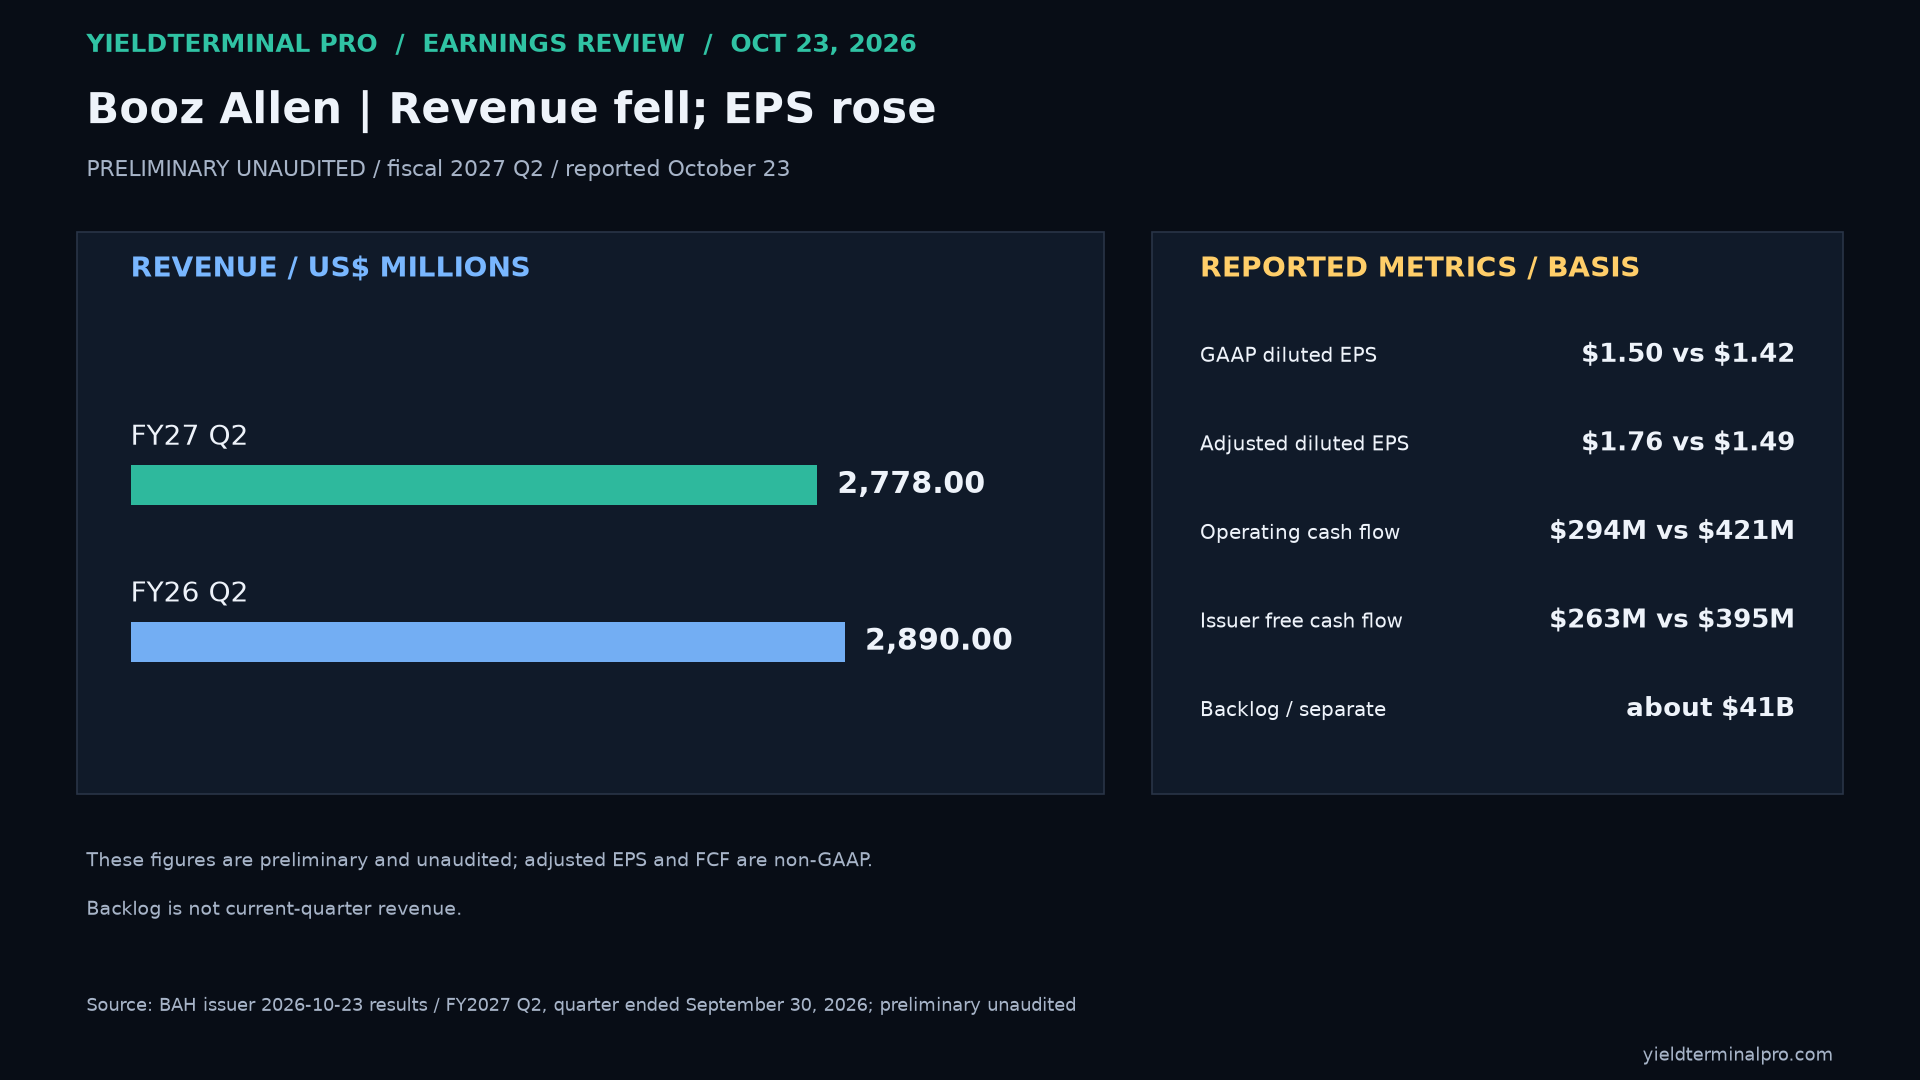
$BAHBooz Allen Hamilton — FY2027 Q2, quarter ended September 30, 2026; preliminary unaudited issuer results Preliminary fiscal 2027 Q2 revenue was $2.778 billion versus $2.890 billion; operating cash flow was about $294 million versus $421 million.
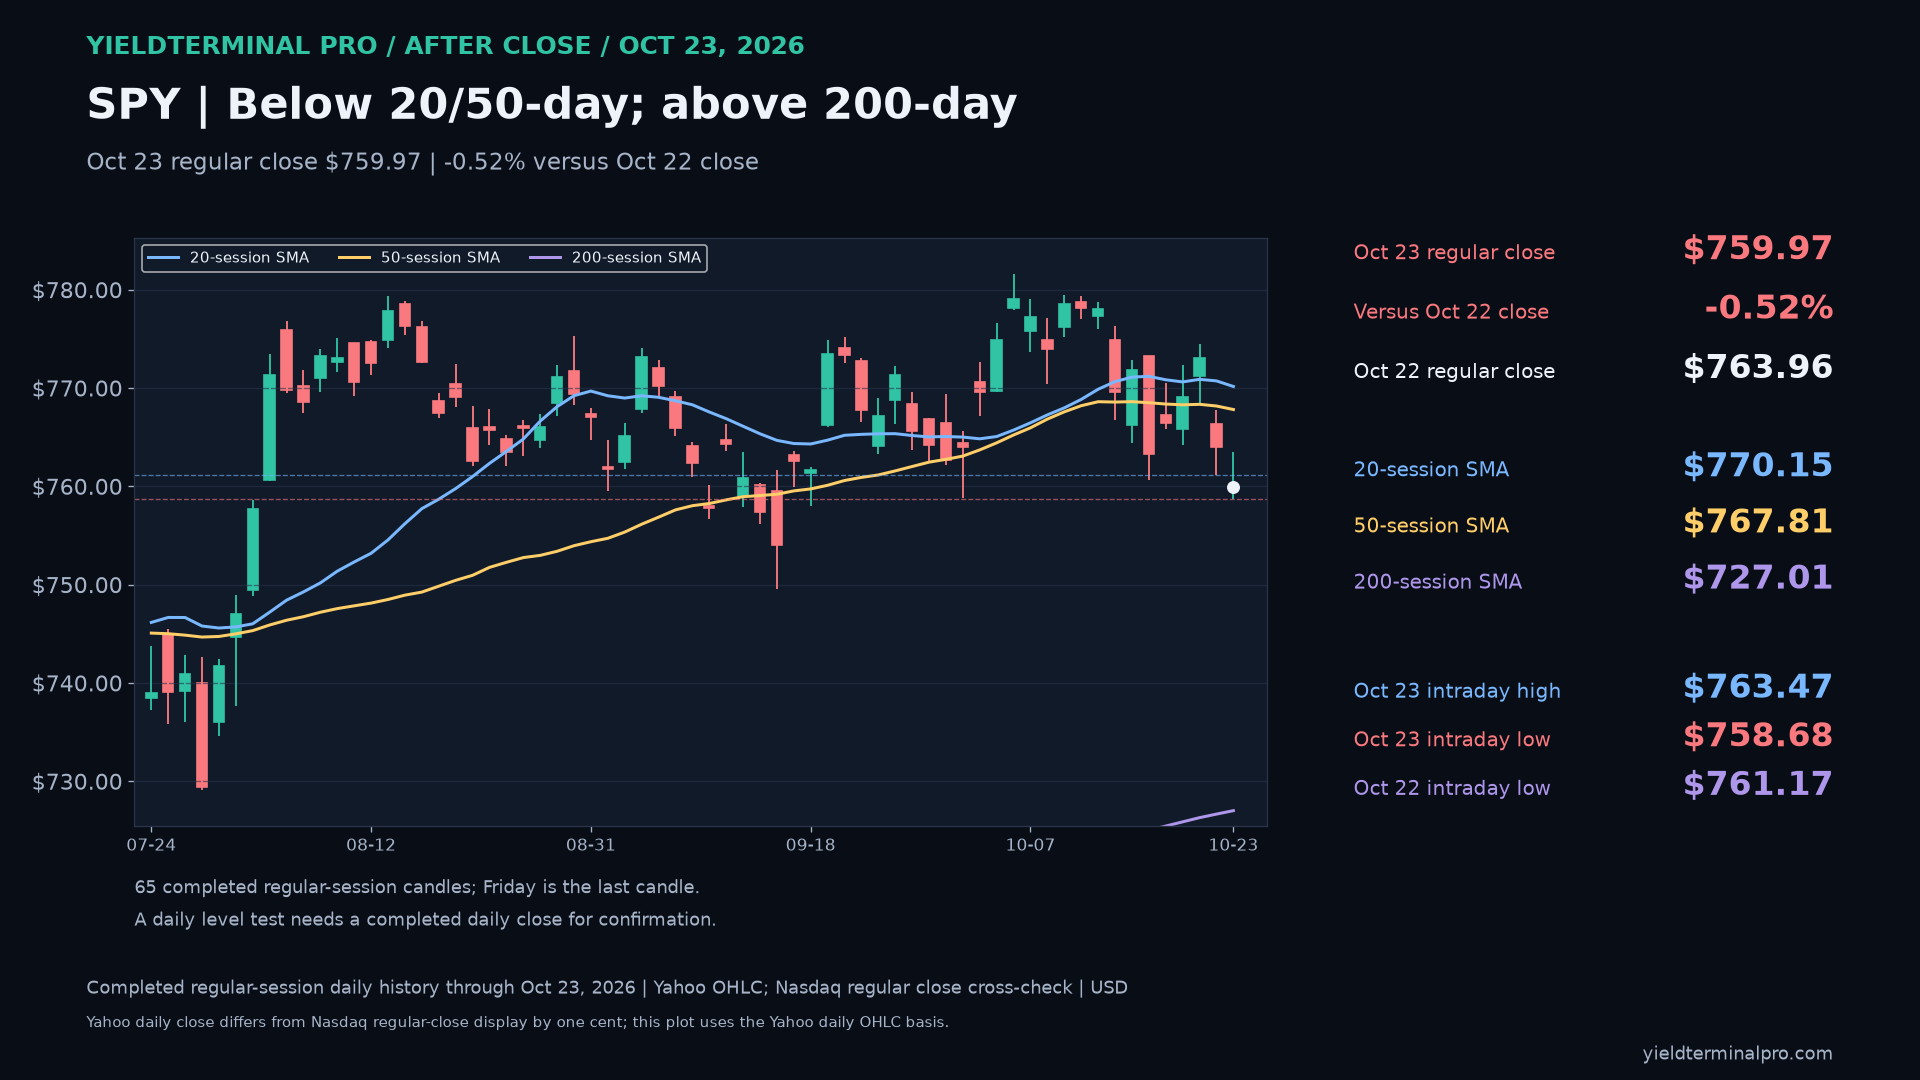
SPYSPY — October 23 After Close — daily 759.97October 23 completed regular-session closeSPY completed October 23 regular-session daily chart: close 759.97; 20-day SMA 770.15, 50-day SMA 767.81, 200-day SMA 727.01; October 23 intraday low 758.68; October 22 intraday low 761.17.
- 20-day SMA through October 23
- 770.15
- 50-day SMA through October 23
- 767.81
- 200-day SMA through October 23
- 727.01
- October 23 intraday low
- 758.68
- October 22 intraday low
- 761.17
Levels measured over Completed US regular-session history through October 23. Financial reporting and any extended-session observations remain separate.. A level measured over a different window can be a different number.
 See the chart on X →
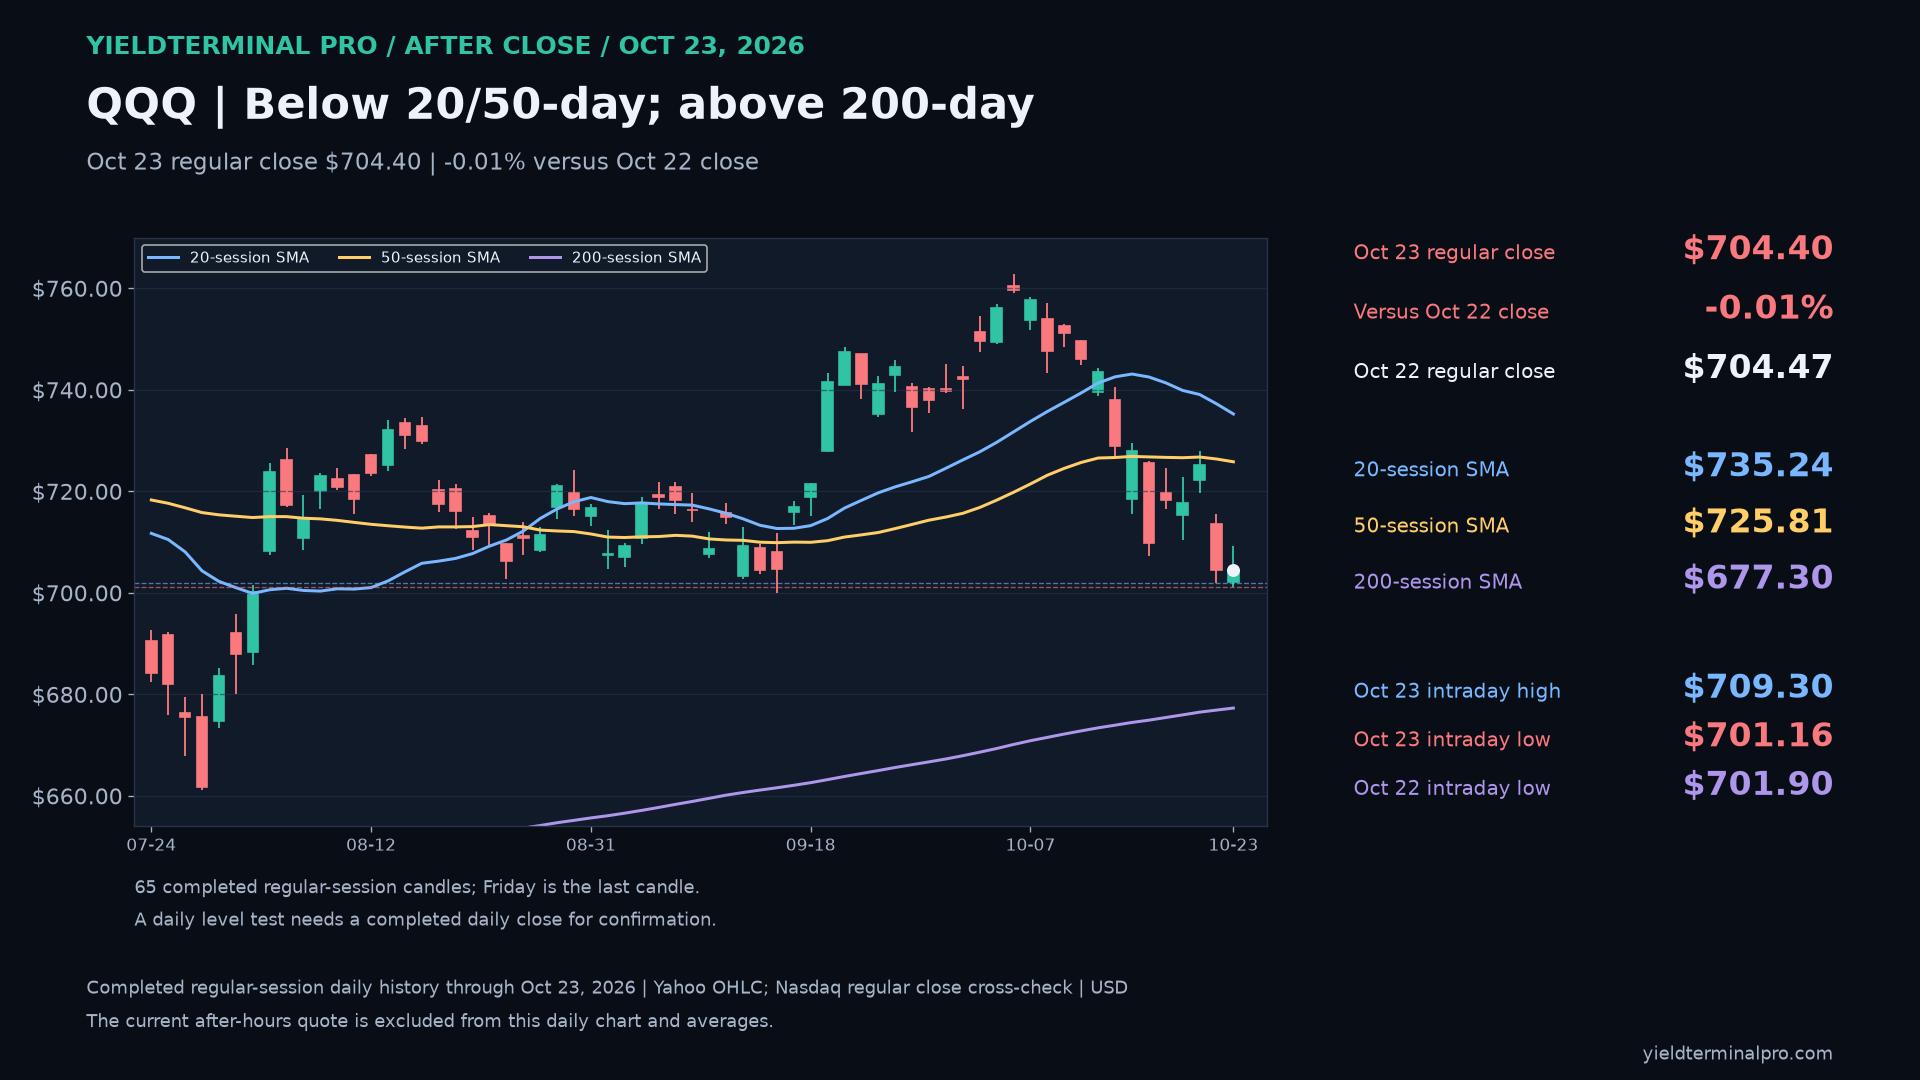
QQQQQQ — October 23 After Close — daily 704.40October 23 completed regular-session closeQQQ completed October 23 regular-session daily chart: close 704.40; 20-day SMA 735.24, 50-day SMA 725.81, 200-day SMA 677.30; October 23 intraday low 701.16; October 22 intraday low 701.90.
- 20-day SMA through October 23
- 735.24
- 50-day SMA through October 23
- 725.81
- 200-day SMA through October 23
- 677.30
- October 23 intraday low
- 701.16
- October 22 intraday low
- 701.90
Levels measured over Completed US regular-session history through October 23. Financial reporting and any extended-session observations remain separate.. A level measured over a different window can be a different number.
 See the chart on X →
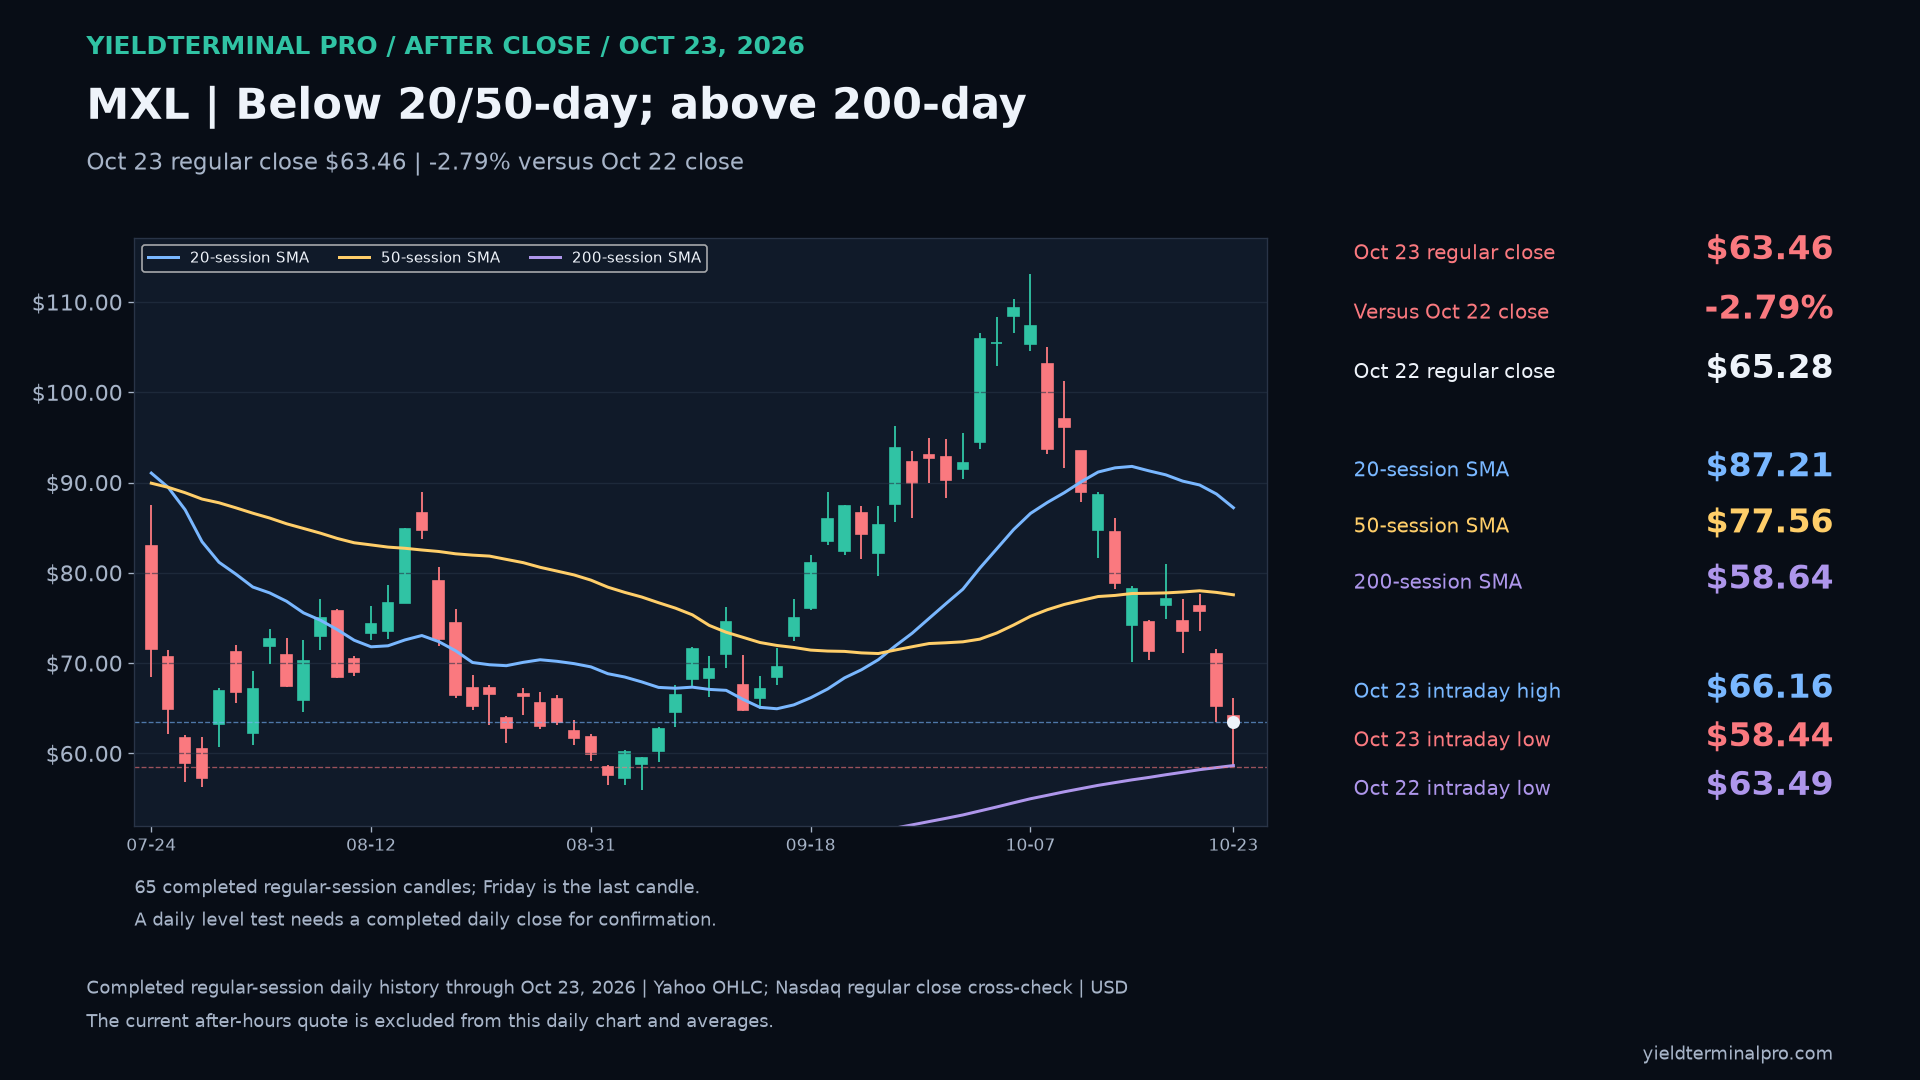
$MXLMXL — October 23 After Close — daily 63.46October 23 completed regular-session closeMXL completed October 23 regular-session daily chart: close 63.46; 20-day SMA 87.21, 50-day SMA 77.56, 200-day SMA 58.64; October 23 intraday low 58.44; October 22 intraday low 63.49.
- 20-day SMA through October 23
- 87.21
- 50-day SMA through October 23
- 77.56
- 200-day SMA through October 23
- 58.64
- October 23 intraday low
- 58.44
- October 22 intraday low
- 63.49
Levels measured over Completed US regular-session history through October 23. Financial reporting and any extended-session observations remain separate.. A level measured over a different window can be a different number.
 See the chart on X →
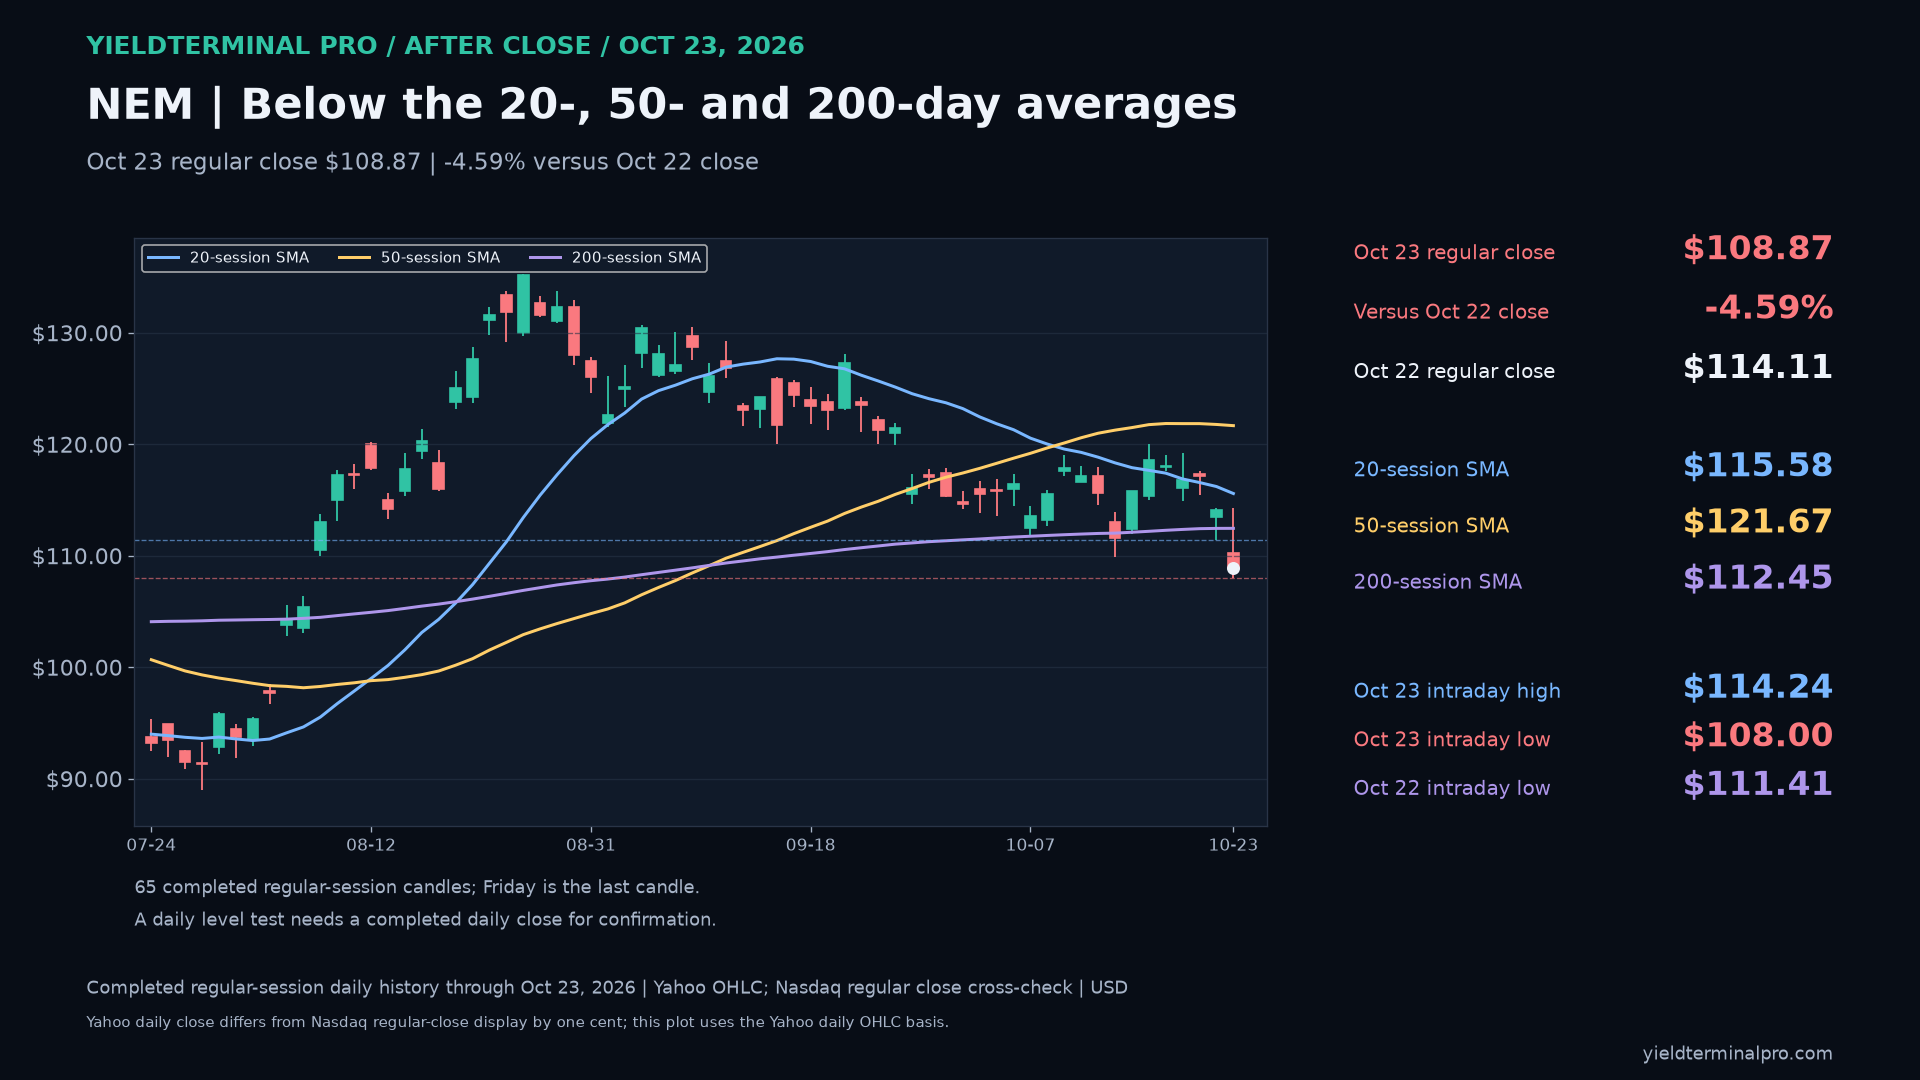
$NEMNEM — October 23 After Close — daily 108.87October 23 completed regular-session closeNEM completed October 23 regular-session daily chart: close 108.87; 20-day SMA 115.58, 50-day SMA 121.67, 200-day SMA 112.45; October 23 intraday low 108.00; October 22 intraday low 111.41.
- 20-day SMA through October 23
- 115.58
- 50-day SMA through October 23
- 121.67
- 200-day SMA through October 23
- 112.45
- October 23 intraday low
- 108.00
- October 22 intraday low
- 111.41
Levels measured over Completed US regular-session history through October 23. Financial reporting and any extended-session observations remain separate.. A level measured over a different window can be a different number.
 See the chart on X →
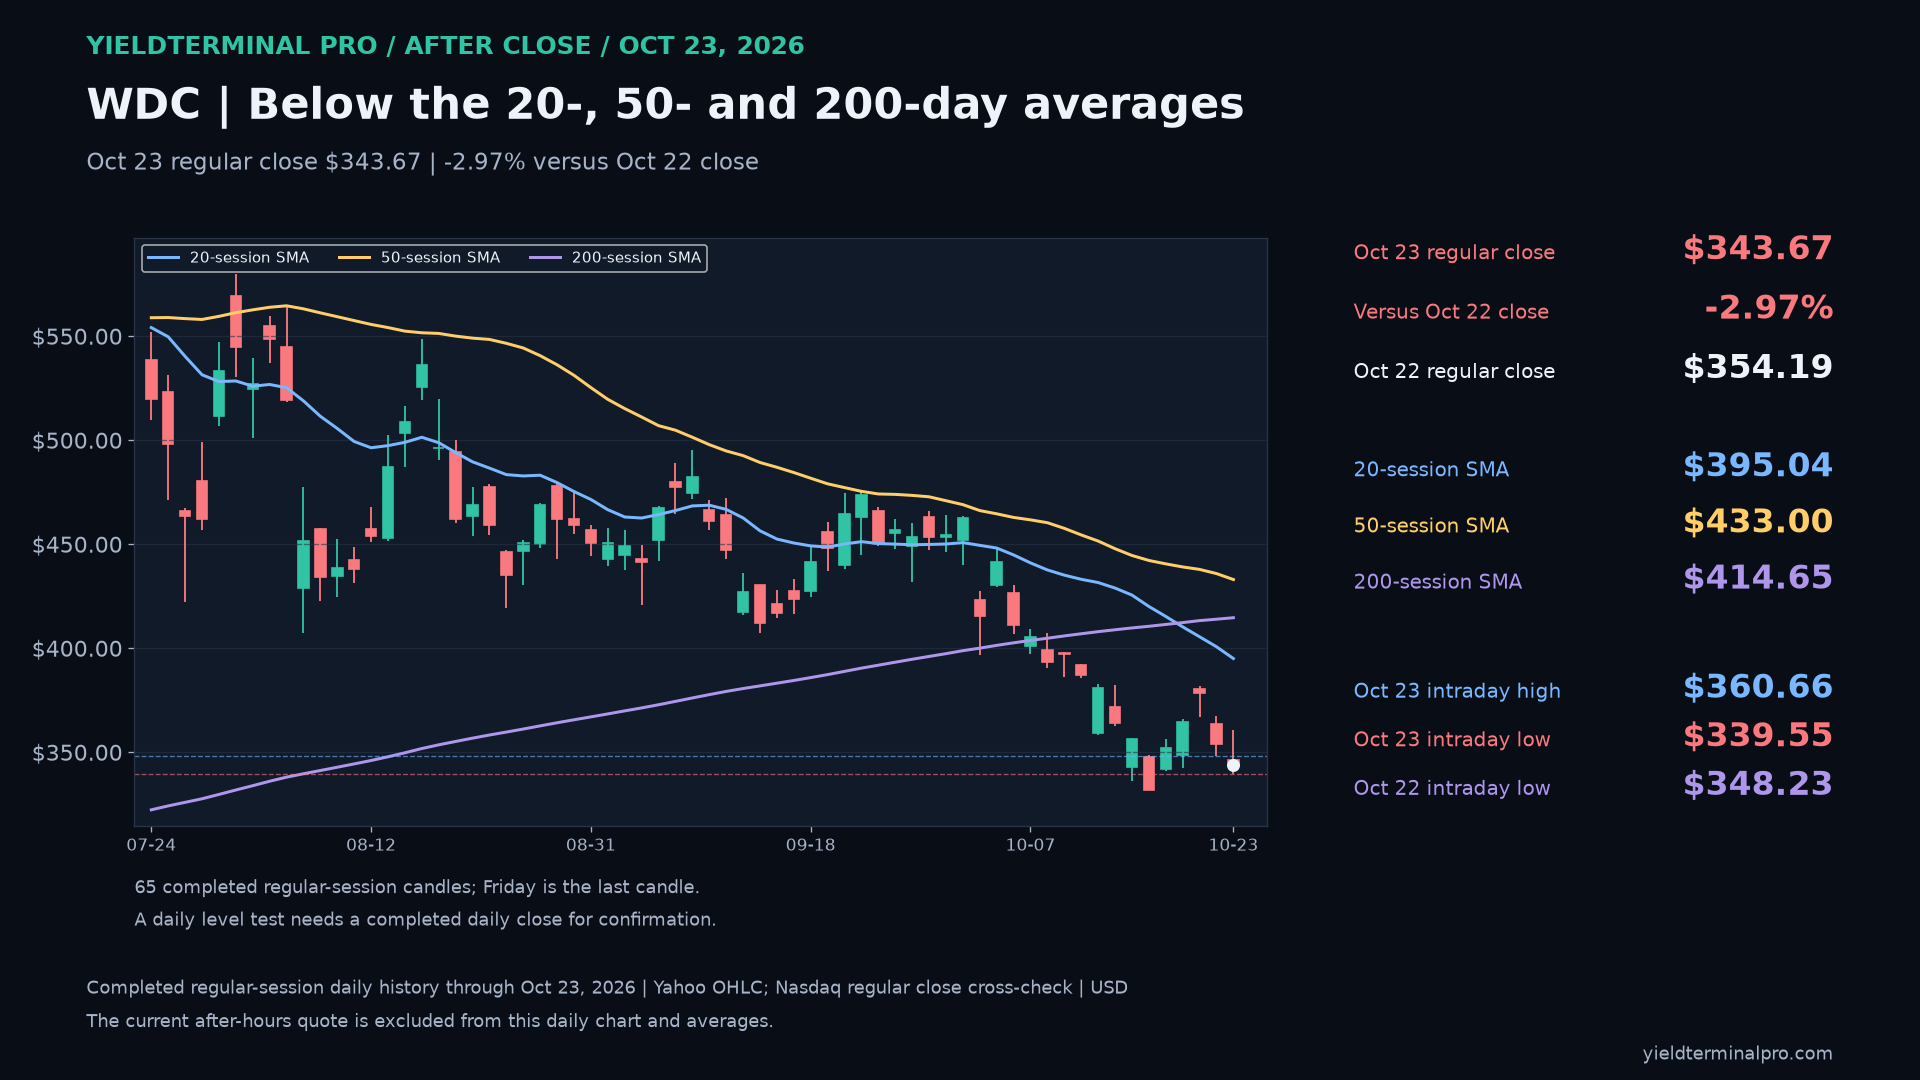
$WDCWDC — October 23 After Close — daily 343.67October 23 completed regular-session closeWDC completed October 23 regular-session daily chart: close 343.67; 20-day SMA 395.04, 50-day SMA 433.00, 200-day SMA 414.65; October 23 intraday low 339.55; October 22 intraday low 348.23.
- 20-day SMA through October 23
- 395.04
- 50-day SMA through October 23
- 433.00
- 200-day SMA through October 23
- 414.65
- October 23 intraday low
- 339.55
- October 22 intraday low
- 348.23
Levels measured over Completed US regular-session history through October 23. Financial reporting and any extended-session observations remain separate.. A level measured over a different window can be a different number.
 See the chart on X →
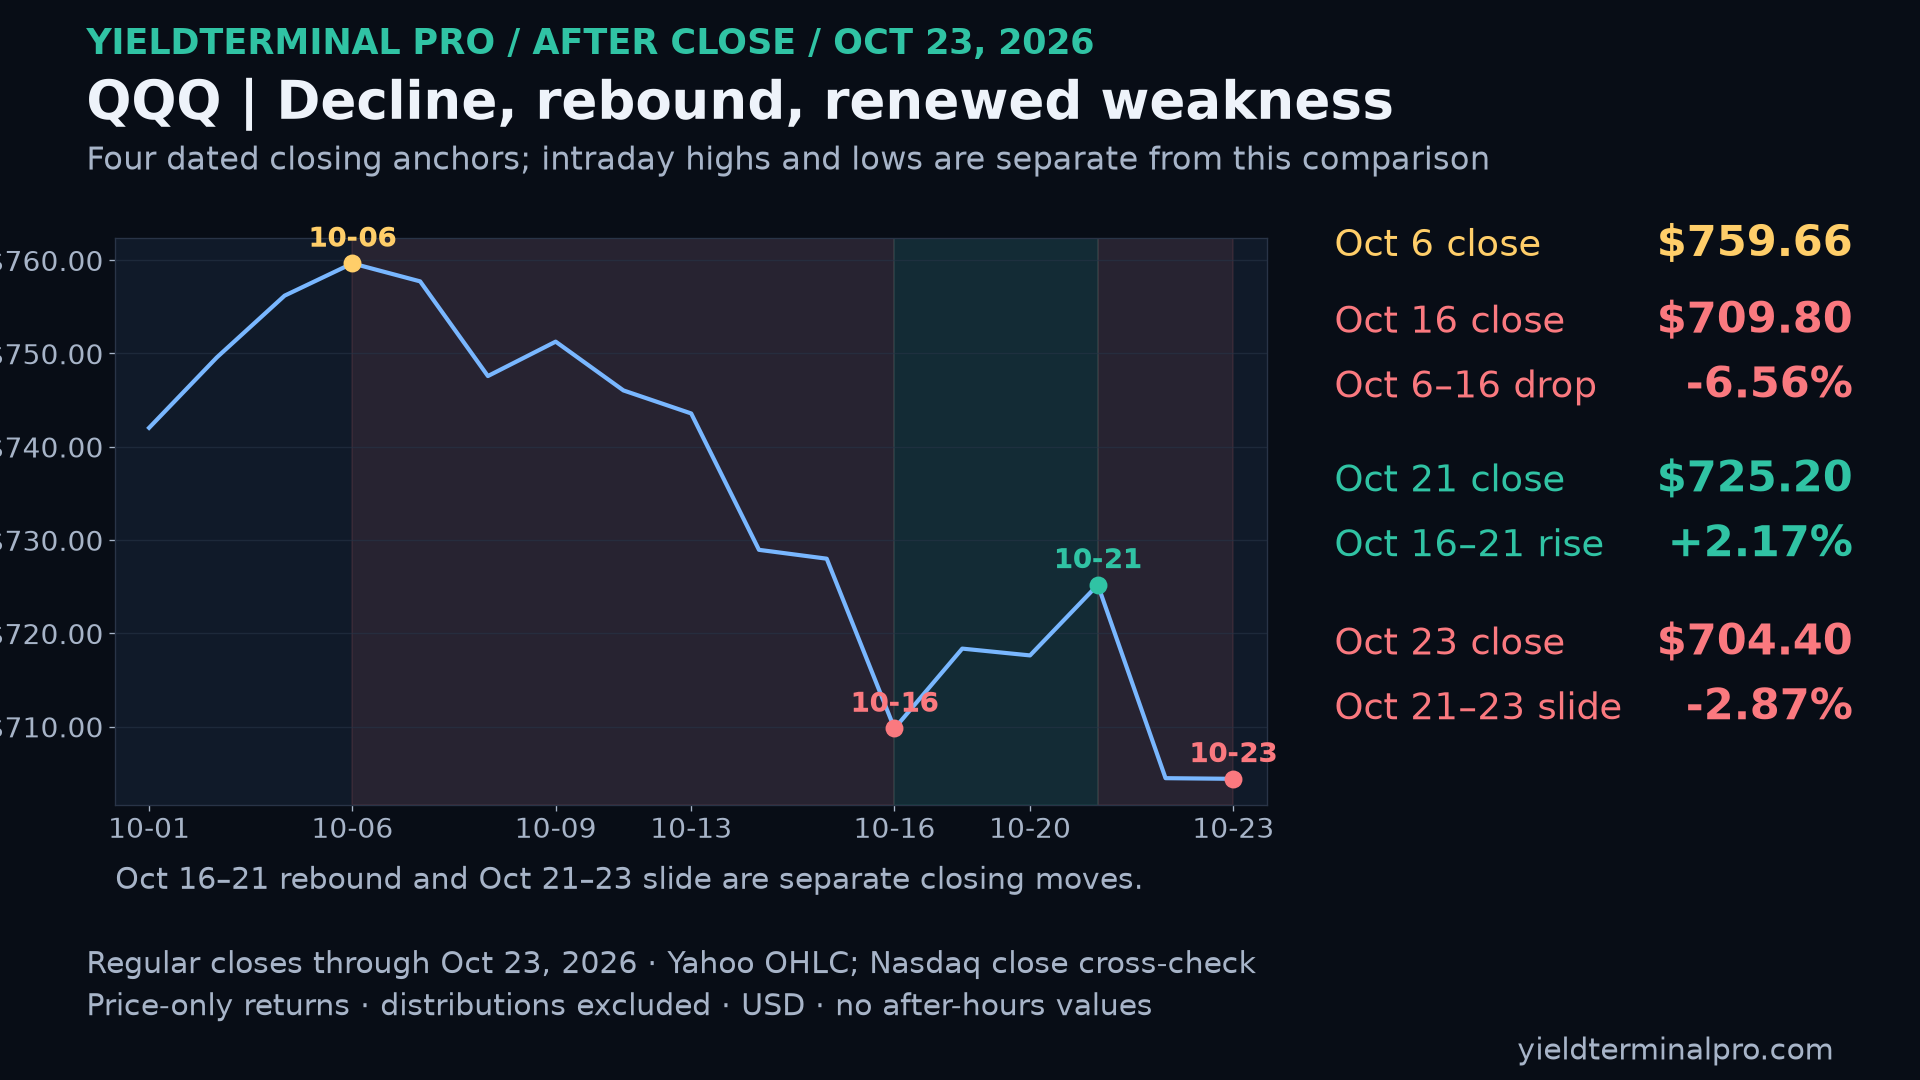
QQQQQQ — October 23 After Close — closing-price context 704.40October 23 completed regular-session close; supporting price referenceQQQ closing-price decline from October 6 to October 16, a separate rebound through October 21, and renewed weakness through October 23; completed regular-session closes only.
Levels measured over Completed regular-session closing-price phases only through October 23; intraday and extended-session quotes excluded.. A level measured over a different window can be a different number.
 See the chart on X →
$MXLMXL — October 23 After Close — earnings 63.46October 23 completed regular-session close; supporting price referenceMaxLinear September 2026 quarter reported revenue, GAAP operating margin and earnings.
Levels measured over Issuer financial period shown on chart. Supporting price reference is the completed October 23 regular-session close; no live quote implied.. A level measured over a different window can be a different number.
See the chart on X →$MXLMXL — October 23 After Close — cash 63.46October 23 completed regular-session close; supporting price referenceMaxLinear September 2026 quarter operating cash use, financing draw and future revenue guidance are separate measures.
Levels measured over Issuer financial period shown on chart. Supporting price reference is the completed October 23 regular-session close; no live quote implied.. A level measured over a different window can be a different number.
See the chart on X →$NEMNEM — October 23 After Close — earnings 108.87October 23 completed regular-session close; supporting price referenceNewmont September 2026 quarter production, realized gold price and reported earnings.
Levels measured over Issuer financial period shown on chart. Supporting price reference is the completed October 23 regular-session close; no live quote implied.. A level measured over a different window can be a different number.
See the chart on X →$NEMNEM — October 23 After Close — cash 108.87October 23 completed regular-session close; supporting price referenceNewmont September 2026 quarter operating cash flow and issuer-reconciled non-GAAP free cash flow.
Levels measured over Issuer financial period shown on chart. Supporting price reference is the completed October 23 regular-session close; no live quote implied.. A level measured over a different window can be a different number.
See the chart on X →$WDCWDC — October 23 After Close — earnings 343.67October 23 completed regular-session close; supporting price referenceWestern Digital fiscal first-quarter 2027 reported revenue and earnings; next-quarter figures are guidance.
Levels measured over Issuer financial period shown on chart. Supporting price reference is the completed October 23 regular-session close; no live quote implied.. A level measured over a different window can be a different number.
See the chart on X →$WDCWDC — October 23 After Close — cash 343.67October 23 completed regular-session close; supporting price referenceWestern Digital fiscal first-quarter 2027 company-defined free cash flow and next-quarter guidance.
Levels measured over Issuer financial period shown on chart. Supporting price reference is the completed October 23 regular-session close; no live quote implied.. A level measured over a different window can be a different number.
See the chart on X →$BEBE — October 23 After Close — earnings Bloom Energy September 2026 quarter reported revenue, operating margin and earnings.
Levels measured over Issuer financial period shown on chart. BE October 23 exact daily close is on hold; no live quote implied.. A level measured over a different window can be a different number.
See the chart on X →$BEBE — October 23 After Close — cash Bloom Energy September 2026 quarter operating cash use, capital spending and future revenue guidance.
Levels measured over Issuer financial period shown on chart. BE October 23 exact daily close is on hold; no live quote implied.. A level measured over a different window can be a different number.
See the chart on X →Permanent link to this day →