← All daily levels

Daily Levels, Tue, 6 Oct 2026

Premarket prints on 6 October 2026, frozen at 06:43 ET and measured against the 5 October close. Live quotes, not delayed.

Educational commentary, not investment advice.

The four names the Overnight Board carried into this morning's Premarket Board as last night's runners: $CEG, $VST, $VRT and $CBRS. They are a selection made on last night's overnight session, not a ranking of this morning's widest premarket movers, so no screen stands behind them. All four are marked at 06:43 ET, before the bell. Premarket is thin: a print is not a session. $GLD and $SLV were added by request and are a different basis again: completed 5 October closes, no live price.

$CEGConstellation Energy Corporation
282.92premarket print, 06:43 ET

CEG is 5.7% higher premarket, marked at 282.92 against a 267.62 close.

premarket mark (06:43 ET)A live extended-hours print, not an opening price.
282.92
prior close (5 Oct)The close the premarket move is measured against.
267.62
200-day simple moving averageComputed from daily closes through the 5 October session.
287.30
50-day simple moving averageComputed from daily closes through the 5 October session.
271.34

Levels measured over a premarket print read at 06:43 ET on 6 October 2026 and frozen, with the chart behind it showing daily closes through the 5 October session. A level measured over a different window can be a different number.
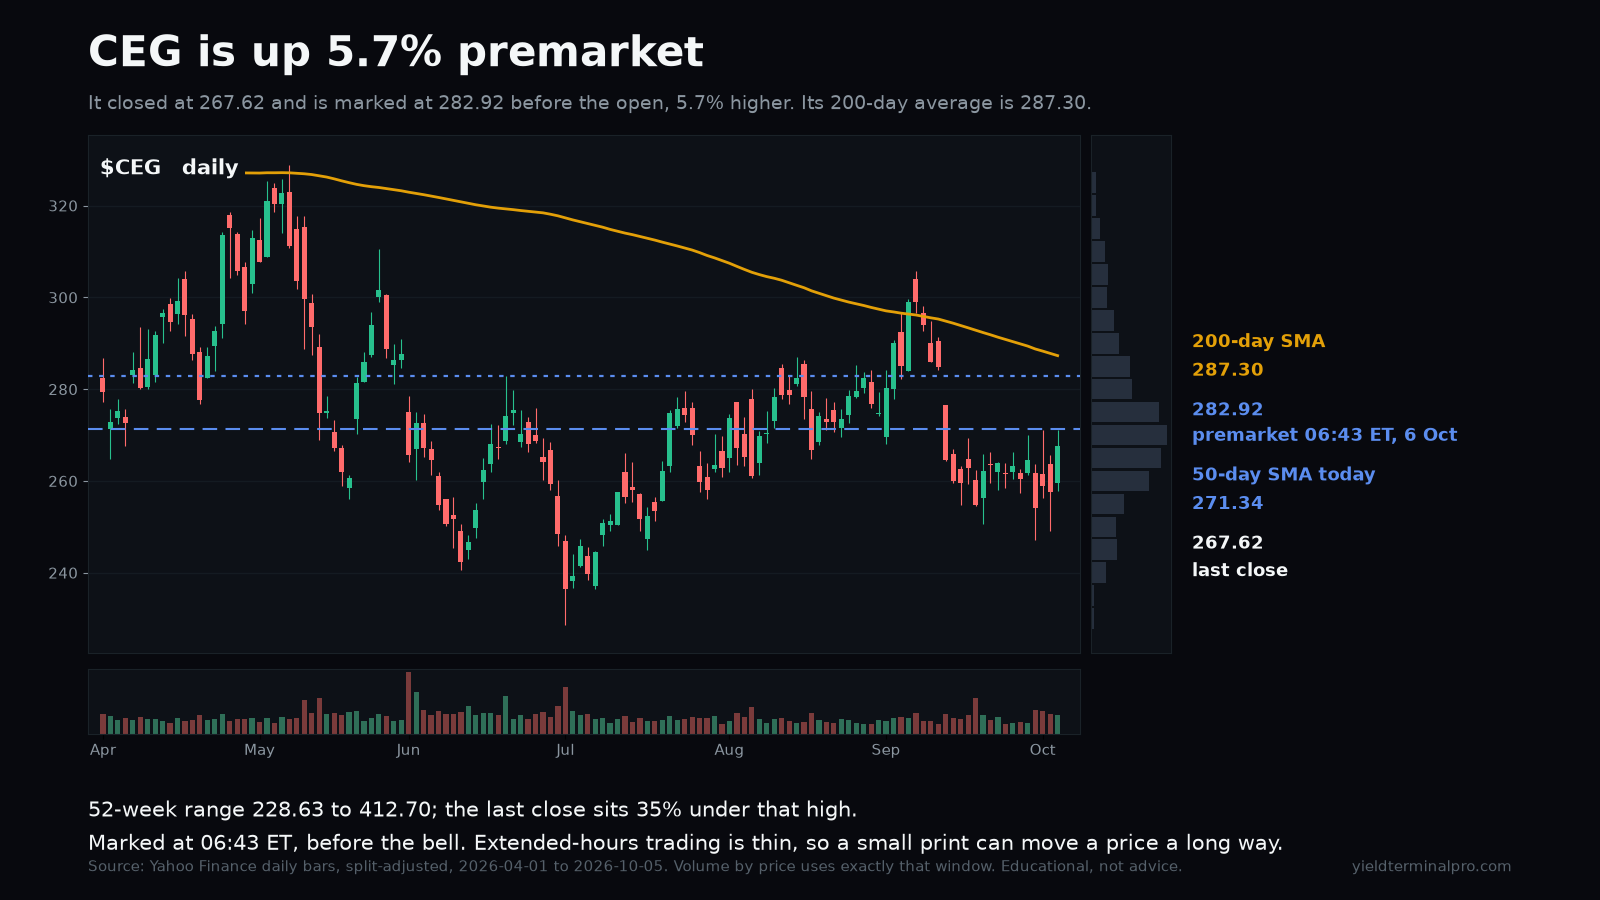
CEG chart
$VSTVistra Corp.
147.49premarket print, 06:43 ET

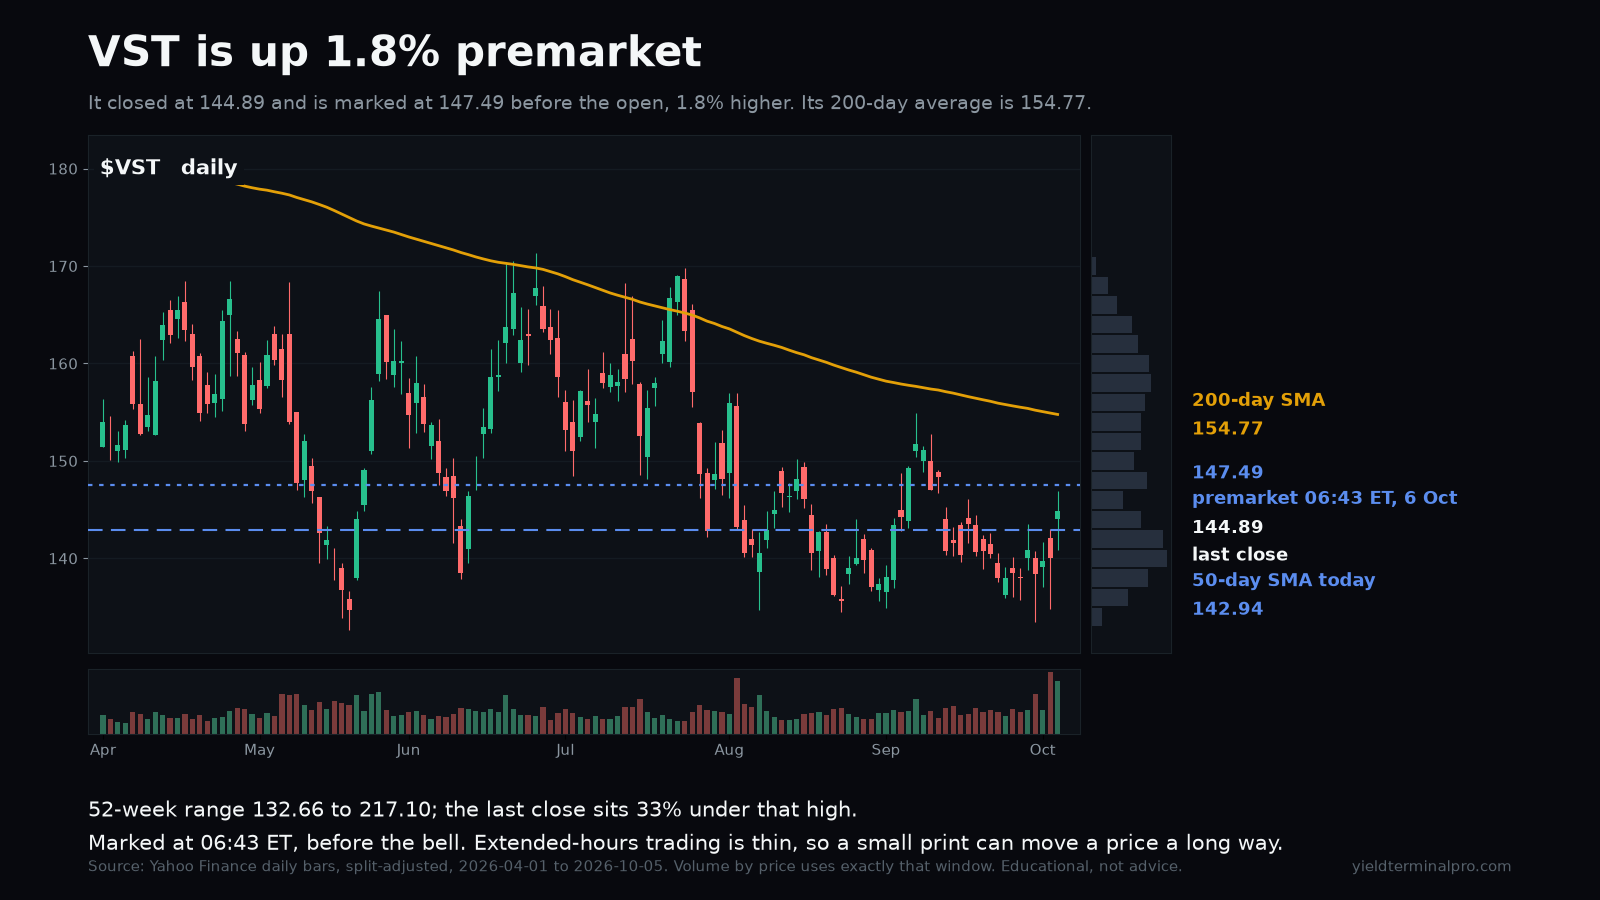
VST is 1.8% higher premarket, marked at 147.49 against a 144.89 close.

premarket mark (06:43 ET)A live extended-hours print, not an opening price.
147.49
prior close (5 Oct)The close the premarket move is measured against.
144.89
200-day simple moving averageComputed from daily closes through the 5 October session.
154.77
50-day simple moving averageComputed from daily closes through the 5 October session.
142.94

Levels measured over a premarket print read at 06:43 ET on 6 October 2026 and frozen, with the chart behind it showing daily closes through the 5 October session. A level measured over a different window can be a different number.
VST chart
$VRTVertiv Holdings Co
255.99premarket print, 06:43 ET

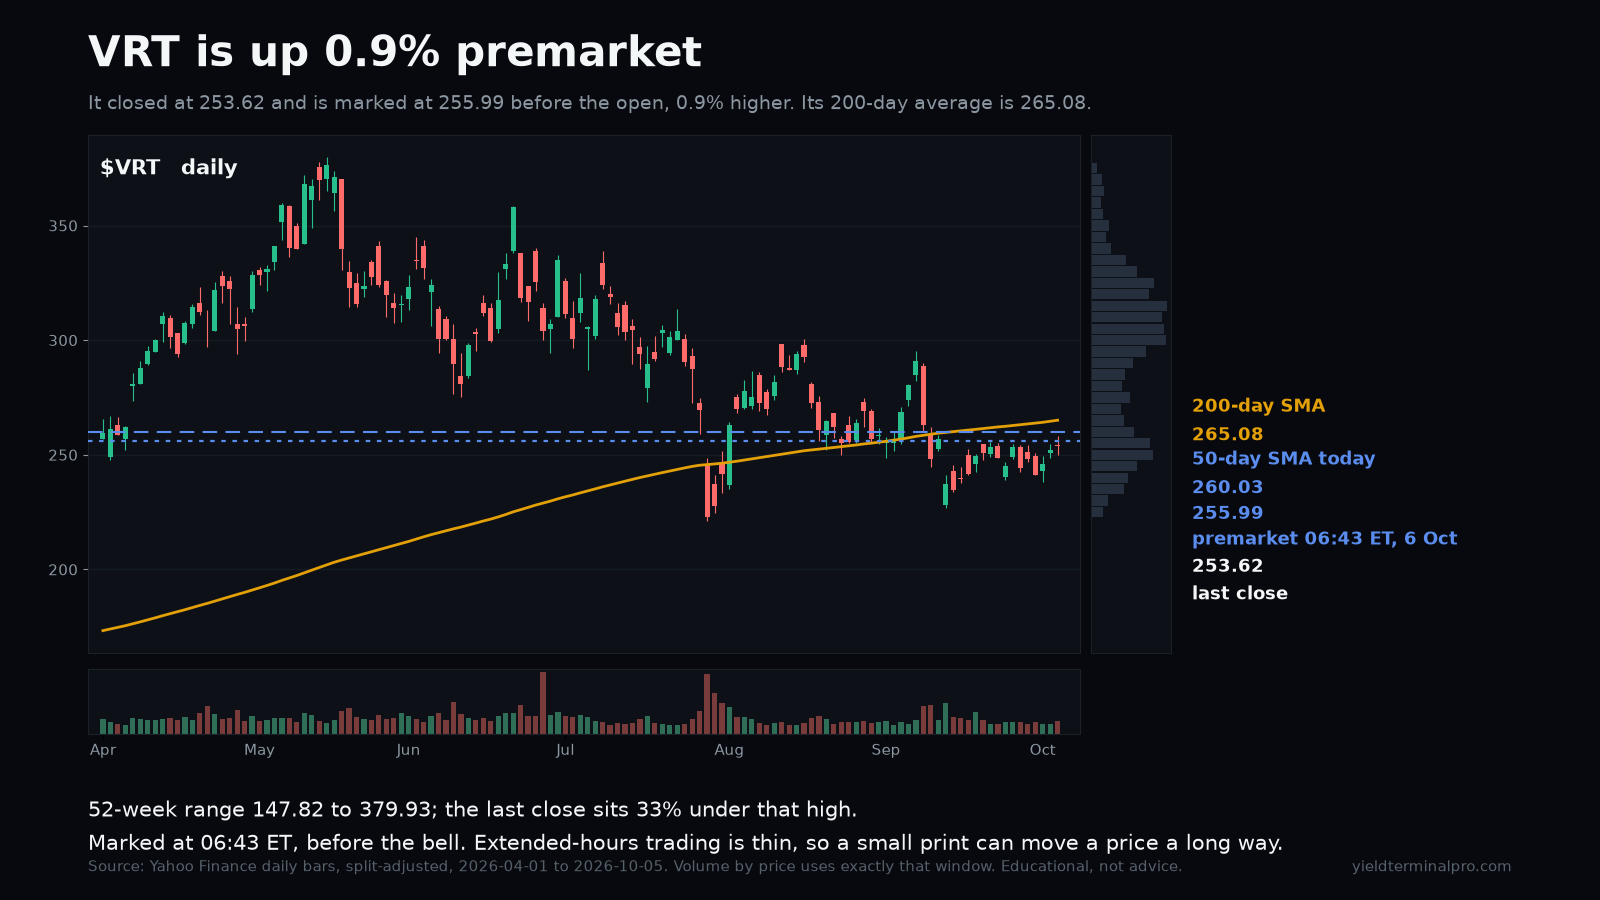
VRT is 0.9% higher premarket, marked at 255.99 against a 253.62 close.

premarket mark (06:43 ET)A live extended-hours print, not an opening price.
255.99
prior close (5 Oct)The close the premarket move is measured against.
253.62
200-day simple moving averageComputed from daily closes through the 5 October session.
265.08
50-day simple moving averageComputed from daily closes through the 5 October session.
260.03

Levels measured over a premarket print read at 06:43 ET on 6 October 2026 and frozen, with the chart behind it showing daily closes through the 5 October session. A level measured over a different window can be a different number.
VRT chart
$CBRSCerebras Systems, Inc. Class A
183.03premarket print, 06:43 ET

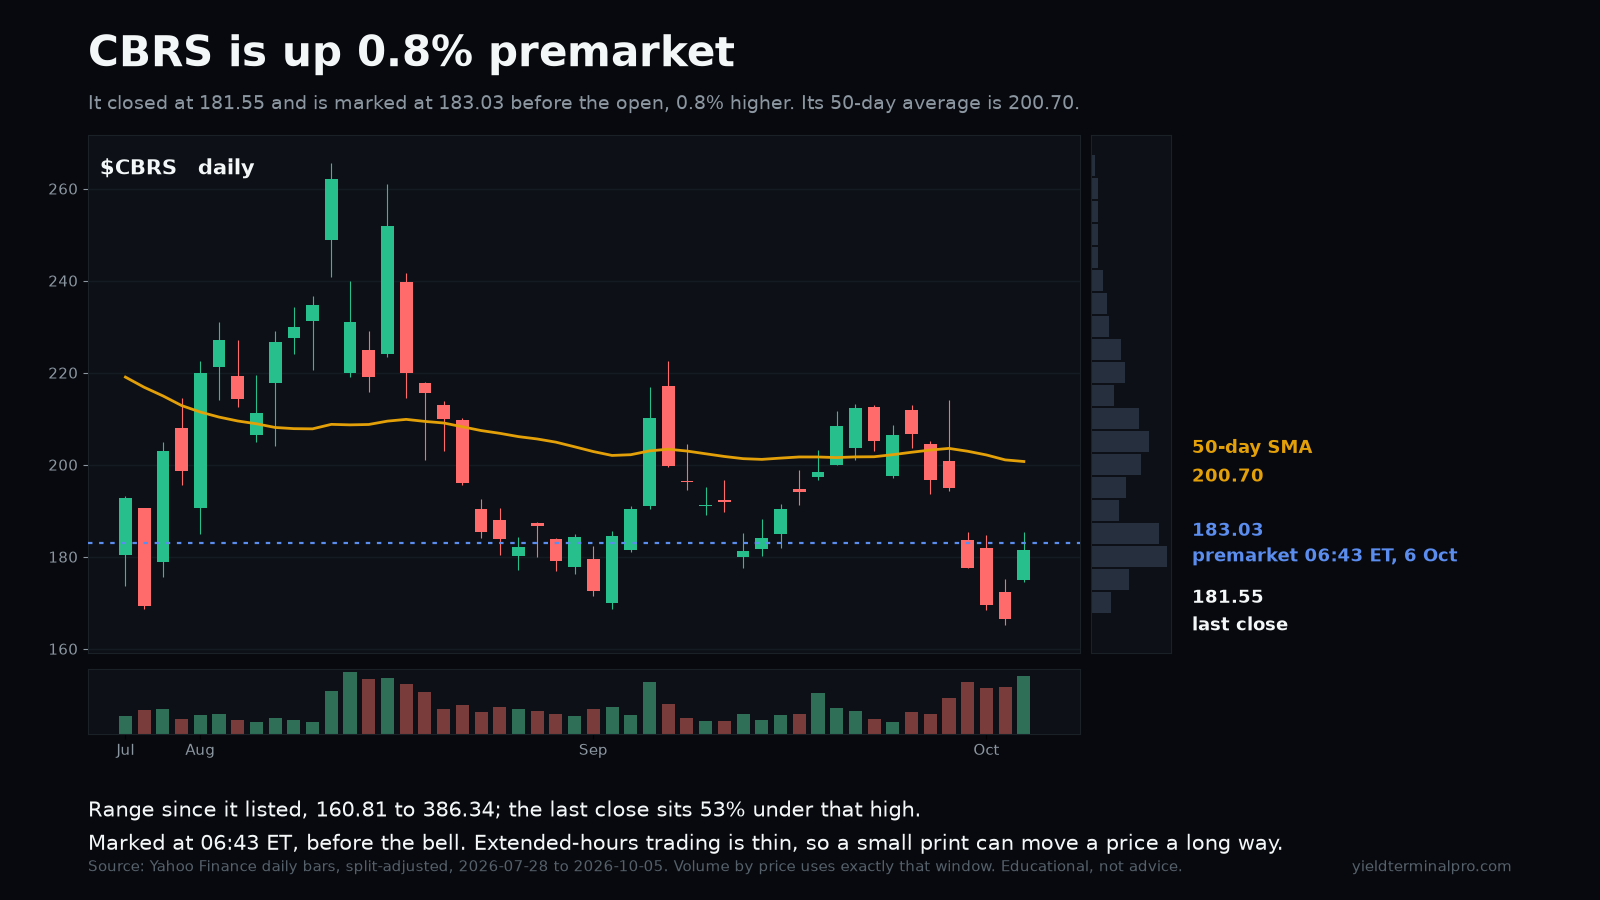
CBRS is 0.8% higher premarket, marked at 183.03 against a 181.55 close.

premarket mark (06:43 ET)A live extended-hours print, not an opening price.
183.03
prior close (5 Oct)The close the premarket move is measured against.
181.55
50-day simple moving averageComputed from daily closes through the 5 October session.
200.70

Levels measured over a premarket print read at 06:43 ET on 6 October 2026 and frozen, with the chart behind it showing daily closes through the 5 October session. A level measured over a different window can be a different number.
CBRS chart
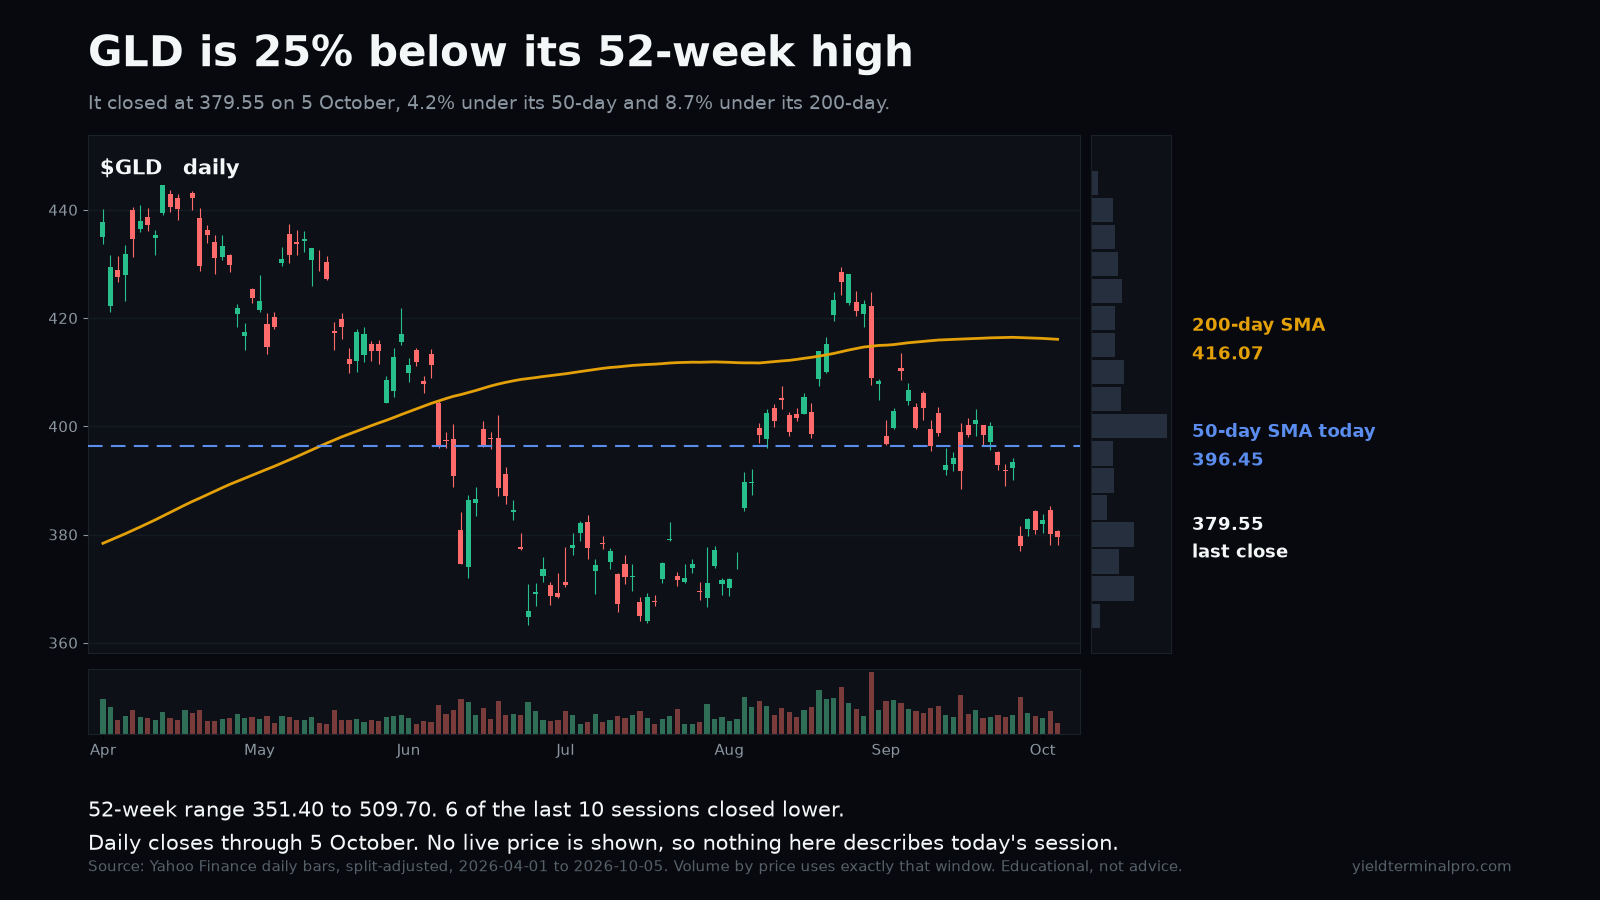
$GLDSPDR Gold Shares
379.55close, 5 October

GLD closed at 379.55 on 5 October, 25% below its 52-week high and under both its averages.

close (5 Oct)A completed daily close, not a live price.
379.55
50-day simple moving averageComputed from daily closes through the 5 October session.
396.45
200-day simple moving averageComputed from daily closes through the 5 October session.
416.07
52-week high25% above the 5 October close.
509.70

Levels measured over daily closes through the 5 October session, with the 52-week range measured over the plotted window on the chart. A level measured over a different window can be a different number.
GLD chart
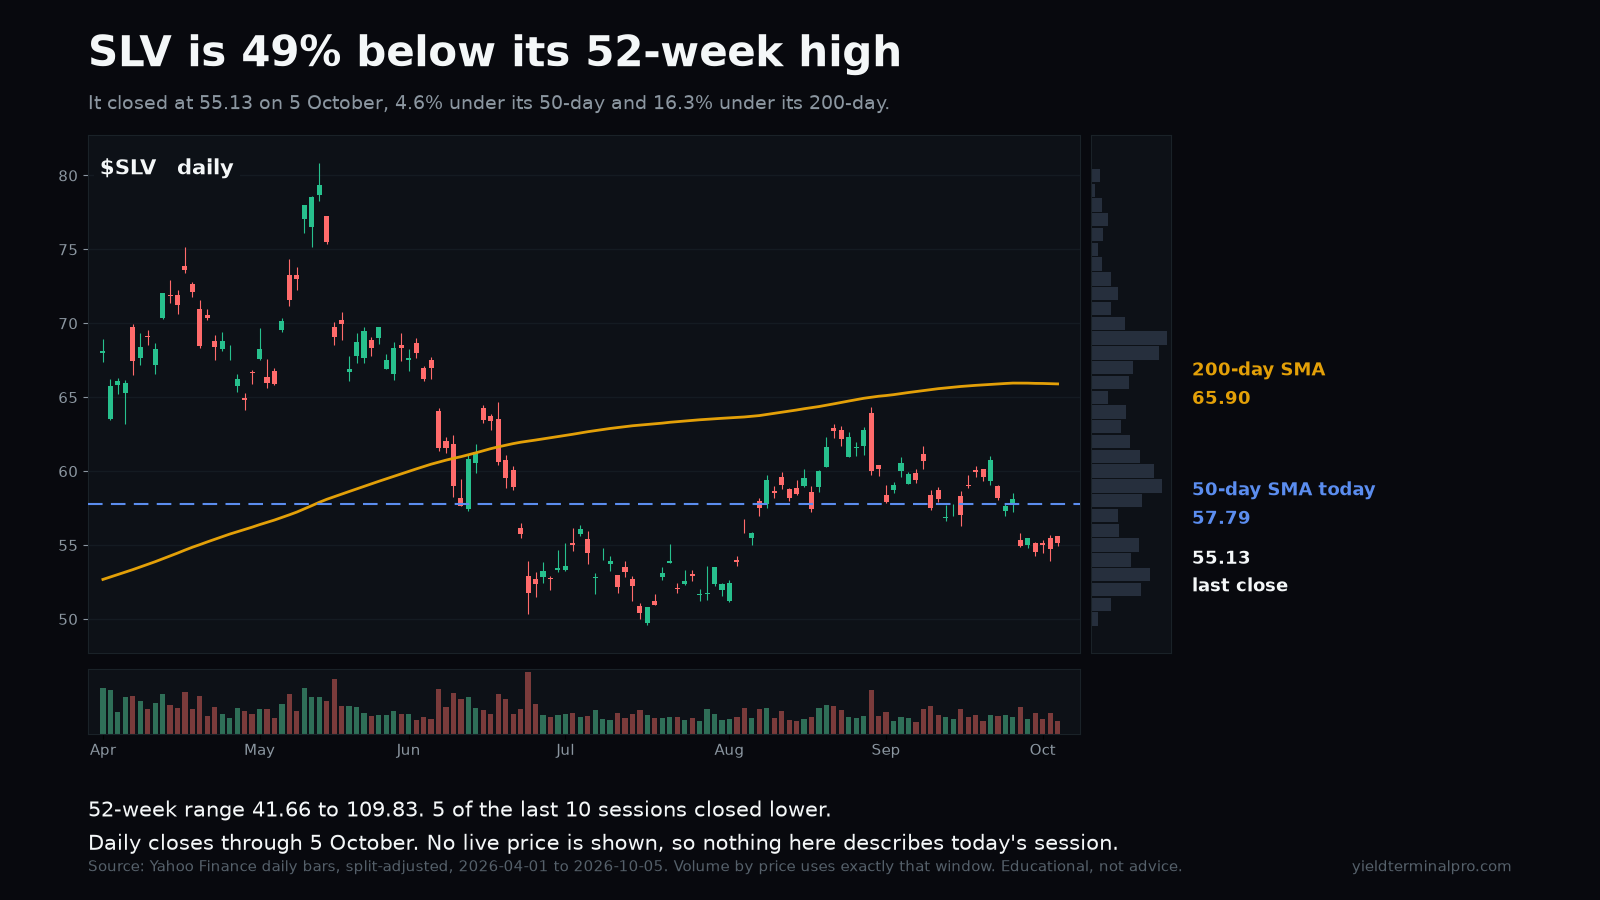
$SLViShares Silver Trust
55.13close, 5 October

SLV closed at 55.13 on 5 October, 49% below its 52-week high and under both its averages.

close (5 Oct)A completed daily close, not a live price.
55.13
50-day simple moving averageComputed from daily closes through the 5 October session.
57.79
200-day simple moving averageComputed from daily closes through the 5 October session.
65.90
52-week high49% above the 5 October close.
109.83

Levels measured over daily closes through the 5 October session, with the 52-week range measured over the plotted window on the chart. A level measured over a different window can be a different number.

SLV chart

Get the week in one email

Every level we marked, and whether price reached it. Free, Sundays.

Subscribing signs you up for the free YieldTerminal Sunday recap, one email a week. Educational only, not financial advice. Unsubscribe any time.

See the full disclaimer.