← All daily levels

Daily Levels, Fri, 2 Oct 2026

Prices marked to the 1 October close unless stated. Bitcoin and Super Micro are intraday prices taken on 2 October with their daily bars still open.

Educational commentary, not investment advice.

Seven charts, one claim each. Five of them exist because checking a level against the bars contradicted the first draft: Qualcomm's "first level above" turned out to be the fourth, Bitcoin had been above its 200-day for six weeks rather than reclaiming it, Netflix had closed above its 200-day twice rather than never, a line drawn on a circulated Super Micro chart put the 8 September high three dollars above where it actually was, and a SoFi post's weekly 200-day average was stated near 20.40 when the real weekly closes put it at 13.08.

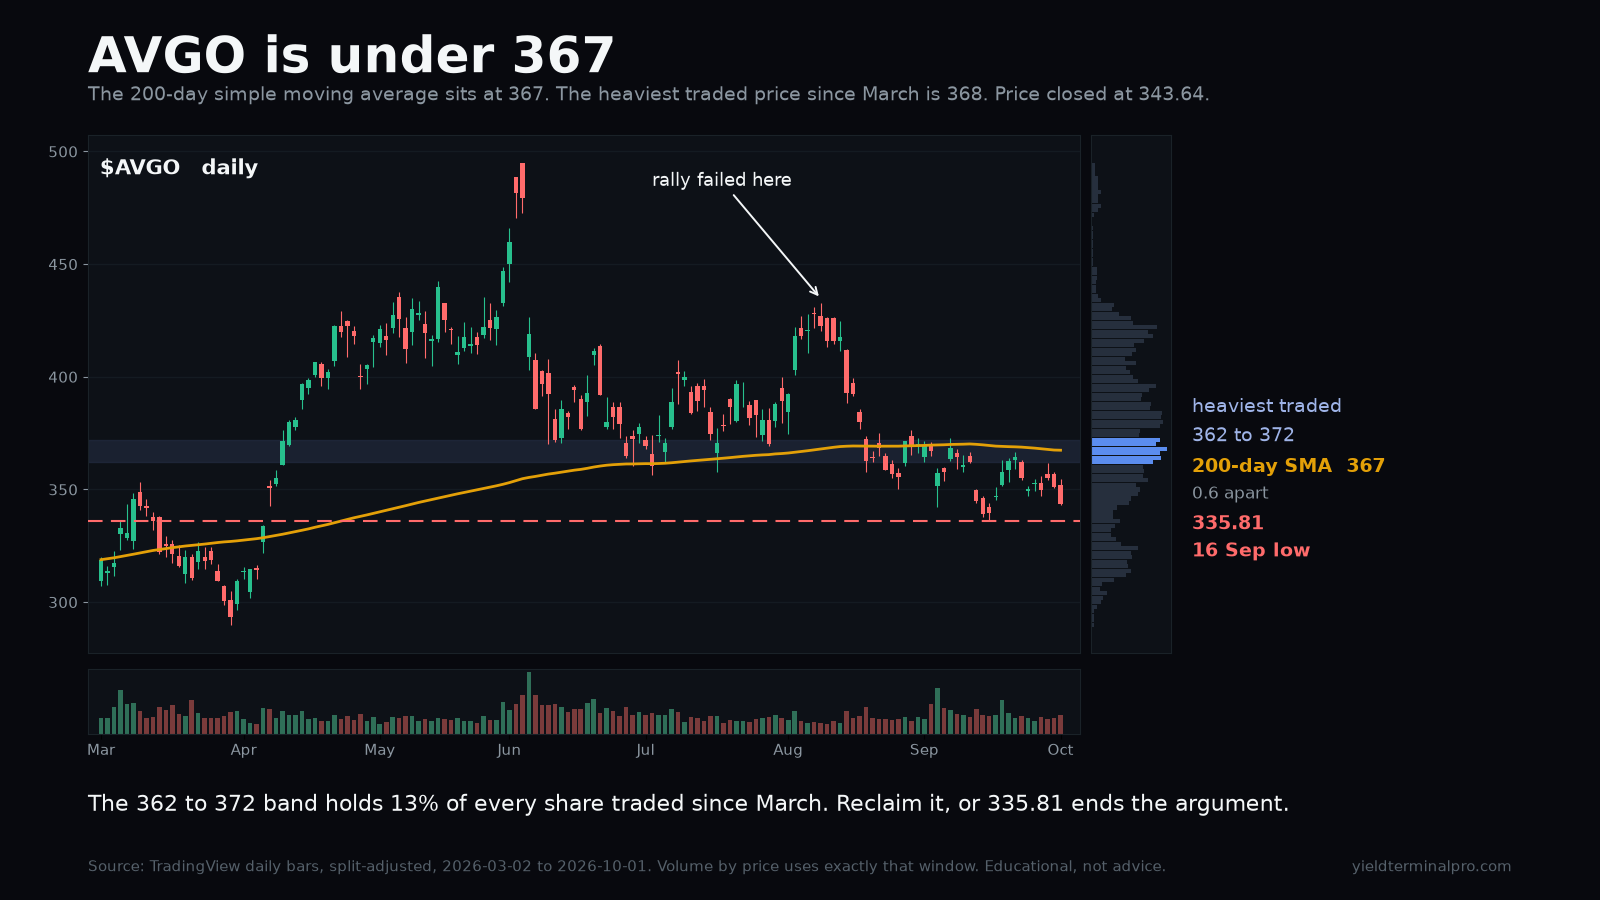
$AVGOBroadcom Inc.
343.641 Oct close

Two unrelated methods land on the same price. The 200-day simple moving average is 367 and the heaviest traded price since March is 368, 0.6 apart, and Broadcom closed under both.

Heaviest traded band13% of the window's volume
362.00 to 372.00
200-day simple moving average
367.42
16 September lowthe level that ends the argument
335.81

Levels measured over 2 March to 1 October 2026. A level measured over a different window can be a different number.
AVGO chartSee the chart on X →
$QCOMQUALCOMM Incorporated
182.091 Oct close

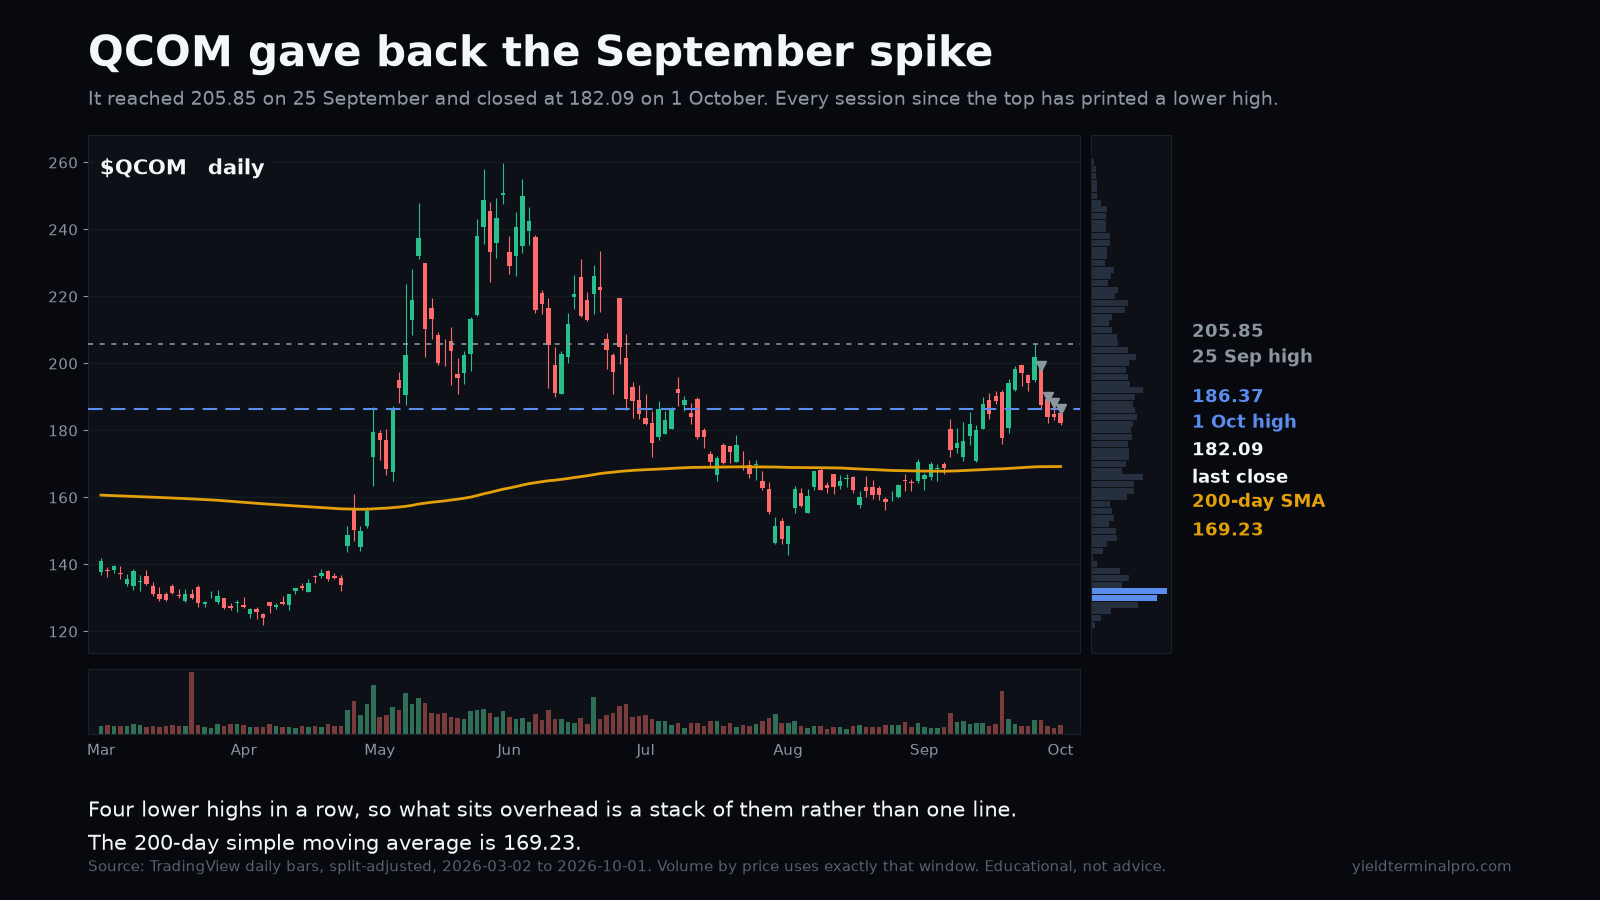
Qualcomm gave back the September spike in four sessions, and every one of them printed a lower high. What sits overhead is a stack of highs, not a single line to clear.

25 September highthe top
205.85
1 October highthe first level overhead
186.37
200-day simple moving average
169.23

Levels measured over 2 March to 1 October 2026. A level measured over a different window can be a different number.

QCOM chartSee the chart on X →
$ASTSAST SpaceMobile, Inc.
57.041 Oct close

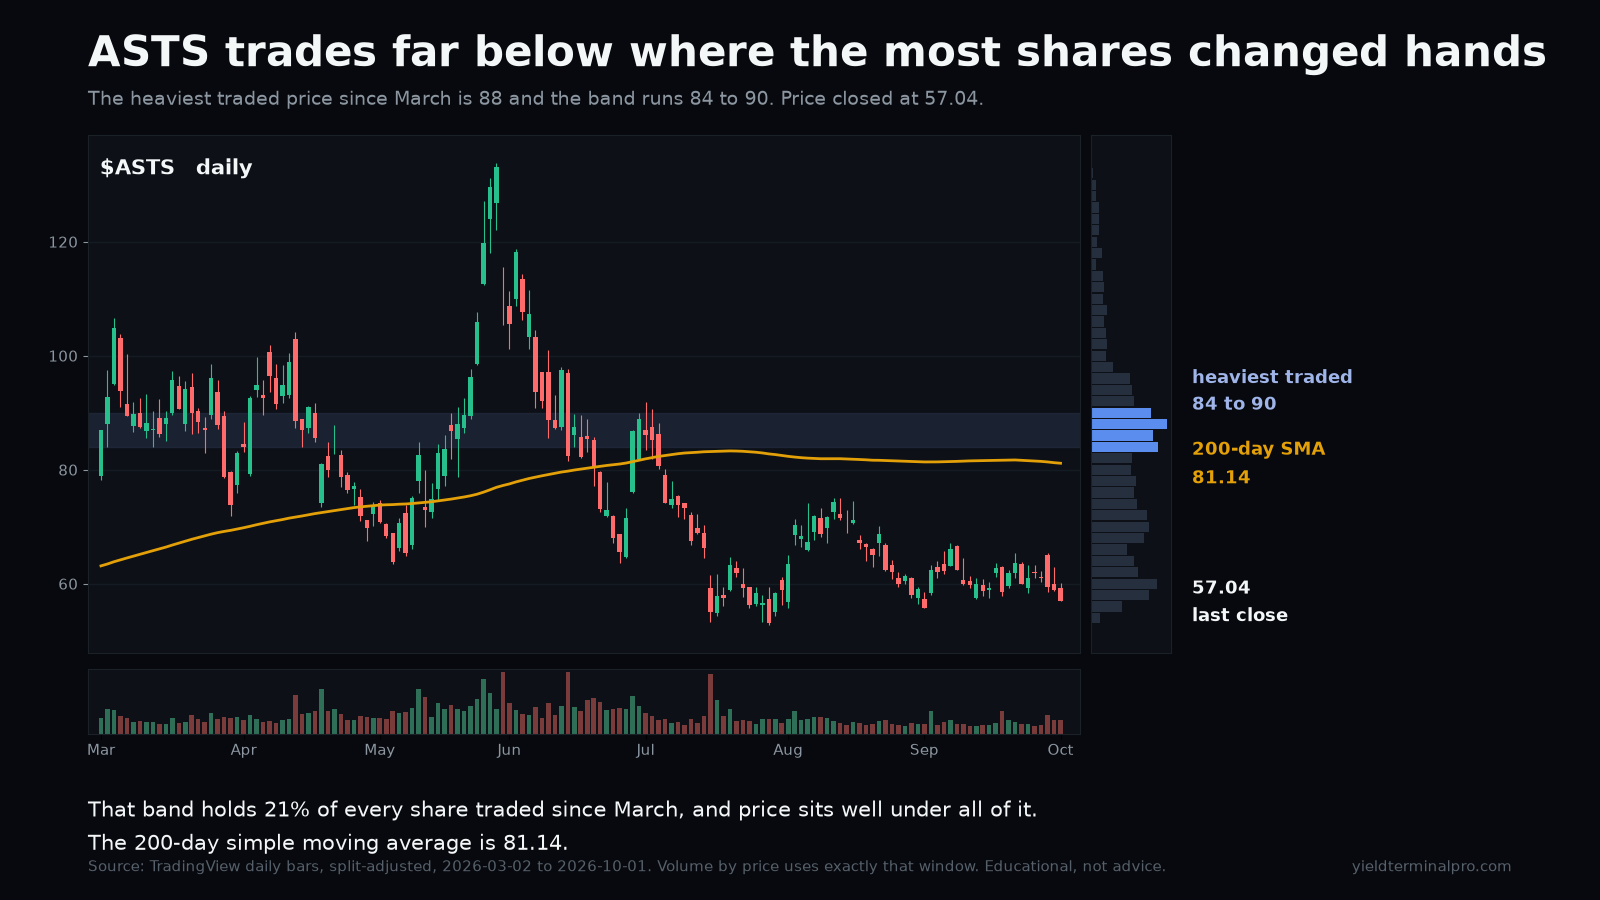
Every share that changed hands in the heaviest zone since March is above the current price. There is no comparable volume beneath it.

Heaviest traded band21% of the window's volume, all above price
84.00 to 90.00
200-day simple moving average
81.14

Levels measured over 2 March to 1 October 2026. A level measured over a different window can be a different number.

ASTS chartSee the chart on X →
BTCBitcoin
86,526live price, daily bar still open

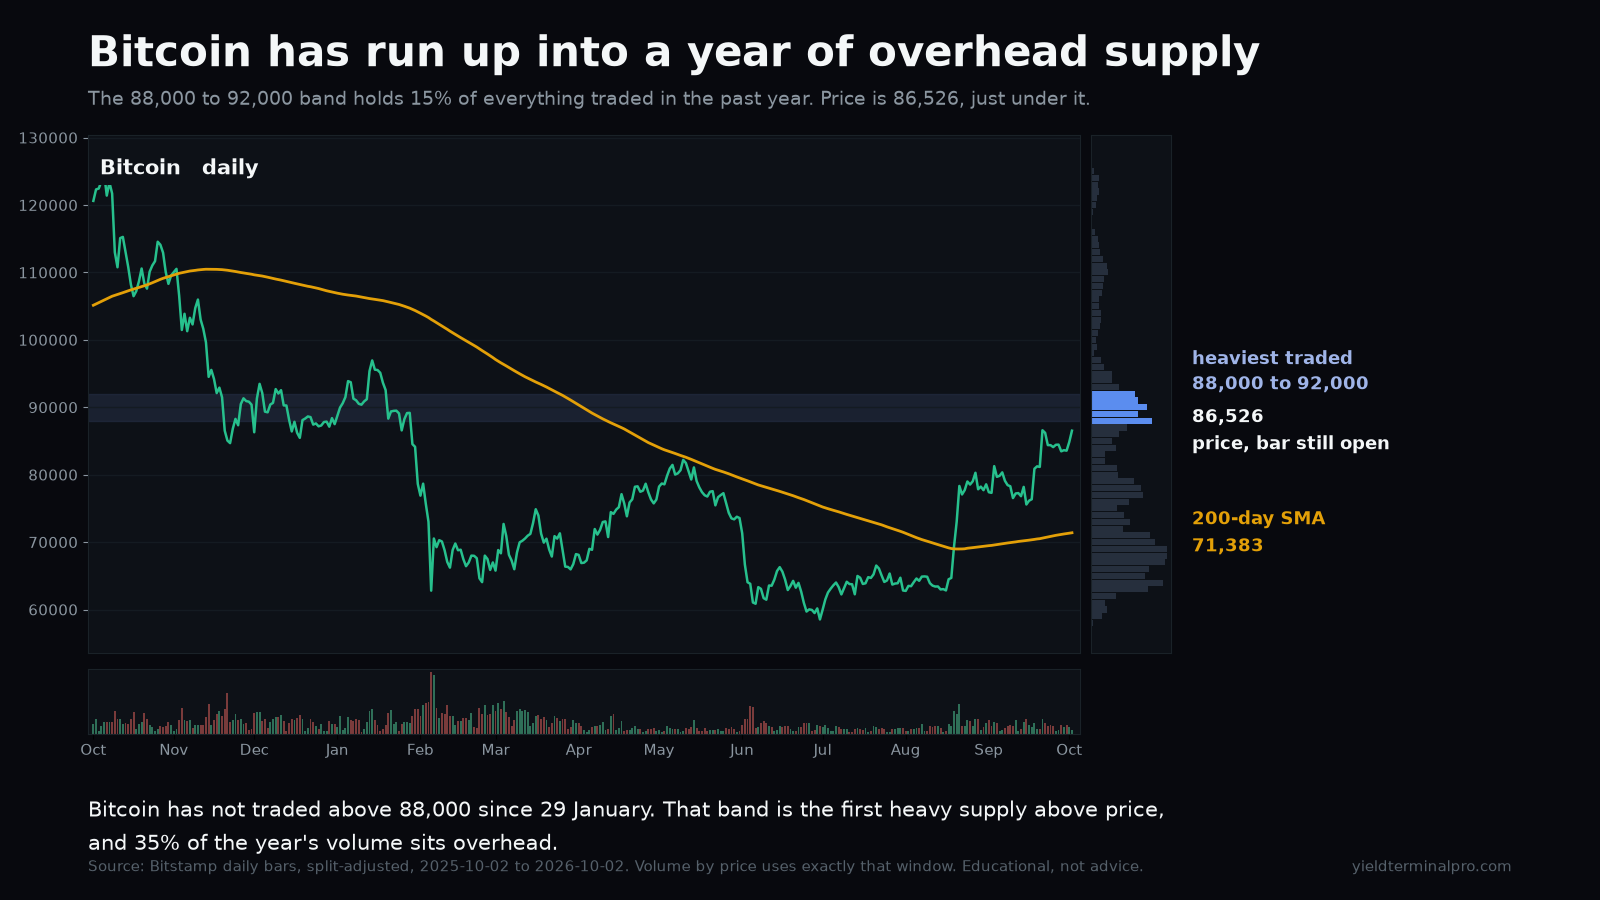
Bitcoin has run up to the underside of the heaviest band of volume in a year. It has not traded above 88,000 since 29 January, and 35% of the year's volume sits above the current price.

Heaviest band above price15% of the year's volume
88,000 to 92,000
200-day simple moving averagelast close below it was 18 August
71,383
October 2025 high
126,272

Levels measured over 2 October 2025 to 2 October 2026, Bitstamp. A level measured over a different window can be a different number.

BTC chartSee the chart on X →
$NFLXNetflix, Inc.
67.851 Oct close

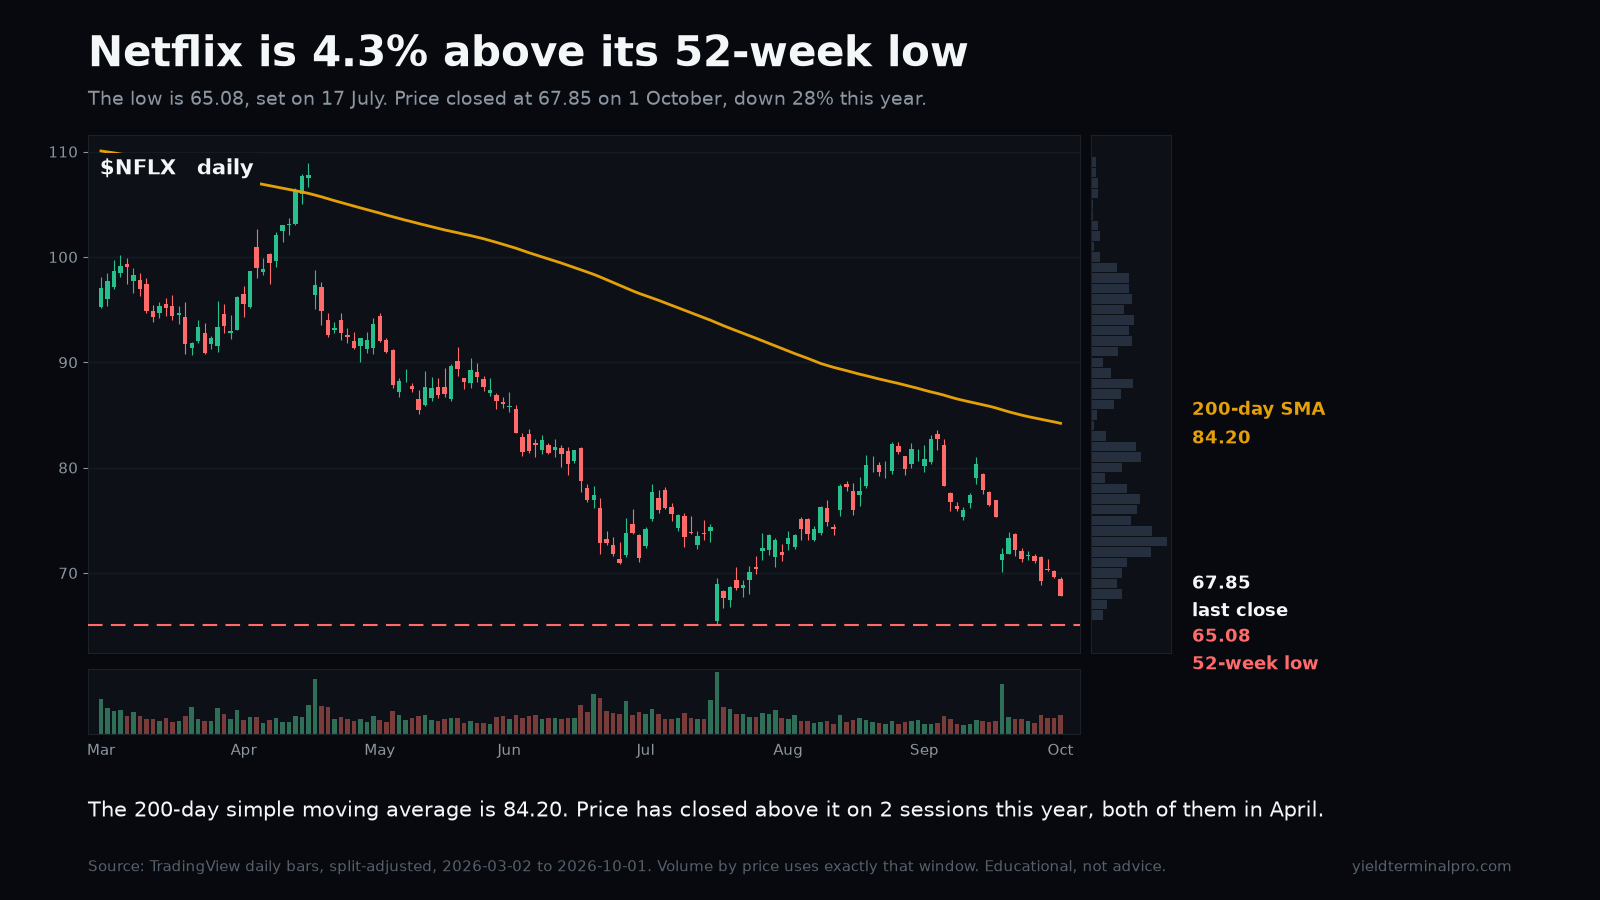
The 200-day now sits above every high of the last 30 sessions, which makes the lift off July's low a move inside the downtrend rather than out of it.

200-day simple moving averageprice closed above it on 2 of 188 sessions this year, both in April
84.20
Highest high, last 30 sessionsbelow the 200-day
83.60
52-week lowset 17 July; price is 4.3% above it
65.08

Levels measured over 2 March to 1 October 2026. A level measured over a different window can be a different number.

NFLX chartSee the chart on X →
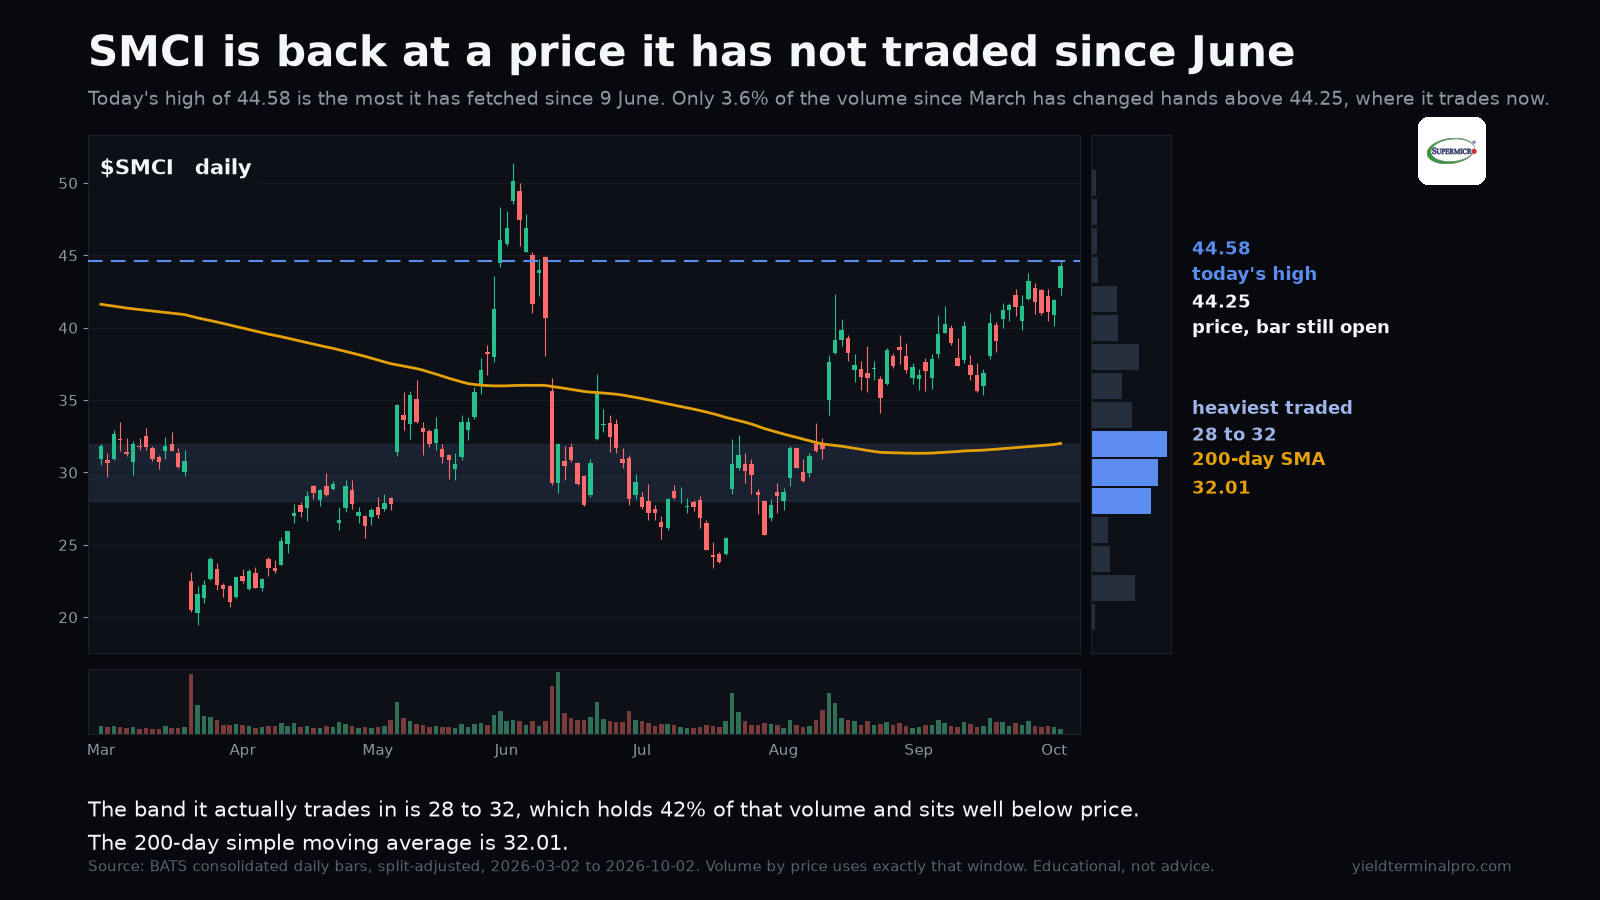
$SMCISuper Micro Computer, Inc.
44.25intraday 2 Oct, daily bar still open

Today's high of 44.58 is the most Super Micro has fetched since 9 June, and it has climbed clear of its own volume base. Only 3.6% of the volume since March has changed hands above where it trades now, while the heaviest band, 28 to 32, holds 42% of it and sits roughly twelve points below.

Today's highhighest since 9 June 2026; rounded down from 44.585
44.58
Heaviest traded band42% of the window's volume, all of it below price
28.00 to 32.00
200-day simple moving averageprice is roughly 38% above it
32.01
8 September highthe level mislabelled as 44.53 on the circulated screenshot
41.53

Levels measured over 2 March to 2 October 2026. A level measured over a different window can be a different number.

SMCI chartSee the chart on X →
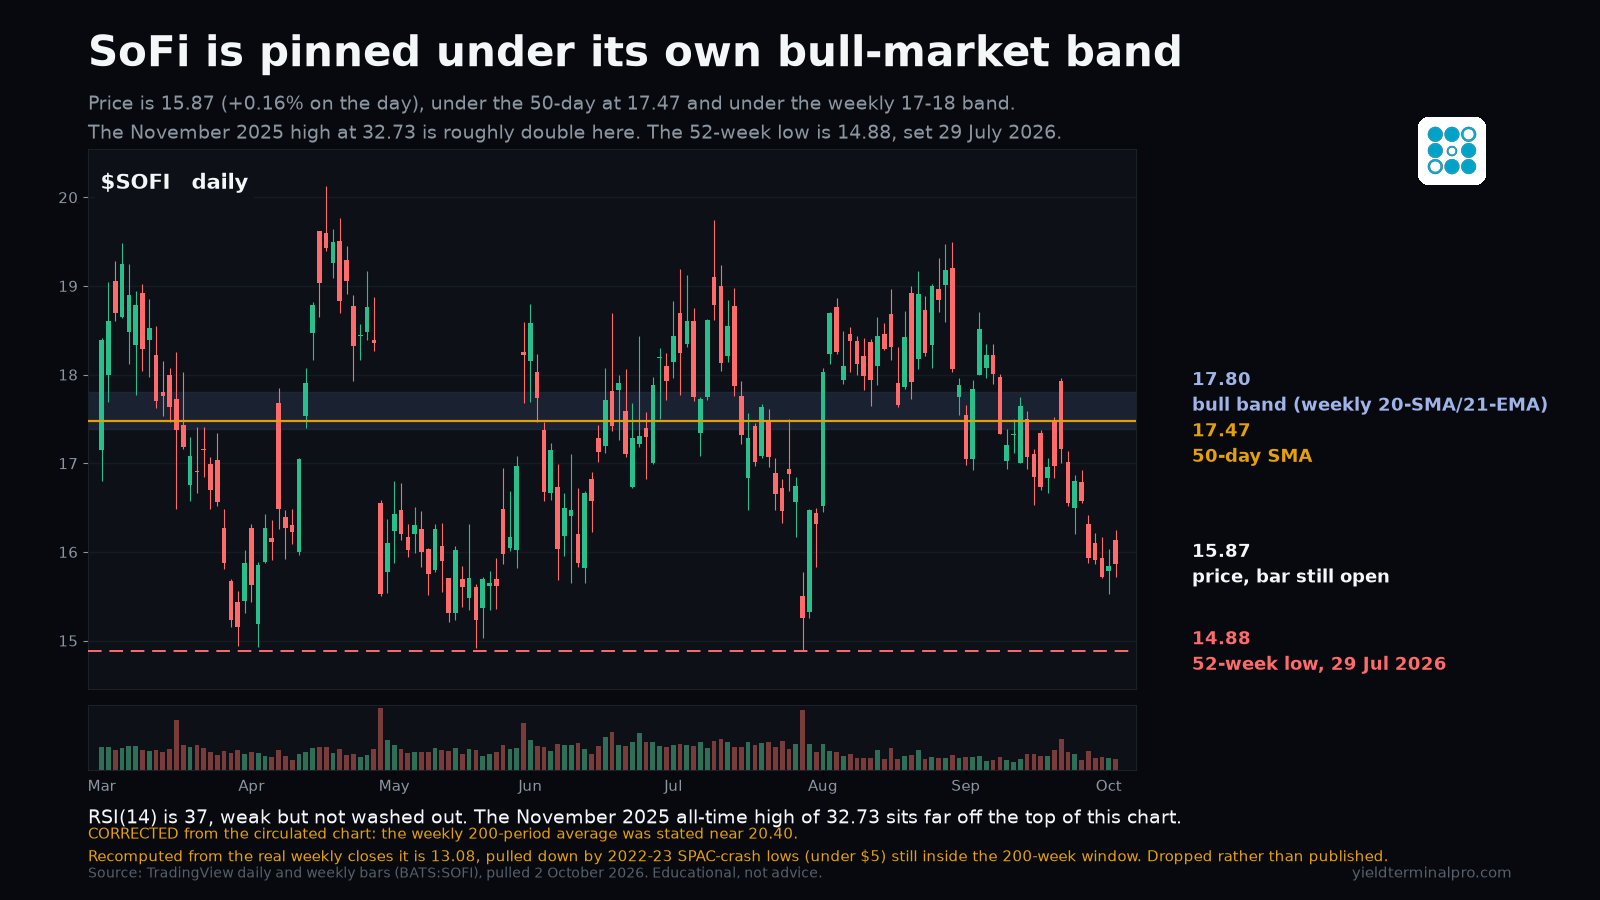
$SOFISoFi Technologies, Inc.
15.87intraday 2 Oct, daily bar still open

SoFi trades under every average that matters: the 50-day at 17.47, the weekly bull-market band of 17.38 to 17.80, and the November 2025 high of 32.73 sits roughly double the current price. The 52-week low is 14.88, set 29 July 2026.

50-day simple moving averageprice is roughly 9% below it
17.47
Weekly bull-market band20-week SMA to 21-week EMA, generic indicator
17.38 to 17.80
52-week lowset 29 July 2026
14.88
November 2025 all-time highset 12 November 2025; roughly double the current price
32.73

Levels measured over 2 March to 2 October 2026 daily; 2021 to present weekly for the bull-market band. A level measured over a different window can be a different number.

SOFI chartSee the chart on X →

Get the week in one email

Every level we marked, and whether price reached it. Free, Sundays.

Subscribing signs you up for the free YieldTerminal Sunday recap, one email a week. Educational only, not financial advice. Unsubscribe any time.

See the full disclaimer.