← All daily levelsDaily Levels, Mon, 5 Oct 2026
Two moments on 5 October 2026, both measured against the 2 October close. The five risers are premarket prints frozen at 09:00 ET. The five fallers were picked on that same premarket screen and then repriced live at 09:56 ET, after the open. Live quotes throughout, not delayed.
Educational commentary, not investment advice.
The five widest premarket gainers and the five widest premarket decliners among the 159 names on our $10bn-plus US watchlist that printed premarket. The risers are shown at their 09:00 ET premarket marks. The fallers are the same five names repriced at 09:56 ET once the market was open, so they are not a fresh screen of the day's widest fallers. Premarket is thin: a print is not a session.
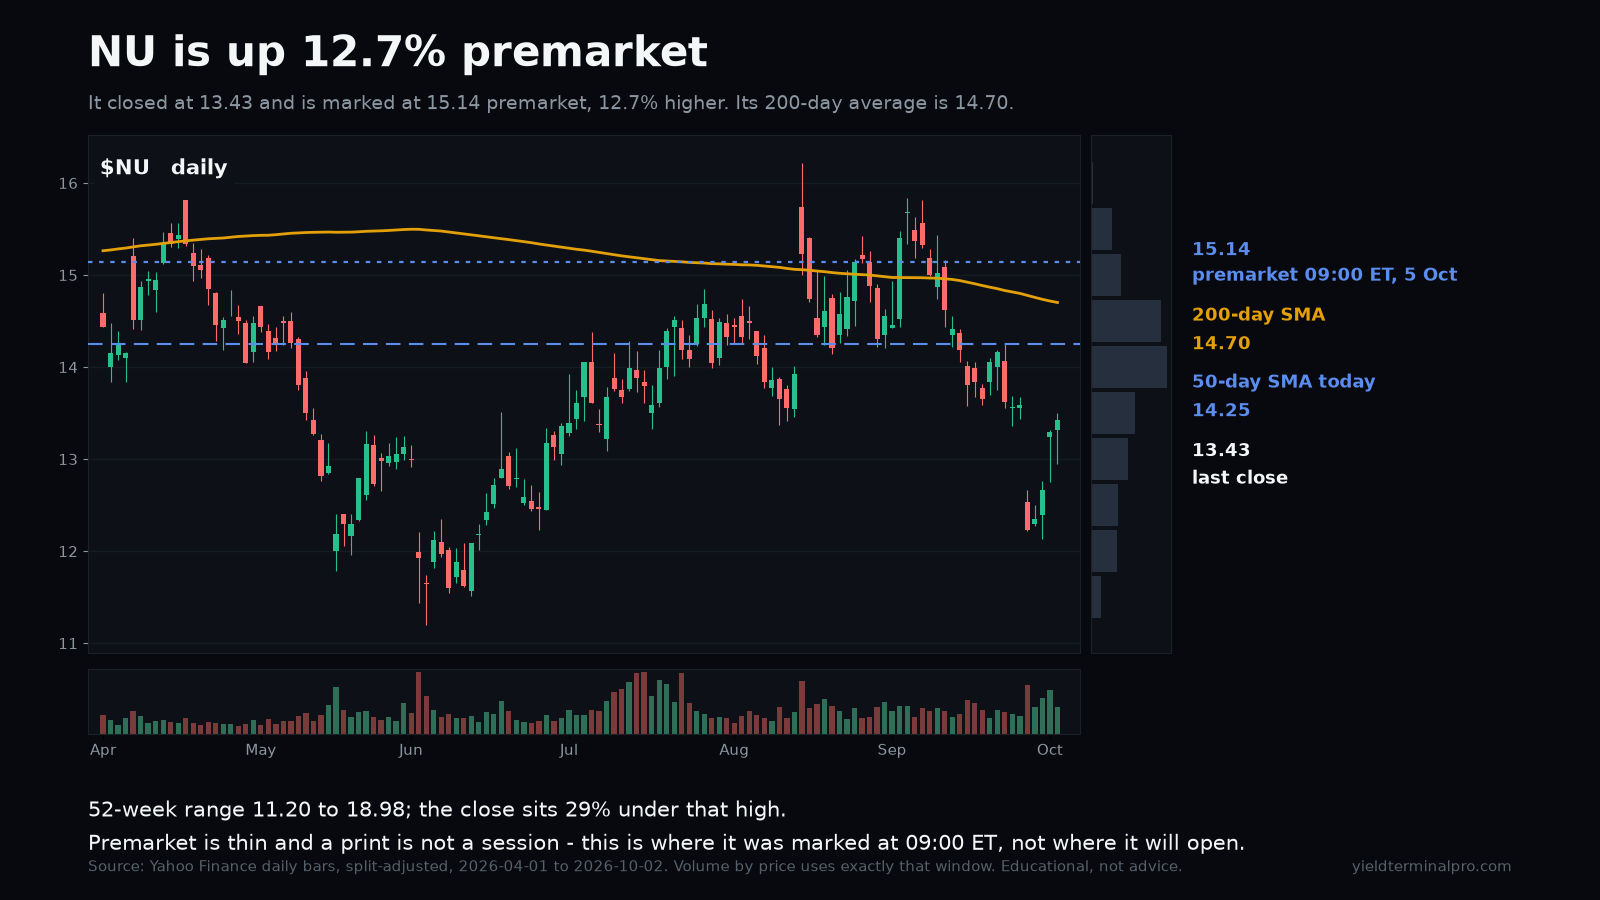
NU is 12.7% higher premarket, marked at 15.14 against a 13.43 close.
- premarket markLive print at 09:00 ET, not an opening price.
- 15.14
- prior close (2 Oct)The close the premarket move is measured against.
- 13.43
Levels measured over the premarket snapshot taken at 09:00 ET on 5 October 2026 and frozen, with the chart behind it showing daily closes through the 2 October session. A level measured over a different window can be a different number.
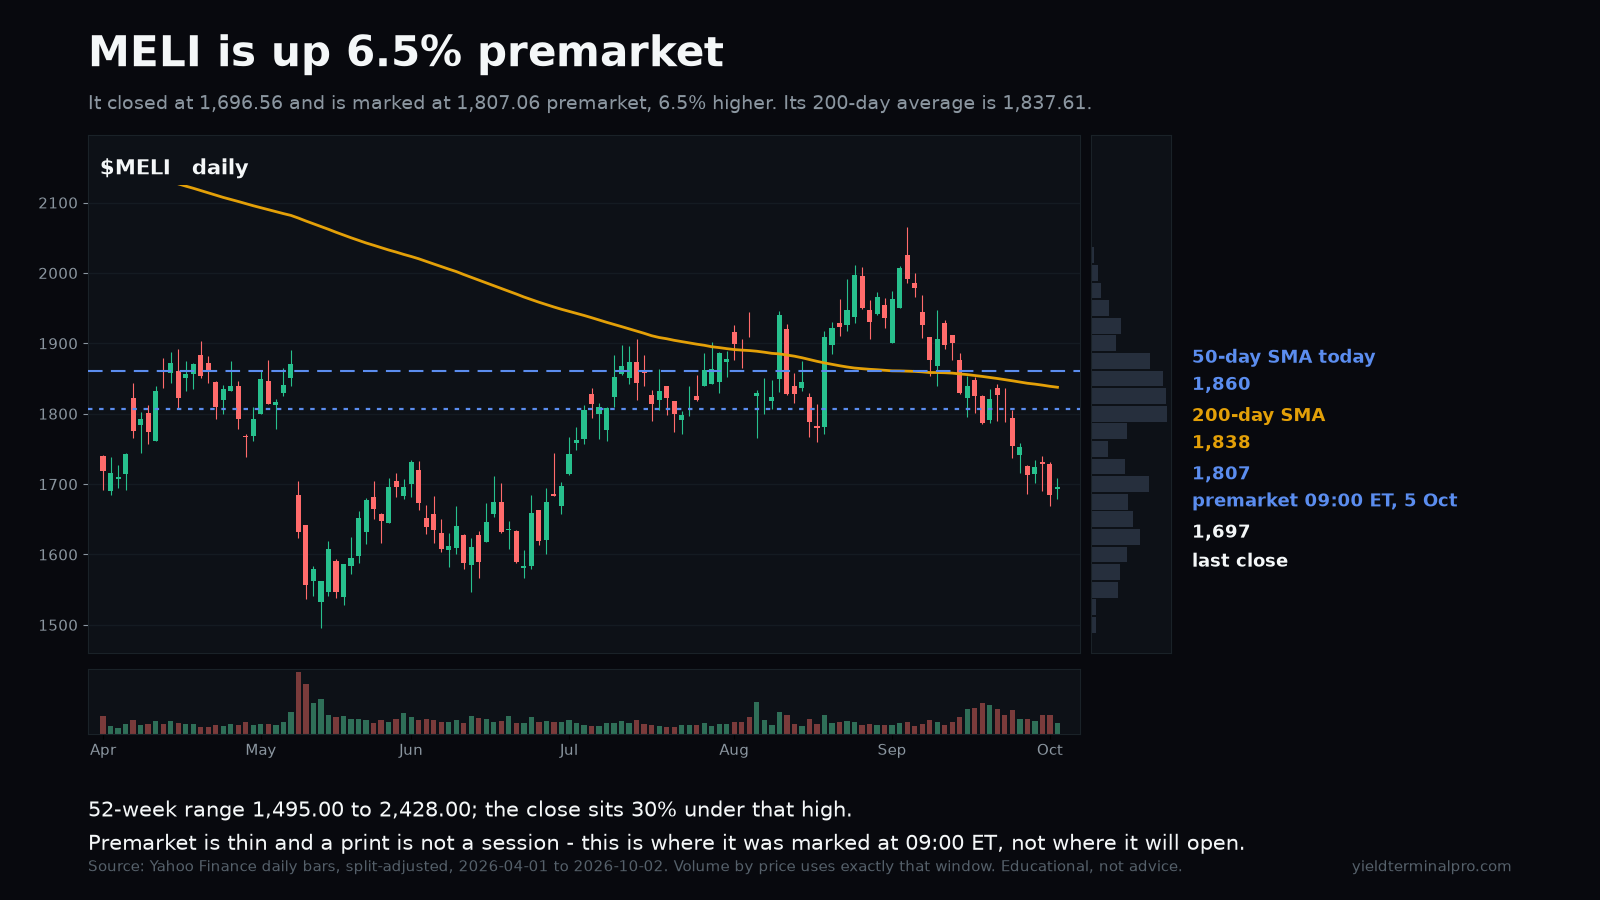
$MELIMercadoLibre, Inc.
1,807.06premarket print, 09:00 ETMELI is 6.5% higher premarket, marked at 1,807.06 against a 1,696.56 close.
- premarket markLive print at 09:00 ET, not an opening price.
- 1,807.06
- prior close (2 Oct)The close the premarket move is measured against.
- 1,696.56
Levels measured over the premarket snapshot taken at 09:00 ET on 5 October 2026 and frozen, with the chart behind it showing daily closes through the 2 October session. A level measured over a different window can be a different number.
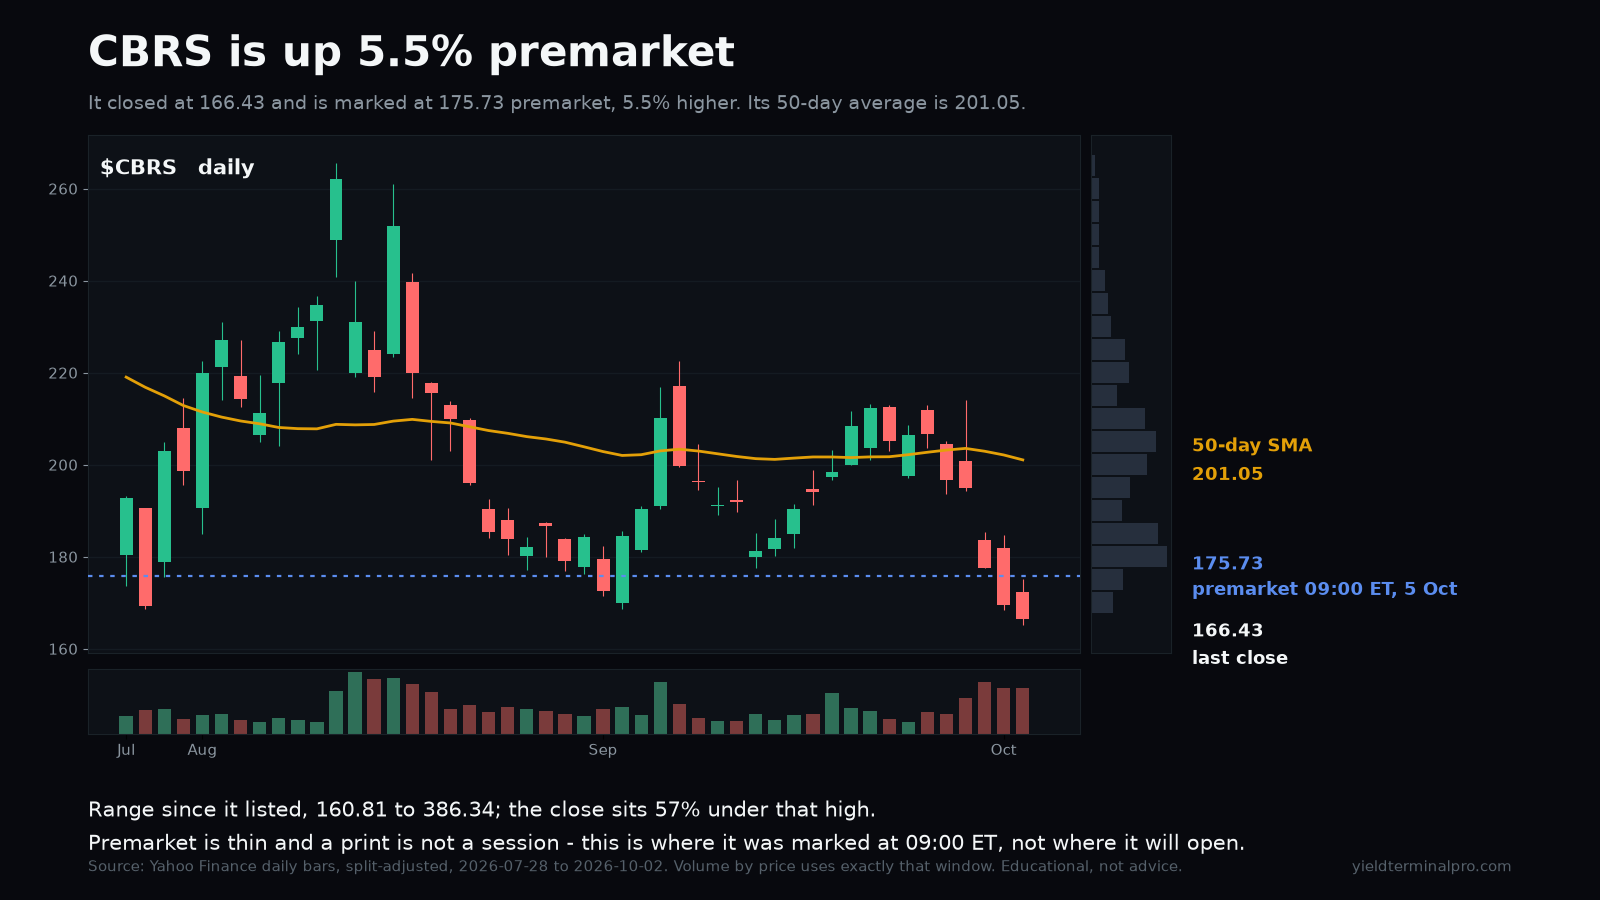
CBRS is 5.5% higher premarket, marked at 175.73 against a 166.43 close.
- premarket markLive print at 09:00 ET, not an opening price.
- 175.73
- prior close (2 Oct)The close the premarket move is measured against.
- 166.43
Levels measured over the premarket snapshot taken at 09:00 ET on 5 October 2026 and frozen, with the chart behind it showing daily closes through the 2 October session. A level measured over a different window can be a different number.
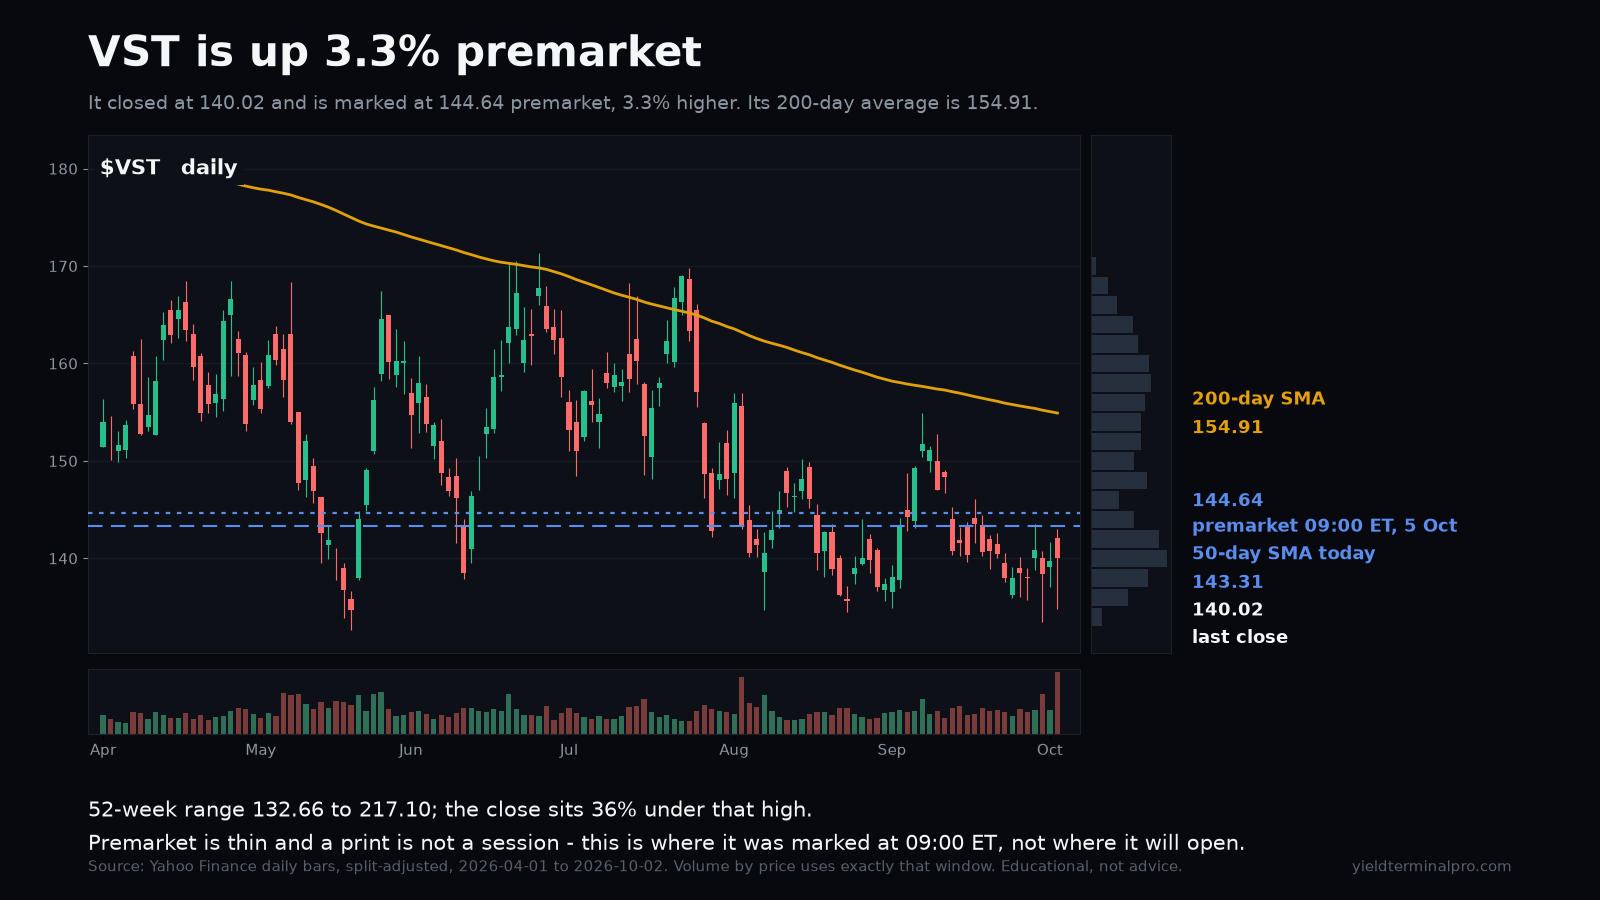
$VSTVistra Corp.
144.64premarket print, 09:00 ETVST is 3.3% higher premarket, marked at 144.64 against a 140.02 close.
- premarket markLive print at 09:00 ET, not an opening price.
- 144.64
- prior close (2 Oct)The close the premarket move is measured against.
- 140.02
Levels measured over the premarket snapshot taken at 09:00 ET on 5 October 2026 and frozen, with the chart behind it showing daily closes through the 2 October session. A level measured over a different window can be a different number.
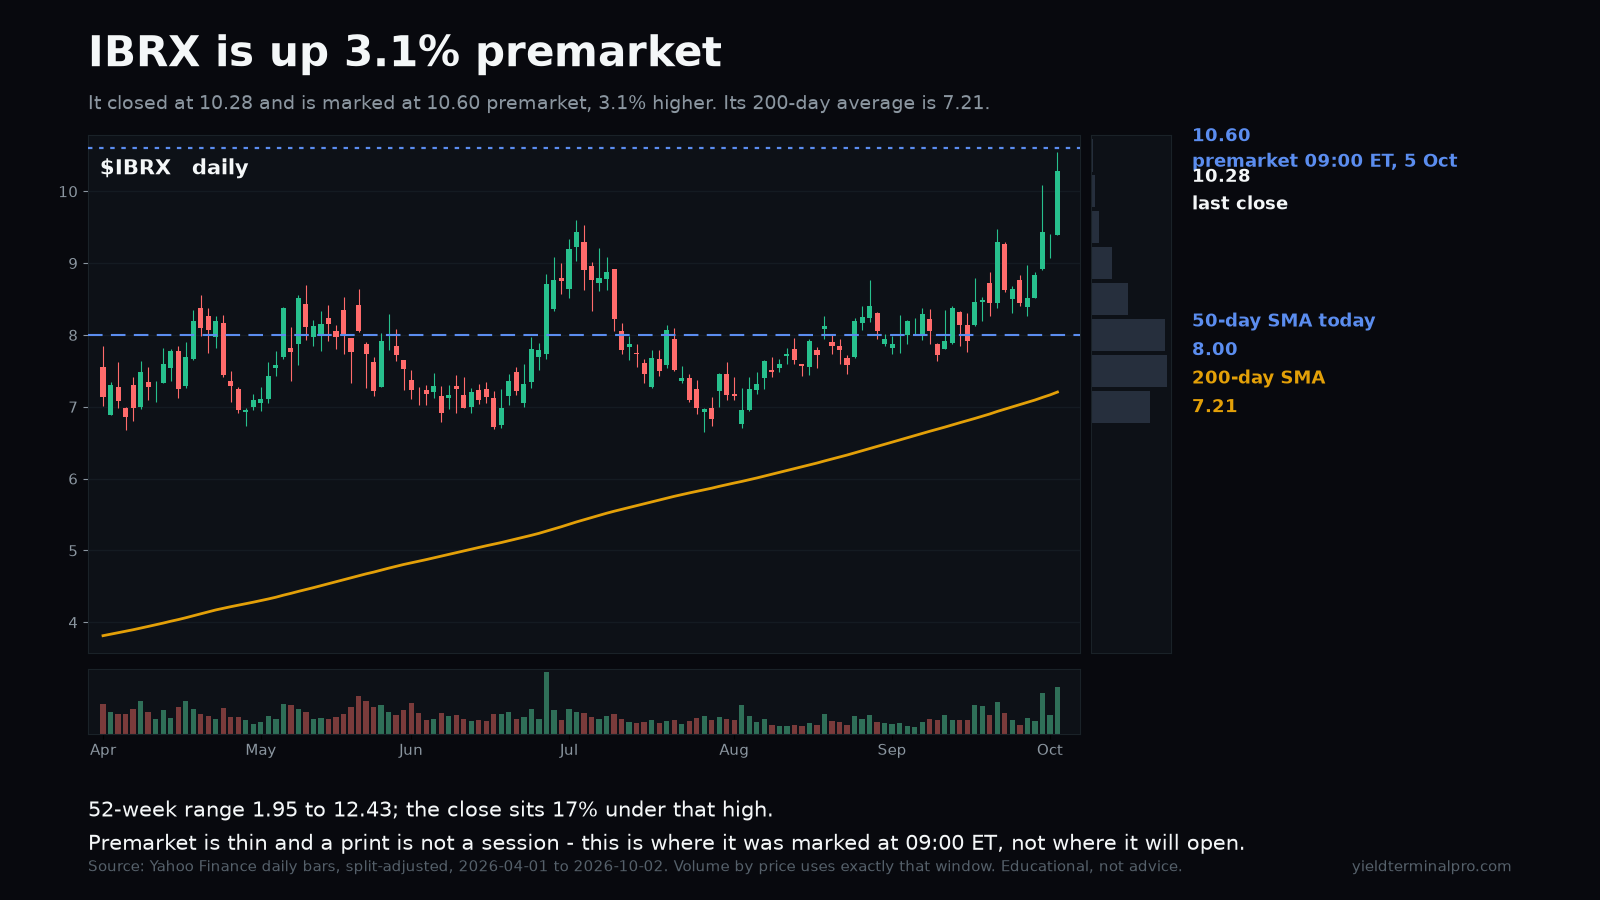
$IBRXImmunityBio Inc
10.60premarket print, 09:00 ETIBRX is 3.0% higher premarket, marked at 10.60 against a 10.29 close.
- premarket markLive print at 09:00 ET, not an opening price.
- 10.60
- prior close (2 Oct)The close the premarket move is measured against.
- 10.29
Levels measured over the premarket snapshot taken at 09:00 ET on 5 October 2026 and frozen, with the chart behind it showing daily closes through the 2 October session. A level measured over a different window can be a different number.
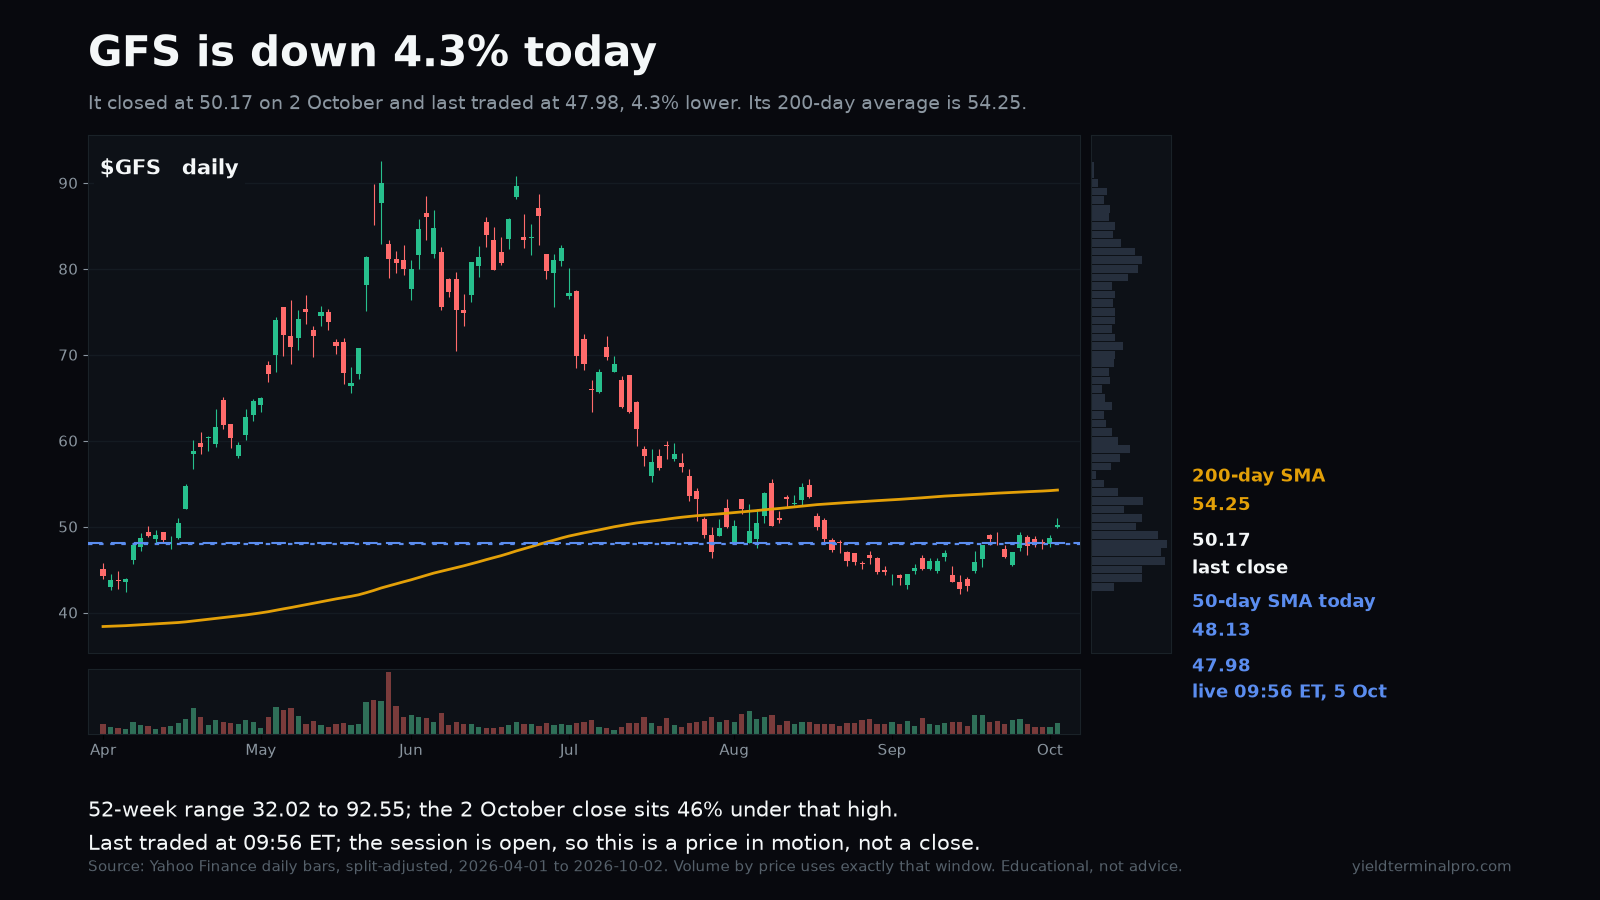
$GFSGlobalFoundries Inc.
47.98last trade, 09:56 ETGFS is 4.3% lower in the session, last traded at 47.98 against a 50.17 close on 2 October.
- last trade (09:56 ET)A price in motion while the session is open, not a close.
- 47.98
- prior close (2 Oct)The close the day's move is measured against.
- 50.17
Levels measured over a live regular-session price read at 09:56 ET on 5 October 2026, with the chart behind it showing daily closes through the 2 October session. A level measured over a different window can be a different number.
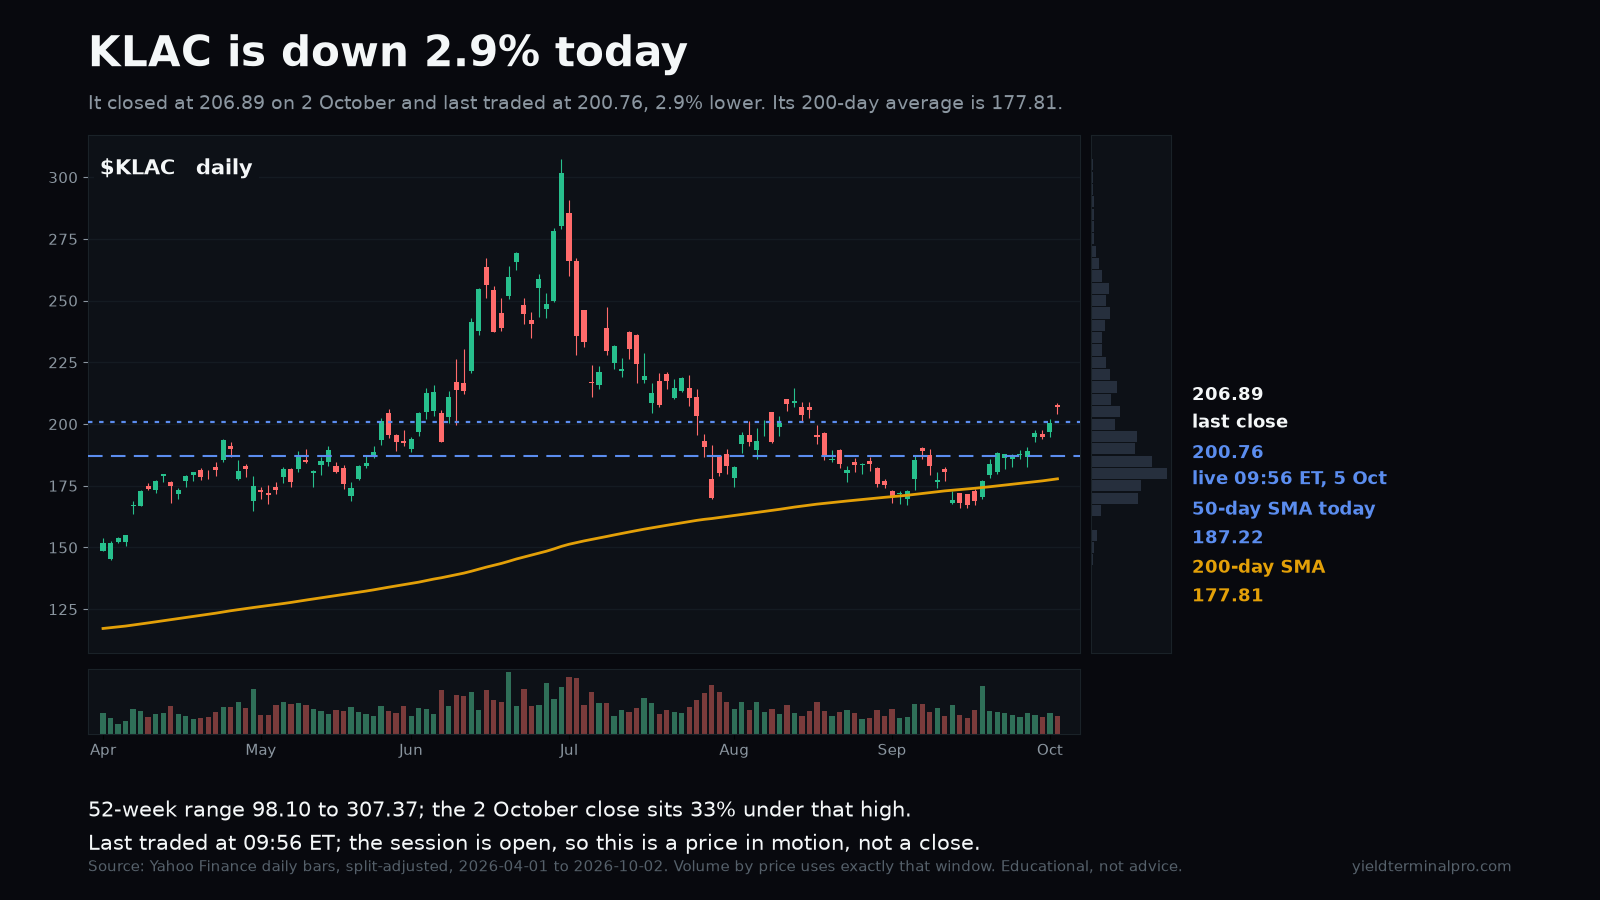
$KLACKLA Corporation
200.76last trade, 09:56 ETKLAC is 2.9% lower in the session, last traded at 200.76 against a 206.89 close on 2 October.
- last trade (09:56 ET)A price in motion while the session is open, not a close.
- 200.76
- prior close (2 Oct)The close the day's move is measured against.
- 206.89
Levels measured over a live regular-session price read at 09:56 ET on 5 October 2026, with the chart behind it showing daily closes through the 2 October session. A level measured over a different window can be a different number.
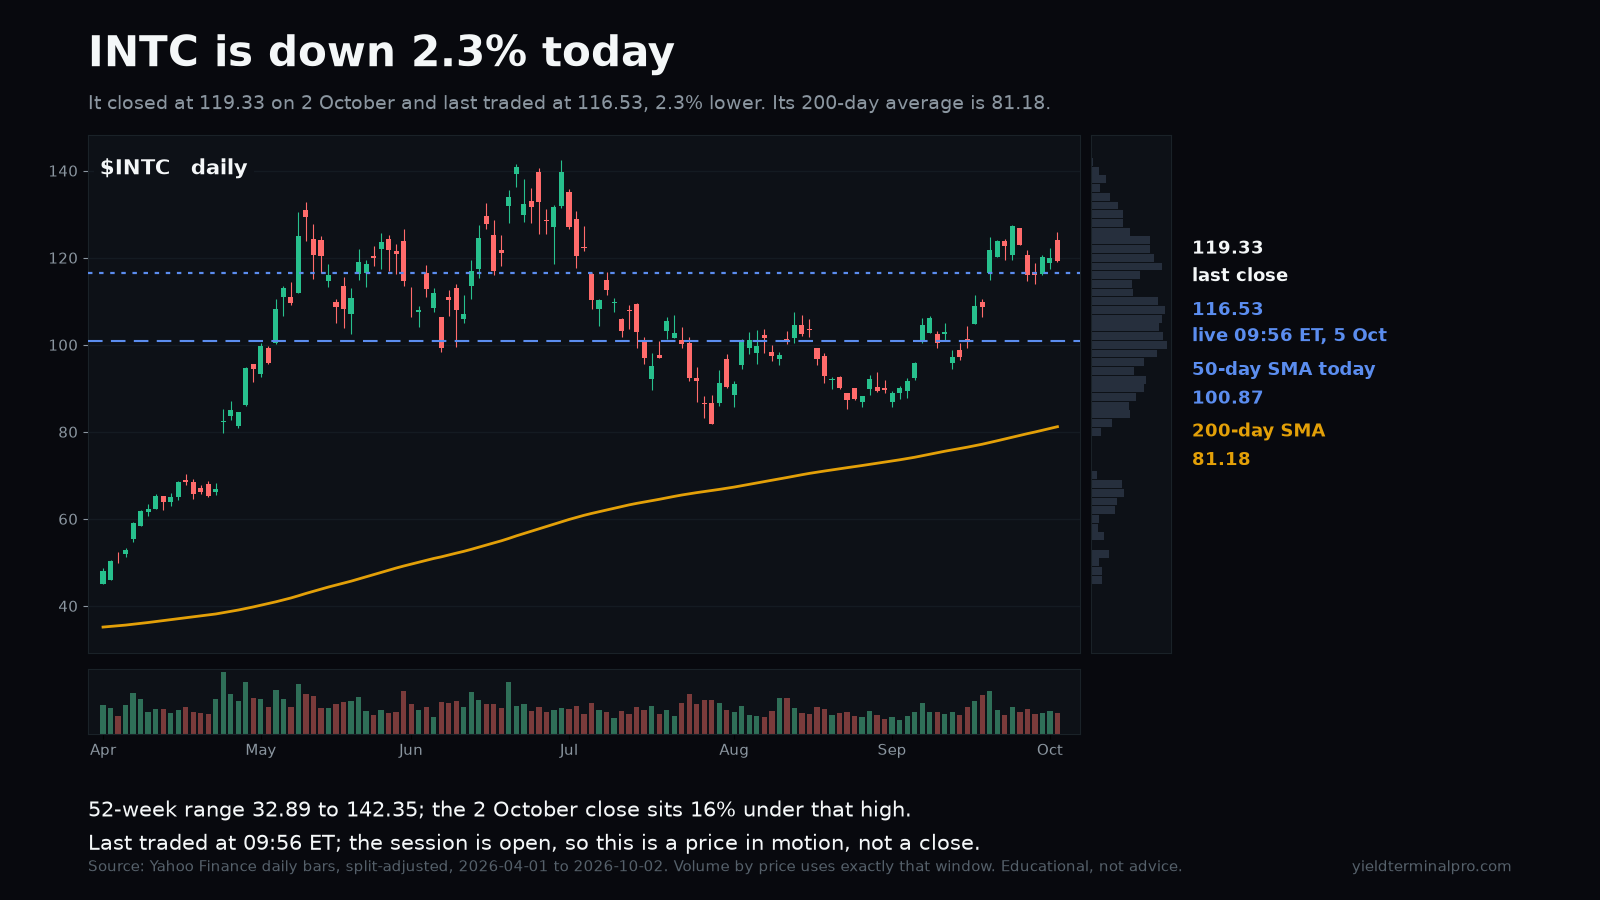
$INTCIntel Corporation
116.53last trade, 09:56 ETINTC is 2.3% lower in the session, last traded at 116.53 against a 119.33 close on 2 October.
- last trade (09:56 ET)A price in motion while the session is open, not a close.
- 116.53
- prior close (2 Oct)The close the day's move is measured against.
- 119.33
Levels measured over a live regular-session price read at 09:56 ET on 5 October 2026, with the chart behind it showing daily closes through the 2 October session. A level measured over a different window can be a different number.
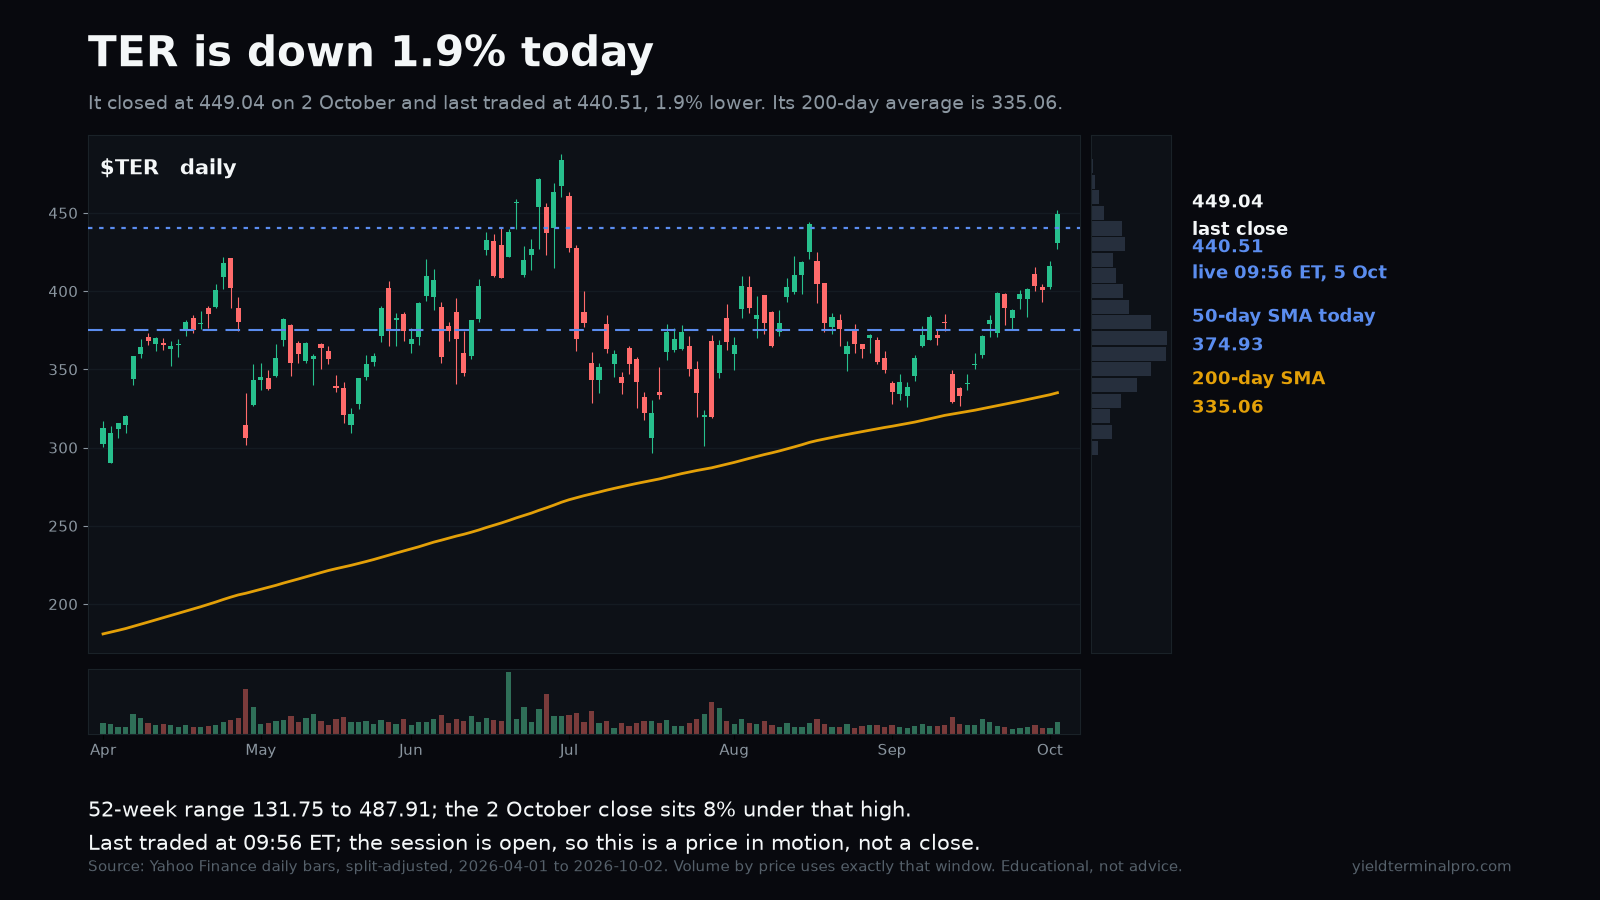
$TERTeradyne, Inc.
440.51last trade, 09:56 ETTER is 1.9% lower in the session, last traded at 440.51 against a 449.04 close on 2 October.
- last trade (09:56 ET)A price in motion while the session is open, not a close.
- 440.51
- prior close (2 Oct)The close the day's move is measured against.
- 449.04
Levels measured over a live regular-session price read at 09:56 ET on 5 October 2026, with the chart behind it showing daily closes through the 2 October session. A level measured over a different window can be a different number.
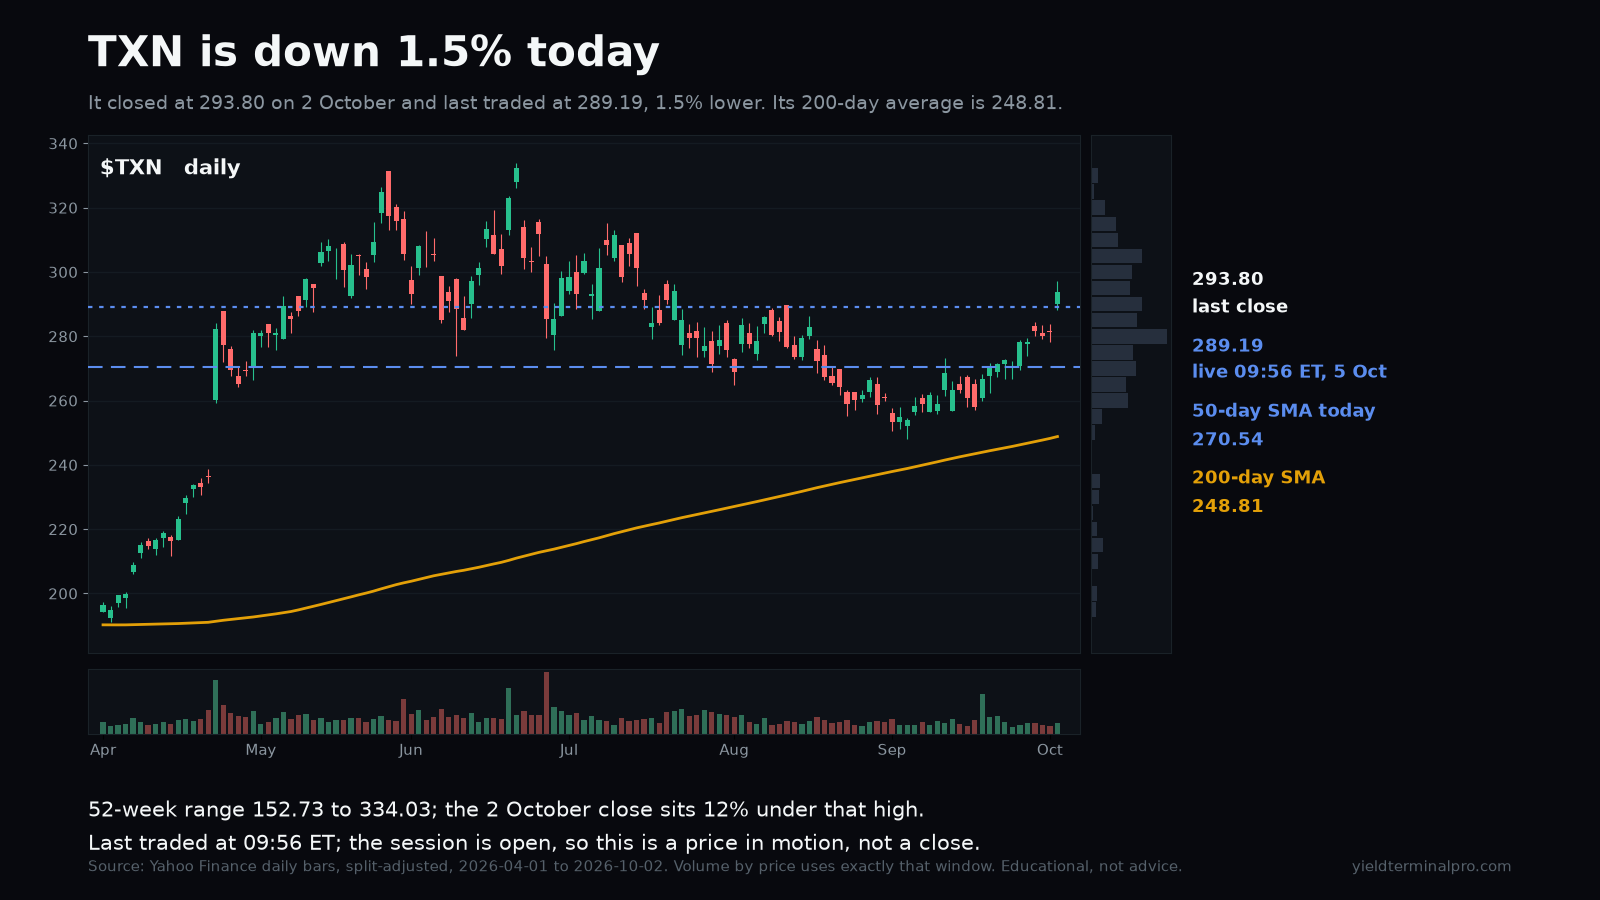
TXN is 1.5% lower in the session, last traded at 289.19 against a 293.80 close on 2 October.
- last trade (09:56 ET)A price in motion while the session is open, not a close.
- 289.19
- prior close (2 Oct)The close the day's move is measured against.
- 293.80
Levels measured over a live regular-session price read at 09:56 ET on 5 October 2026, with the chart behind it showing daily closes through the 2 October session. A level measured over a different window can be a different number.
Get the week in one email
Every level we marked, and whether price reached it. Free, Sundays.
Subscribing signs you up for the free YieldTerminal Sunday recap, one email a week. Educational only, not financial advice. Unsubscribe any time.