Mon, 19 Oct 2026
353.38 October 19 premarket Morning Watch edition
Premarket remains below the 50-, 20- and 200-session averages. October 21 after-close earnings remain upcoming.
No session has closed since this was published.

Tesla
Each note as it was published, with the price that followed. We publish where price sits against its own levels, not where it is going, so nothing here is scored as right or wrong. Educational commentary, not investment advice.
6 notes, newest first, back to Sat, 3 Oct 2026.
353.38 October 19 premarket Morning Watch edition
Premarket remains below the 50-, 20- and 200-session averages. October 21 after-close earnings remain upcoming.
No session has closed since this was published.
354.72 October 16 regular close
October 16 close $354.72 was below the 50-session SMA ($359.46) and below the 200-session SMA ($387.99). Earnings preview for October 19-23; historical levels do not bound an earnings gap.
No session has closed since this was published.

Study-universe context; not a new Saturday trade setup. Test the Theory, data through October 15, 2026.
No session has closed since this was published.

377.47 October 16 premarket - Morning Watch edition
The retained premarket mark is inside the October 13 daily gap. The observed premarket high and 200-session average are higher references, not guaranteed targets.
No session has closed since this was published.

354.72 October 16 regular close · After Close
TSLA — The premarket jump faded
No session has closed since this was published.

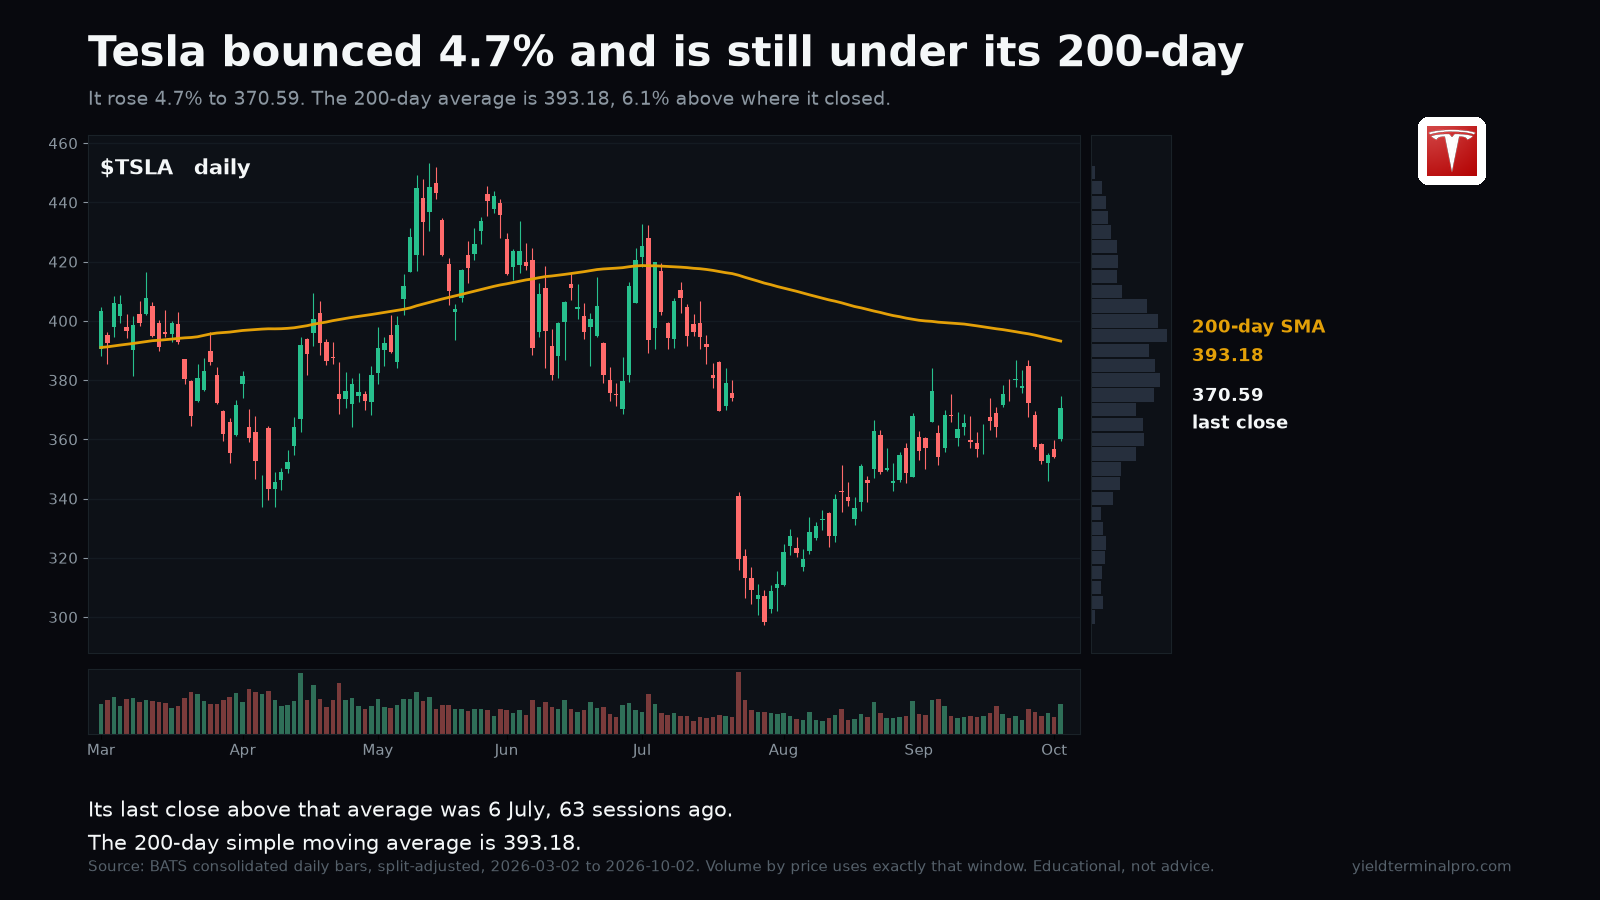
370.59 2 Oct close
Tesla rose 4.7% and is still under its 200-day average. Its last close above that line was 6 July, 63 sessions earlier, and it finished 6% short of it. Nearly three months under one line is a trend, not a dip.
| After | Close | vs Sat, 3 Oct 2026 close | vs published price |
|---|---|---|---|
| 1 session | 378.73 | — | +2.20% |
| 5 sessions | 382.70 | — | +3.27% |
Every level we marked, and whether price reached it. Free, Sundays.
Subscribing signs you up for the free YieldTerminal Sunday recap, one email a week. Educational only, not financial advice. Unsubscribe any time.
See the full disclaimer.