← All daily levelsDaily Levels, Mon, 12 Oct 2026
Live prices during the 12 October 2026 session, each read when its chart was built and measured against the 9 October close.
Educational commentary, not investment advice.
Two series on one Monday. Five chip and chip-adjacent names went out one an hour through the session, and every one of them was lower: $MU, $MRVL, $AMD and $SMCI all fell between 2.9% and 4.9%, while $INTC gave back its late-September run and sat within 0.2% of the 16 September close it started that run from. The closing board then took the widest moves either way - $FICO the biggest gain on the board, $AAOI and $IONQ the deepest holes against their August highs, $GME a third straight three-month closing high and $ACN a new peak for its window. Levels are where price has reacted before, not forecasts.
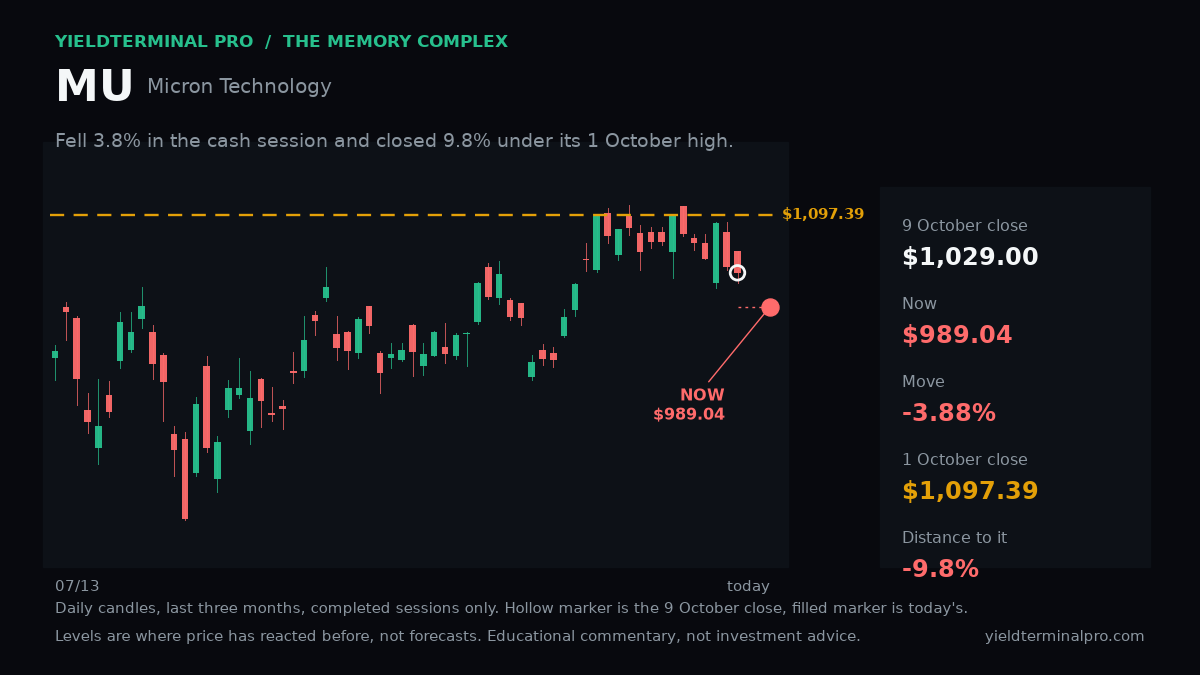
$MUMicron Technology, Inc. 989.04live price during the 12 October sessionMU is 9.8% below its 1 October close of 1,097.39, marked at 989.04.
- 1 October closeA price the stock has reacted at before, not a forecast.
- 1,097.39
- 9 October closeThe close the day's move is measured against; 9 October was the prior trading day.
- 1,029.00
Levels measured over a live print on 12 October 2026, with the chart behind it showing daily closes over the last three months through the 9 October session. A level measured over a different window can be a different number.
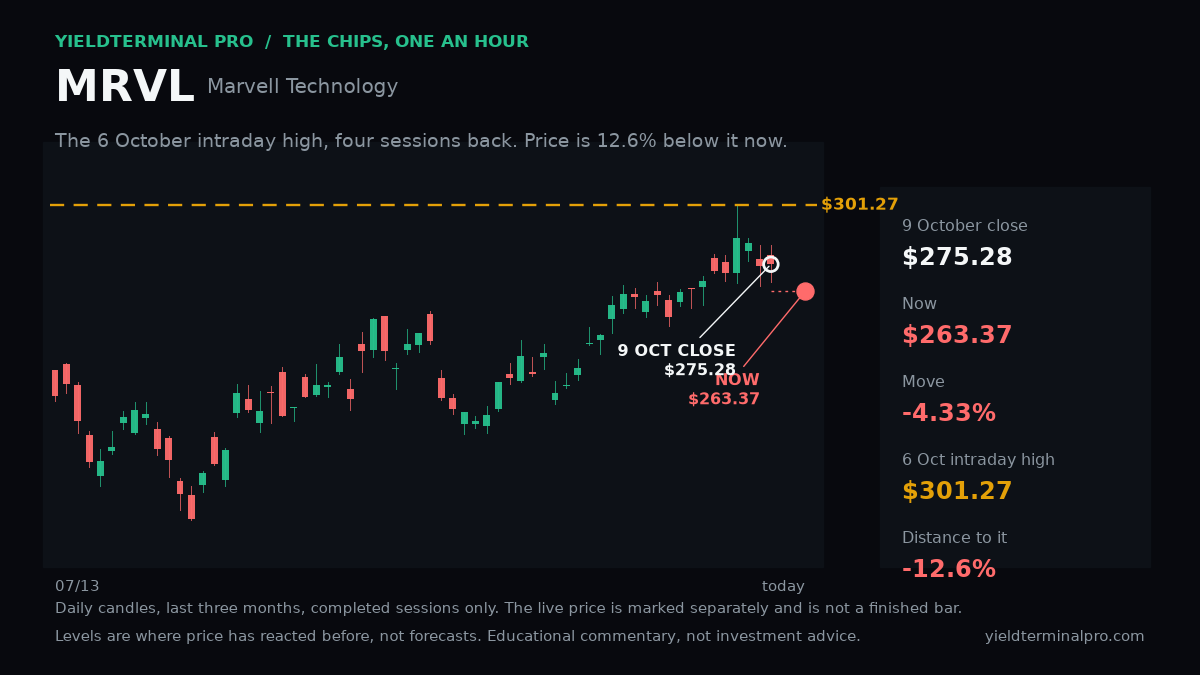
$MRVLMarvell Technology, Inc. 263.37live price during the 12 October sessionMRVL is 12.6% below its 6 October intraday high of 301.27, marked at 263.37.
- 6 October intraday highA price the stock has reacted at before, not a forecast.
- 301.27
- 9 October closeThe close the day's move is measured against; 9 October was the prior trading day.
- 275.28
Levels measured over a live print on 12 October 2026, with the chart behind it showing daily closes over the last three months through the 9 October session. A level measured over a different window can be a different number.
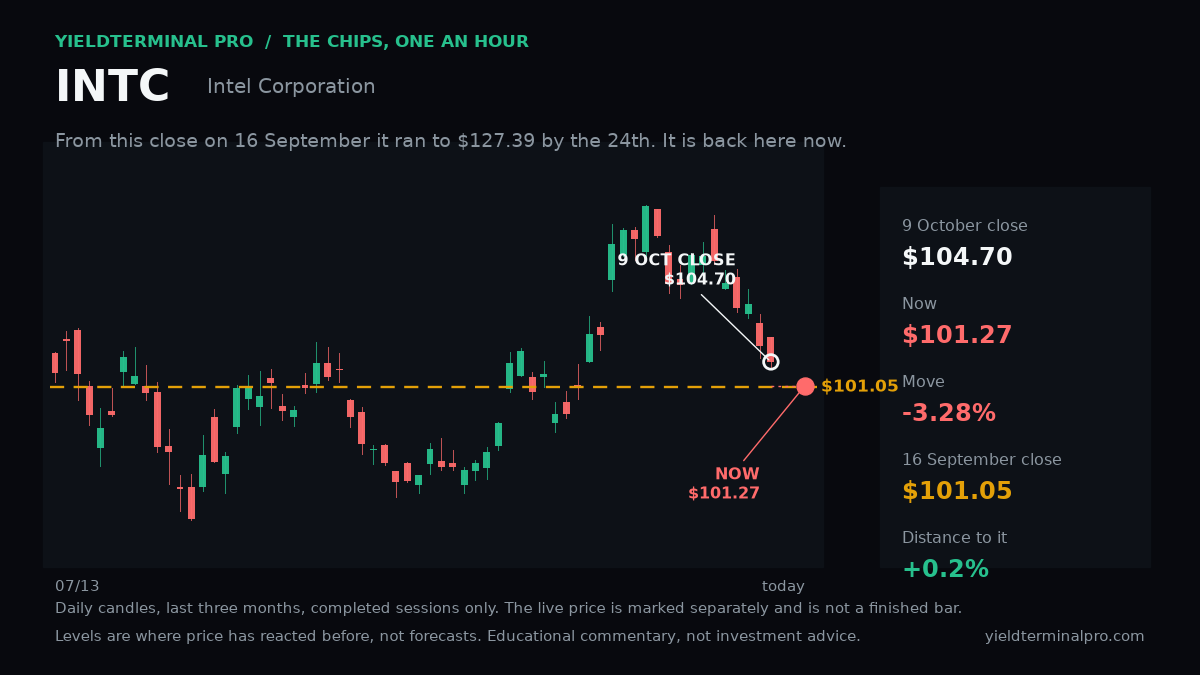
 101.27live price during the 12 October session
INTC is 0.2% above its 16 September close of 101.05, marked at 101.27.
- 16 September closeA price the stock has reacted at before, not a forecast.
- 101.05
- 9 October closeThe close the day's move is measured against; 9 October was the prior trading day.
- 104.70
Levels measured over a live print on 12 October 2026, with the chart behind it showing daily closes over the last three months through the 9 October session. A level measured over a different window can be a different number.
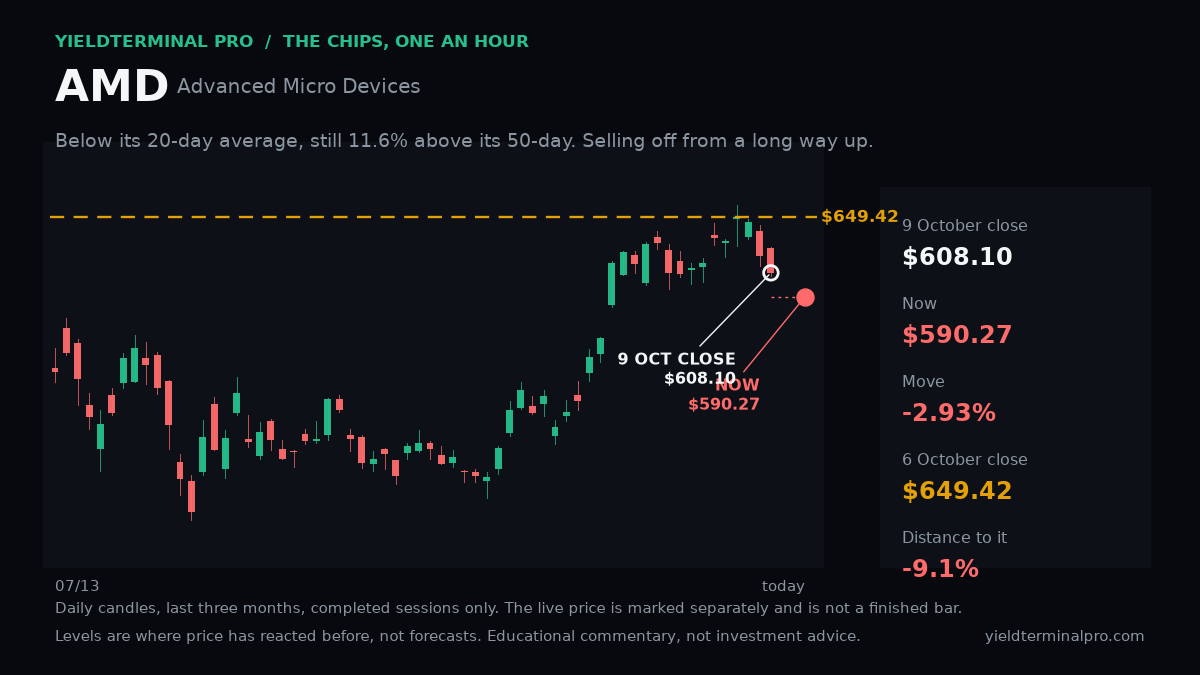
$AMDAdvanced Micro Devices, Inc. 590.27live price during the 12 October sessionAMD is 9.1% below its 6 October close of 649.42, marked at 590.27.
- 6 October closeA price the stock has reacted at before, not a forecast.
- 649.42
- 9 October closeThe close the day's move is measured against; 9 October was the prior trading day.
- 608.10
Levels measured over a live print on 12 October 2026, with the chart behind it showing daily closes over the last three months through the 9 October session. A level measured over a different window can be a different number.
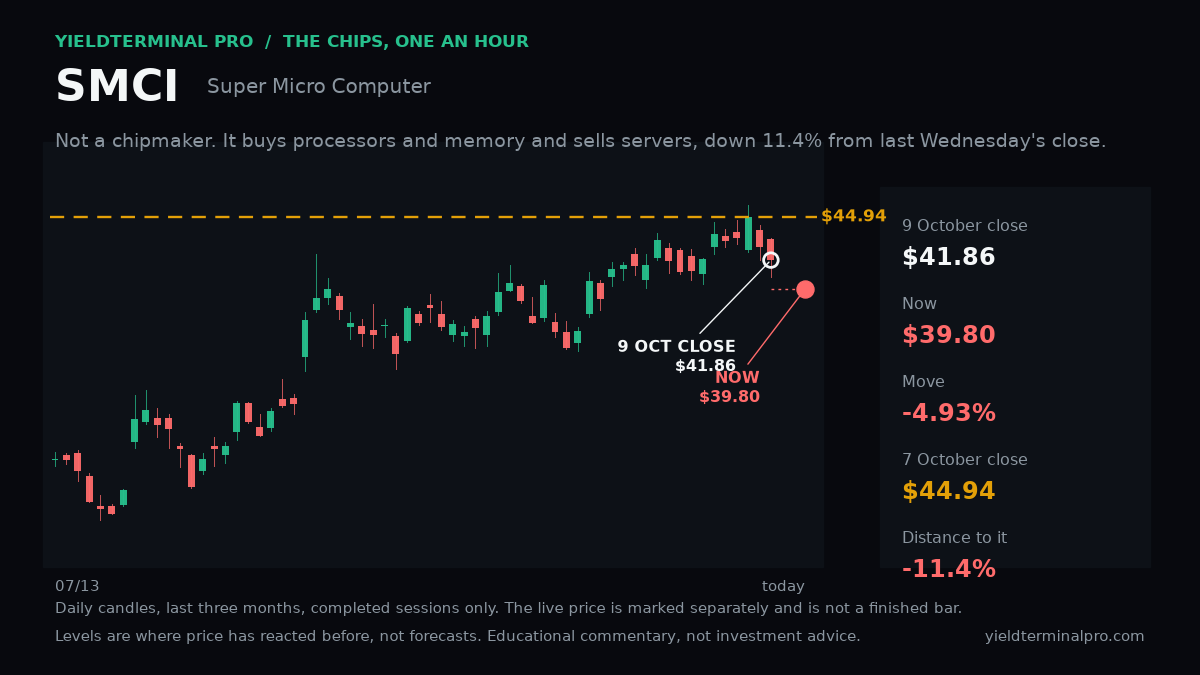
$SMCISuper Micro Computer, Inc. 39.80live price during the 12 October sessionSMCI is 11.4% below its 7 October close of 44.94, marked at 39.80.
- 7 October closeA price the stock has reacted at before, not a forecast.
- 44.94
- 9 October closeThe close the day's move is measured against; 9 October was the prior trading day.
- 41.86
Levels measured over a live print on 12 October 2026, with the chart behind it showing daily closes over the last three months through the 9 October session. A level measured over a different window can be a different number.
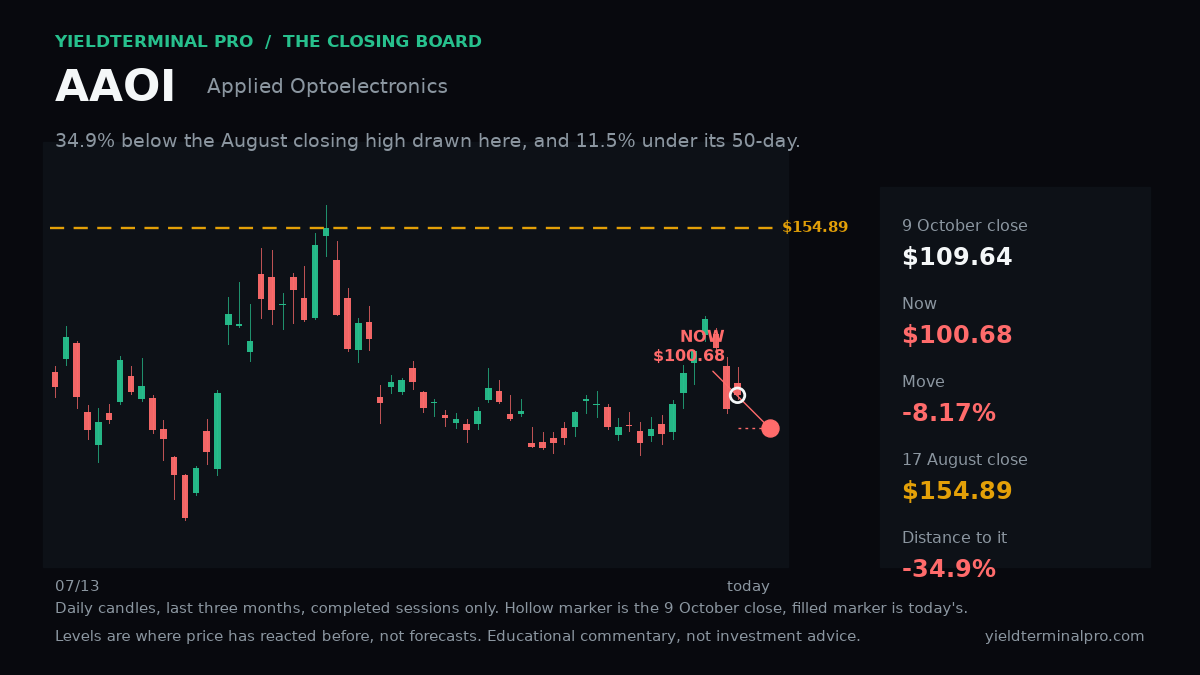
$AAOIApplied Optoelectronics, Inc. 100.68live price during the 12 October sessionAAOI is 34.9% below its 17 August close of 154.89, marked at 100.68.
- 17 August closeA price the stock has reacted at before, not a forecast.
- 154.89
- 9 October closeThe close the day's move is measured against; 9 October was the prior trading day.
- 109.64
Levels measured over a live print on 12 October 2026, with the chart behind it showing daily closes over the last three months through the 9 October session. A level measured over a different window can be a different number.
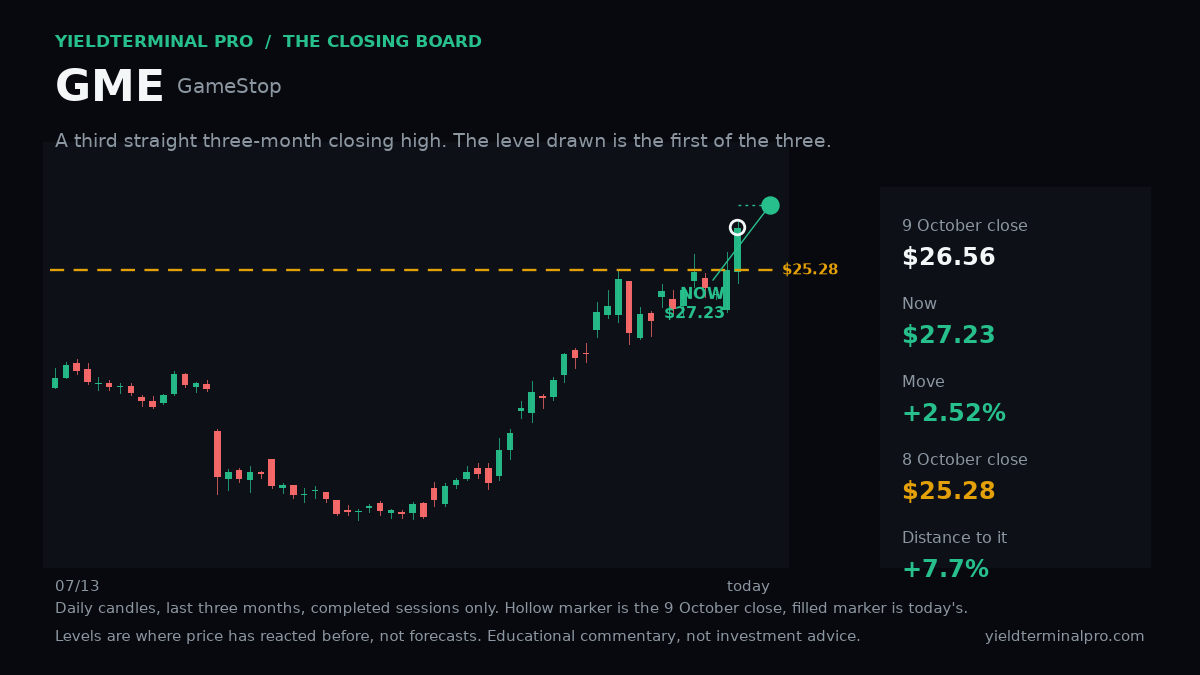
$GMEGameStop Corp. Class A 27.23live price during the 12 October sessionGME is 7.7% above its 8 October close of 25.28, marked at 27.23.
- 8 October closeA price the stock has reacted at before, not a forecast.
- 25.28
- 9 October closeThe close the day's move is measured against; 9 October was the prior trading day.
- 26.56
Levels measured over a live print on 12 October 2026, with the chart behind it showing daily closes over the last three months through the 9 October session. A level measured over a different window can be a different number.
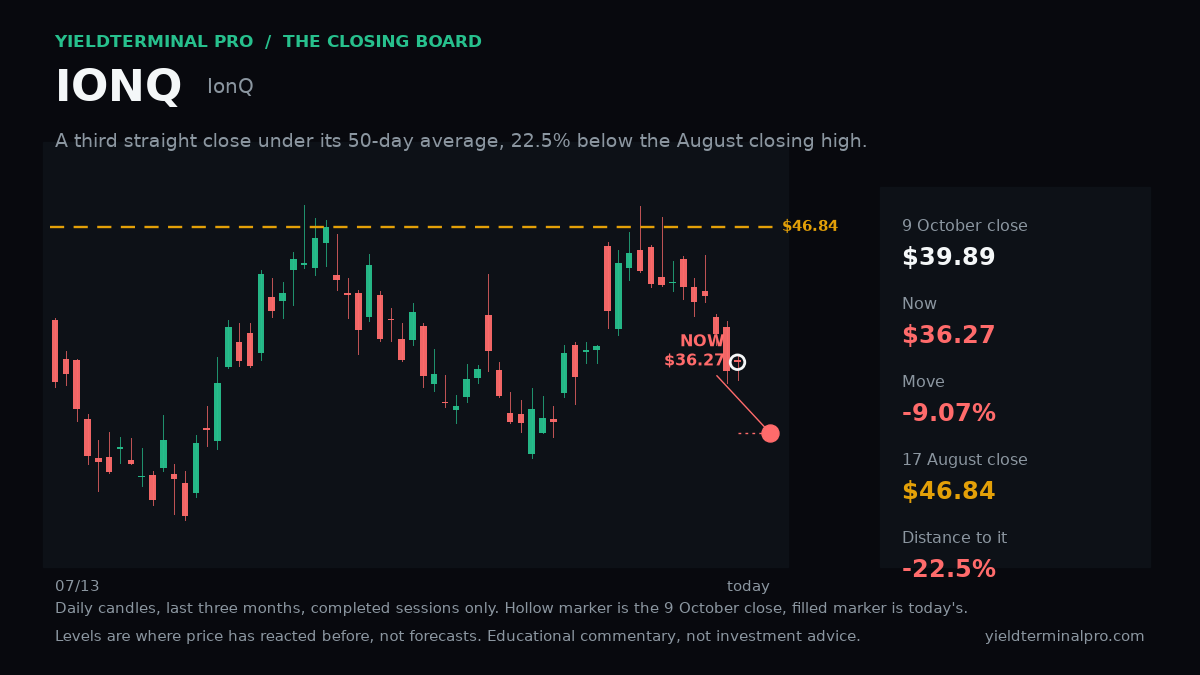
 36.27live price during the 12 October session
IONQ is 22.5% below its 17 August close of 46.84, marked at 36.27.
- 17 August closeA price the stock has reacted at before, not a forecast.
- 46.84
- 9 October closeThe close the day's move is measured against; 9 October was the prior trading day.
- 39.89
Levels measured over a live print on 12 October 2026, with the chart behind it showing daily closes over the last three months through the 9 October session. A level measured over a different window can be a different number.
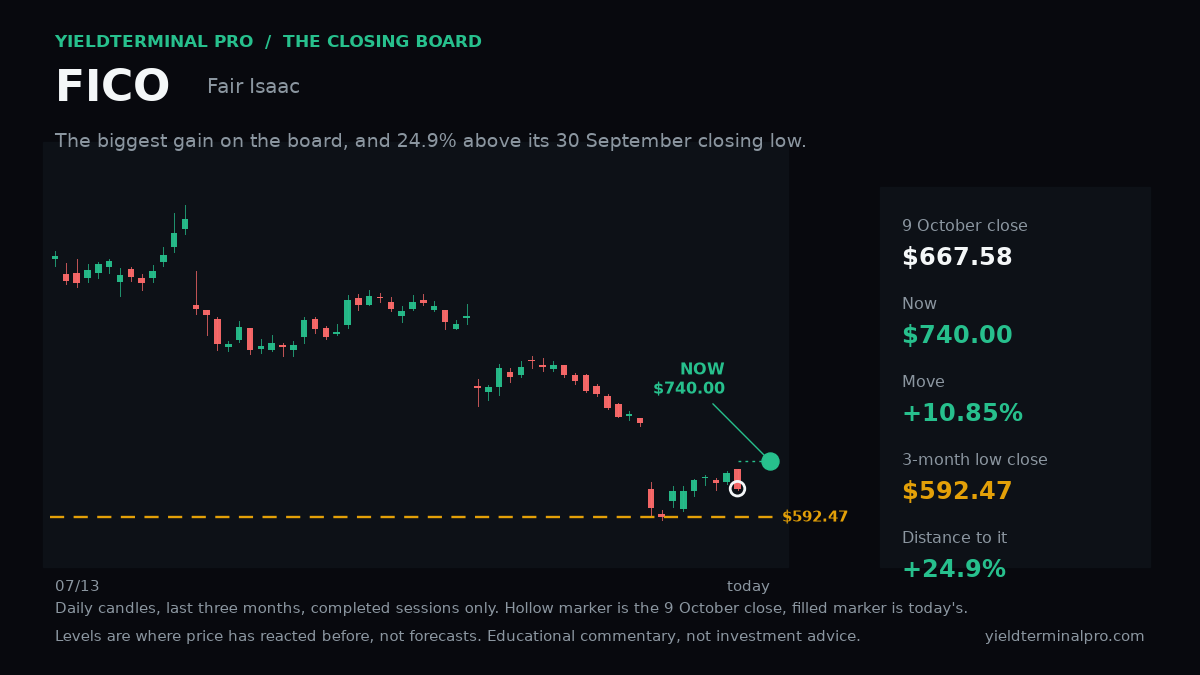
$FICOFair Isaac Corporation 740.00live price during the 12 October sessionFICO is 24.9% above its 3-month low close of 592.47, marked at 740.00.
- 3-month low closeA price the stock has reacted at before, not a forecast.
- 592.47
- 9 October closeThe close the day's move is measured against; 9 October was the prior trading day.
- 667.58
Levels measured over a live print on 12 October 2026, with the chart behind it showing daily closes over the last three months through the 9 October session. A level measured over a different window can be a different number.
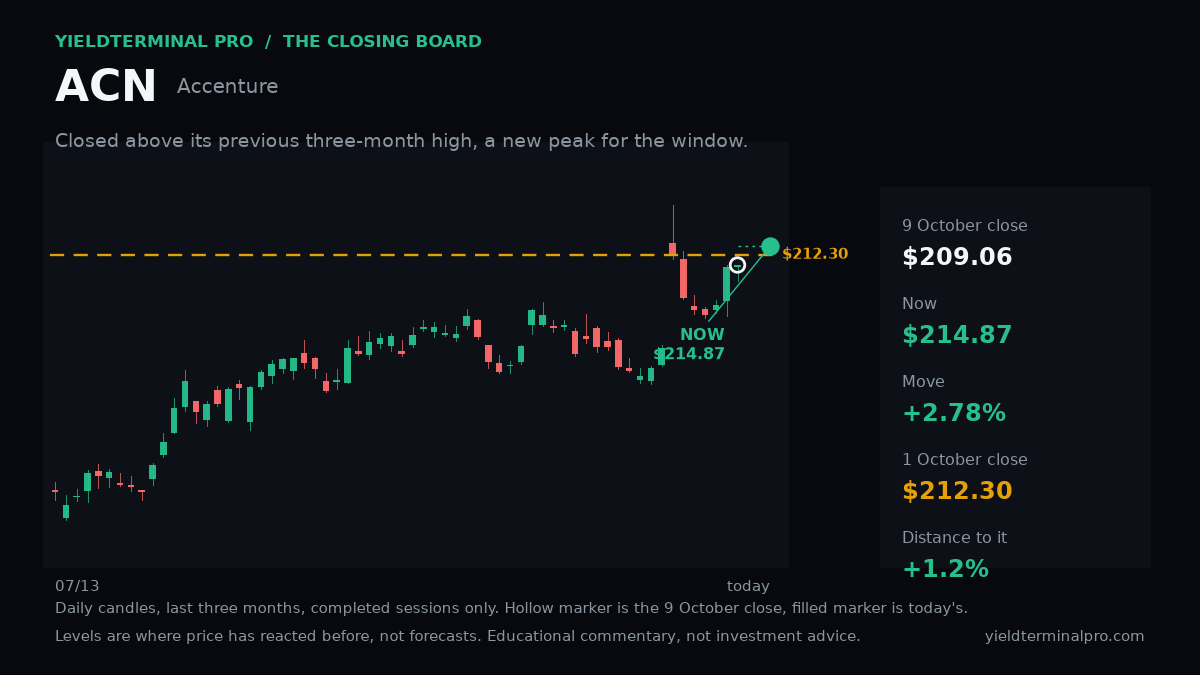
$ACNAccenture plc Class A 214.87live price during the 12 October sessionACN is 1.2% above its 1 October close of 212.30, marked at 214.87.
- 1 October closeA price the stock has reacted at before, not a forecast.
- 212.30
- 9 October closeThe close the day's move is measured against; 9 October was the prior trading day.
- 209.06
Levels measured over a live print on 12 October 2026, with the chart behind it showing daily closes over the last three months through the 9 October session. A level measured over a different window can be a different number.
Get the week in one email
Every level we marked, and whether price reached it. Free, Sundays.
Subscribing signs you up for the free YieldTerminal Sunday recap, one email a week. Educational only, not financial advice. Unsubscribe any time.