← All daily levels

Daily Levels, Fri, 9 Oct 2026

Premarket prints on 9 October 2026, frozen at 06:18 ET and measured against the 8 October close. Live quotes, not delayed.

Educational commentary, not investment advice.

Five names carried over from yesterday's story rather than picked off a screen. Thursday's close sold the optical and interconnect complex hard while the index barely moved, and the same names bounced overnight and extended this morning. $AAOI and $LITE are that complex, $IREN is the AI build-out one rung further out, $AAPL is the one megacap going the other way on a report it asked suppliers to cut iPhone component orders, and $PEP is yesterday's earnings pop handing part of itself back. All five are marked at 06:18 ET, before the bell. Premarket is thin: a print is not a session, and none of these is where the stock will open.

$AAOIApplied Optoelectronics, Inc.
111.20premarket print, 06:18 ET

AAOI is 5.0% higher premarket, marked at 111.20 against a 105.90 close.

premarket mark (06:18 ET)A live extended-hours print, not an opening price.
111.20
prior close (8 Oct)The close the premarket move is measured against.
105.90
50-day simple moving averageComputed from daily closes through the 8 October session.
113.50
200-day simple moving averageComputed from daily closes through the 8 October session.
110.61
52-week highThe highest intraday print on the plotted window.
233.67
52-week lowThe lowest intraday print on the plotted window.
18.50

Levels measured over a premarket print read at 06:18 ET on 9 October 2026 and frozen, with the chart behind it showing daily closes through the 8 October session. A level measured over a different window can be a different number.
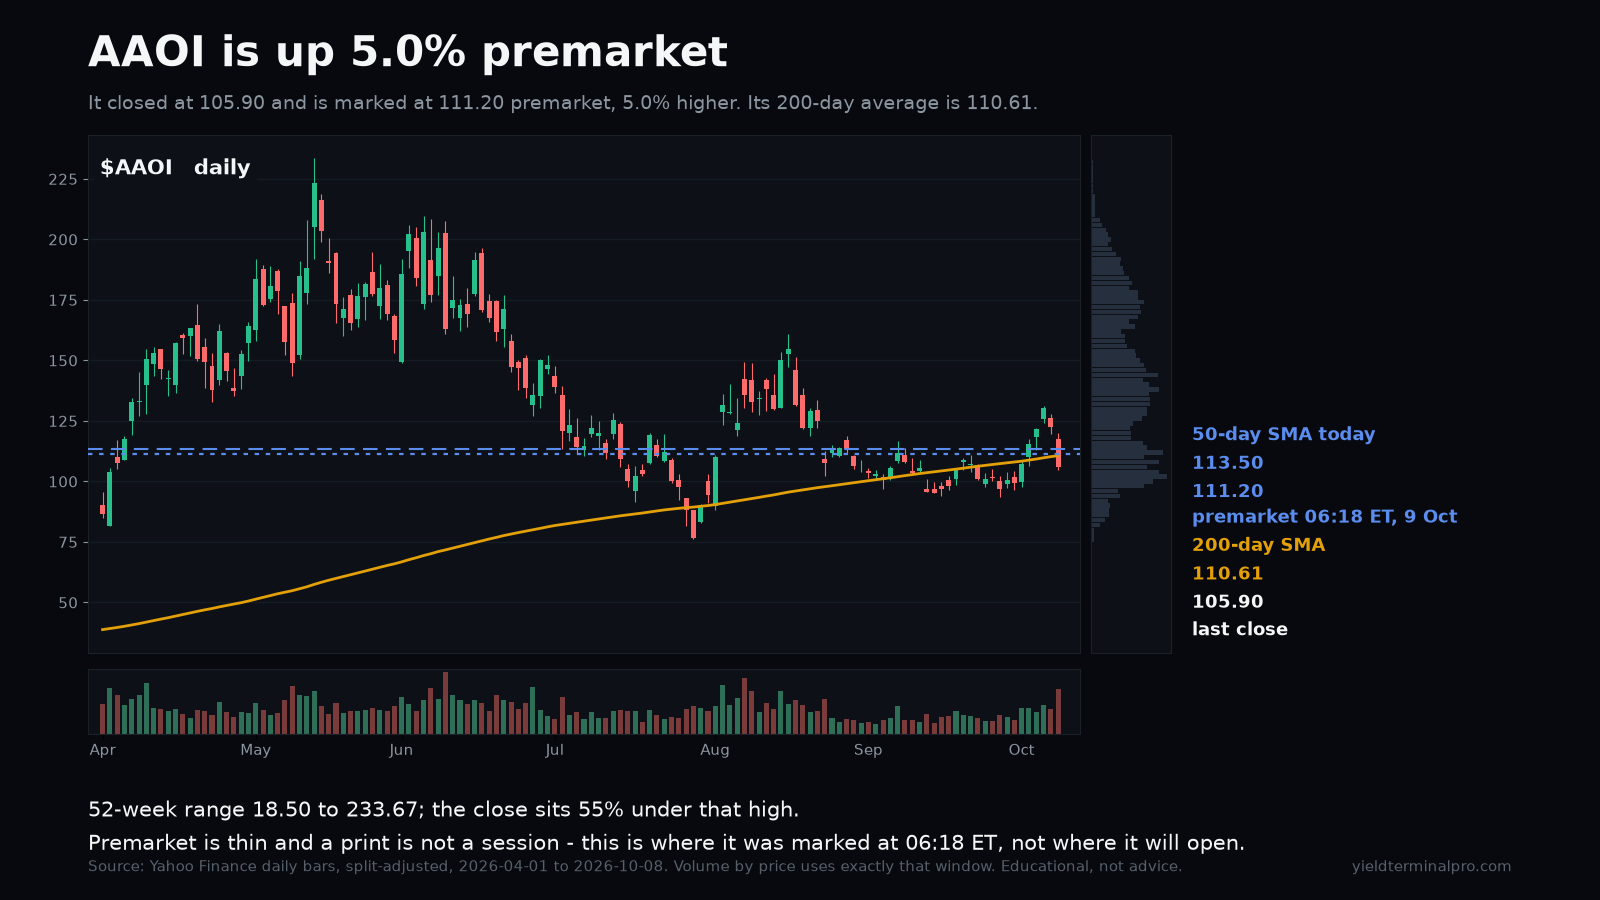
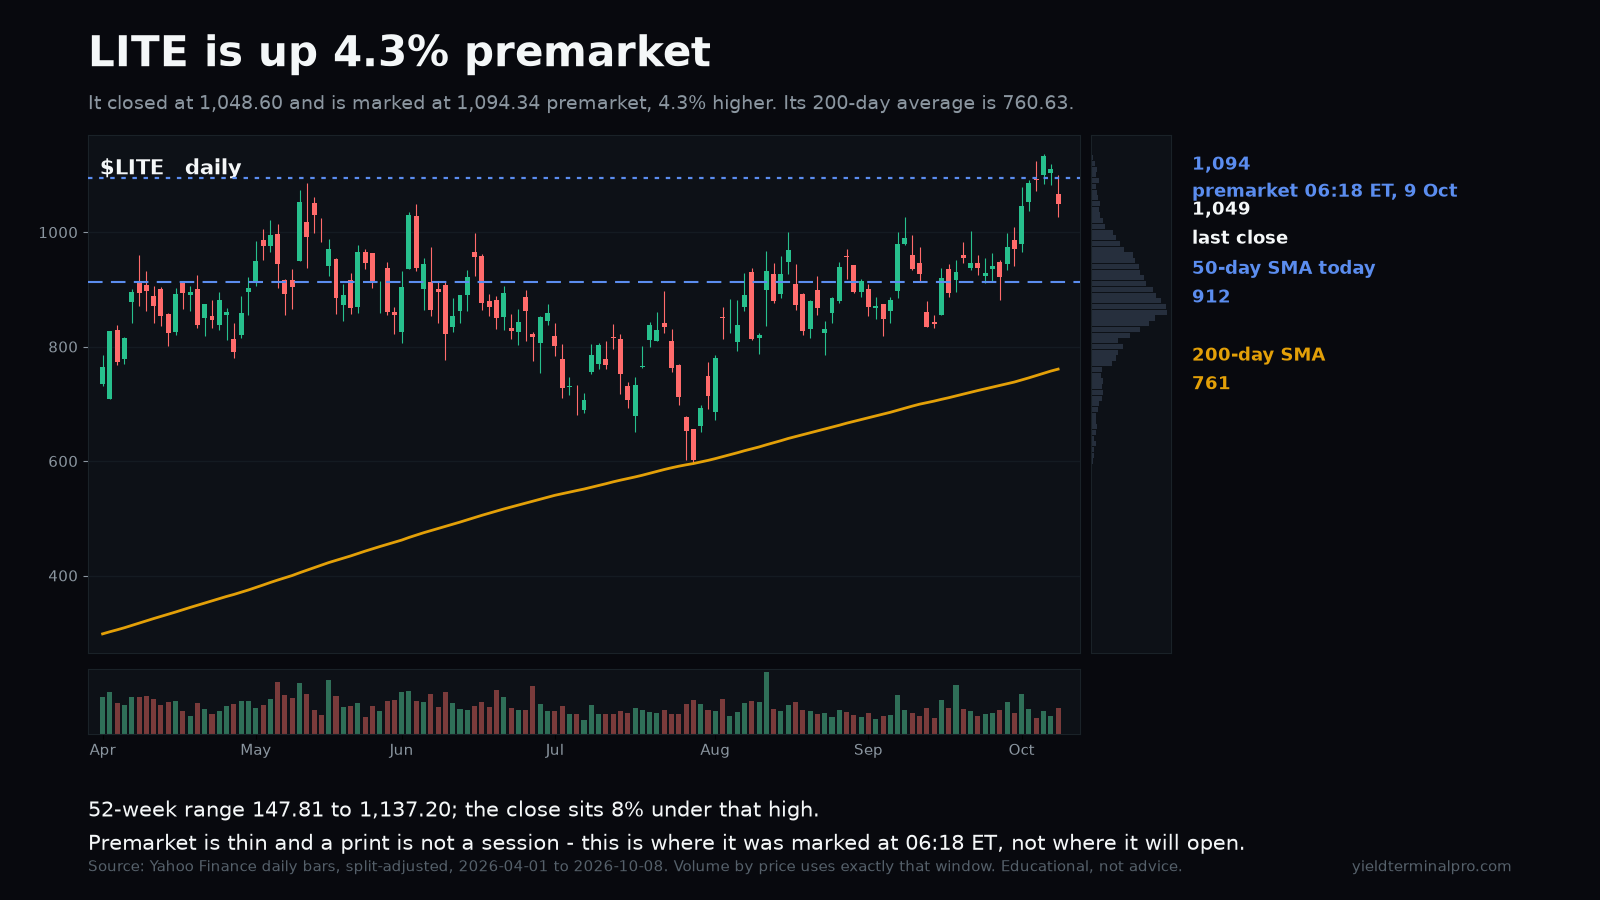
AAOI chart
$LITELumentum Holdings, Inc.
1,094.34premarket print, 06:18 ET

LITE is 4.3% higher premarket, marked at 1,094.34 against a 1,048.60 close.

premarket mark (06:18 ET)A live extended-hours print, not an opening price.
1,094.34
prior close (8 Oct)The close the premarket move is measured against.
1,048.60
50-day simple moving averageComputed from daily closes through the 8 October session.
912.14
200-day simple moving averageComputed from daily closes through the 8 October session.
760.63
52-week highThe highest intraday print on the plotted window.
1,137.20
52-week lowThe lowest intraday print on the plotted window.
147.81

Levels measured over a premarket print read at 06:18 ET on 9 October 2026 and frozen, with the chart behind it showing daily closes through the 8 October session. A level measured over a different window can be a different number.
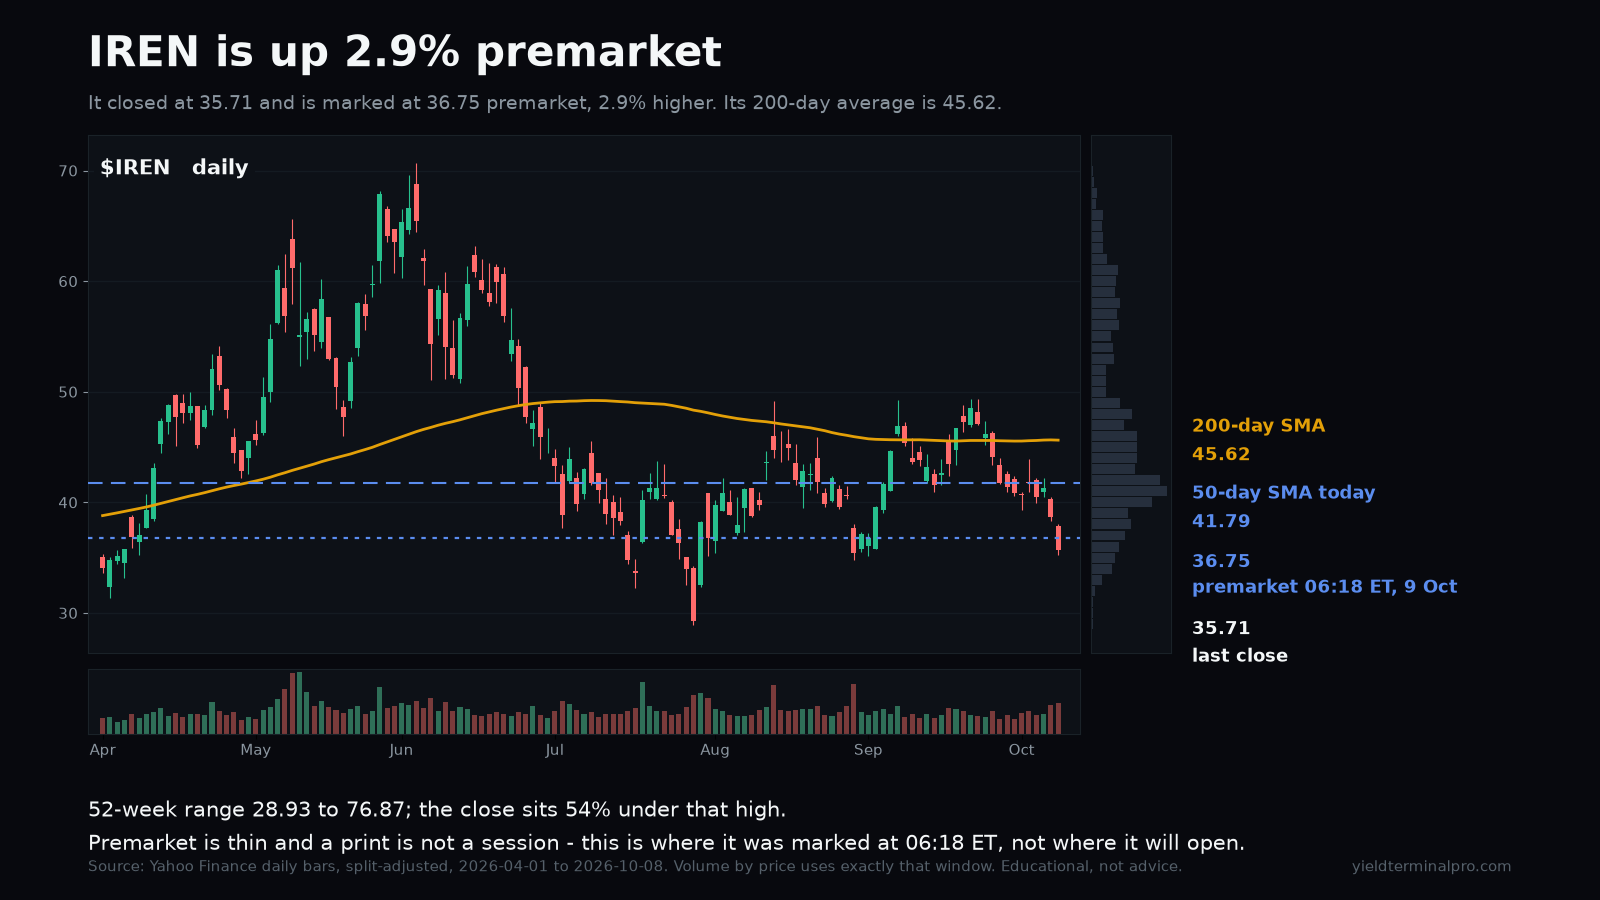
LITE chart
$IRENIREN Limited
36.75premarket print, 06:18 ET

IREN is 2.9% higher premarket, marked at 36.75 against a 35.71 close.

premarket mark (06:18 ET)A live extended-hours print, not an opening price.
36.75
prior close (8 Oct)The close the premarket move is measured against.
35.71
50-day simple moving averageComputed from daily closes through the 8 October session.
41.79
200-day simple moving averageComputed from daily closes through the 8 October session.
45.62
52-week highThe highest intraday print on the plotted window.
76.87
52-week lowThe lowest intraday print on the plotted window.
28.93

Levels measured over a premarket print read at 06:18 ET on 9 October 2026 and frozen, with the chart behind it showing daily closes through the 8 October session. A level measured over a different window can be a different number.
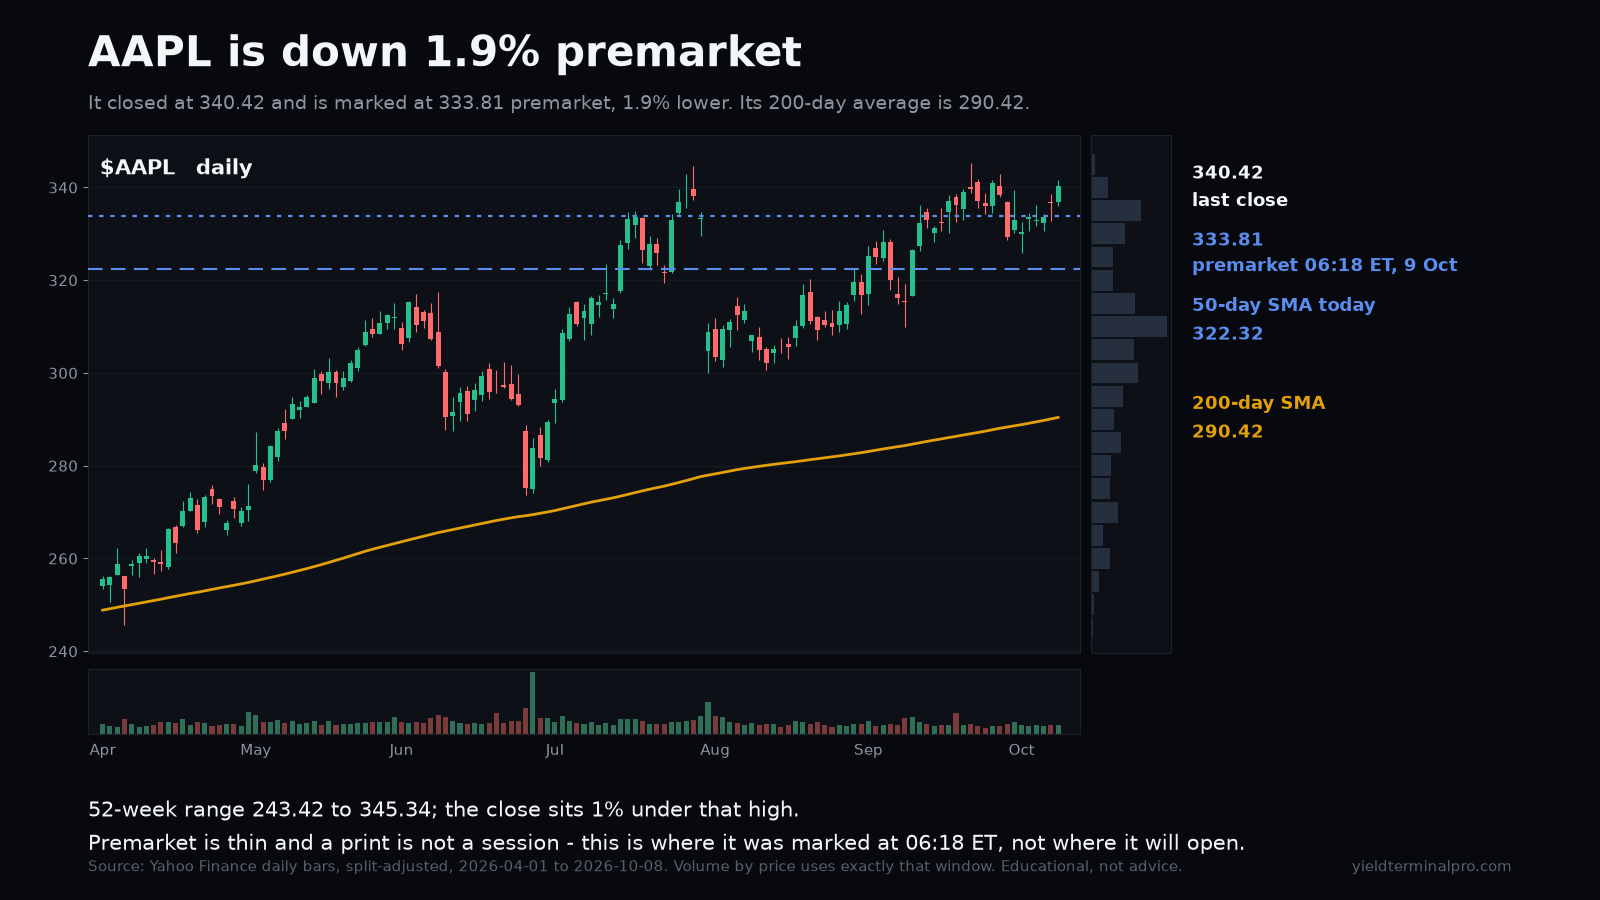
IREN chart
$AAPLApple Inc.
333.81premarket print, 06:18 ET

AAPL is 1.9% lower premarket, marked at 333.81 against a 340.42 close.

premarket mark (06:18 ET)A live extended-hours print, not an opening price.
333.81
prior close (8 Oct)The close the premarket move is measured against.
340.42
50-day simple moving averageComputed from daily closes through the 8 October session.
322.32
200-day simple moving averageComputed from daily closes through the 8 October session.
290.42
52-week highThe highest intraday print on the plotted window.
345.34
52-week lowThe lowest intraday print on the plotted window.
243.42

Levels measured over a premarket print read at 06:18 ET on 9 October 2026 and frozen, with the chart behind it showing daily closes through the 8 October session. A level measured over a different window can be a different number.
AAPL chart
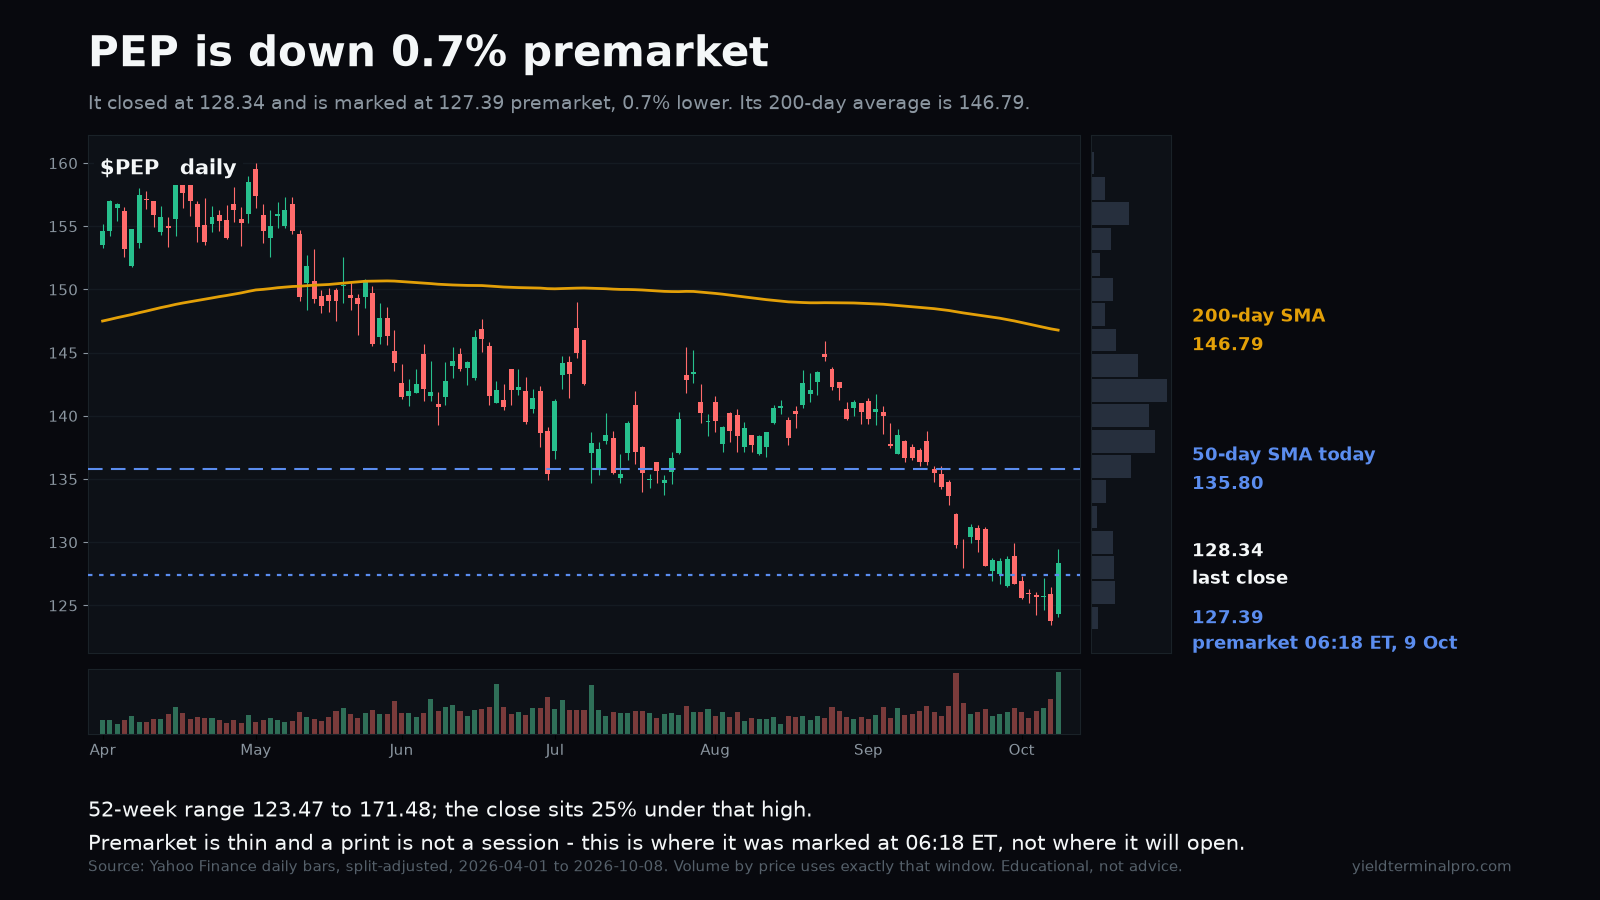
$PEPPepsiCo, Inc.
127.40premarket print, 06:18 ET

PEP is 0.7% lower premarket, marked at 127.39 against a 128.34 close.

premarket mark (06:18 ET)A live extended-hours print, not an opening price.
127.39
prior close (8 Oct)The close the premarket move is measured against.
128.34
50-day simple moving averageComputed from daily closes through the 8 October session.
135.80
200-day simple moving averageComputed from daily closes through the 8 October session.
146.79
52-week highThe highest intraday print on the plotted window.
171.48
52-week lowThe lowest intraday print on the plotted window.
123.47

Levels measured over a premarket print read at 06:18 ET on 9 October 2026 and frozen, with the chart behind it showing daily closes through the 8 October session. A level measured over a different window can be a different number.

PEP chart

Get the week in one email

Every level we marked, and whether price reached it. Free, Sundays.

Subscribing signs you up for the free YieldTerminal Sunday recap, one email a week. Educational only, not financial advice. Unsubscribe any time.

See the full disclaimer.