Seven companies reported before this open and none of them is a chipmaker. The six bank and health names each carry a prior close they have traded away from, and every one of them is still below it - $GS by the widest margin at nearly 20%, $C by the narrowest. $DPZ is the exception on this board: it reported the same morning, but the level on its chart is the neckline of a double bottom rather than a prior close, and that pattern is not confirmed. Levels are where price has reacted before, not forecasts. The after-close section adds the five names followed this morning and the closing Top 5 Up/Down watchlist charts. Earlier readings above stay unchanged; later notes explicitly use the regular close. The closing screen covers 203 qualifying US-listed stocks and ADRs with reported caps above US$5B in the October 9 frozen 275-symbol watchlist, not the entire market.
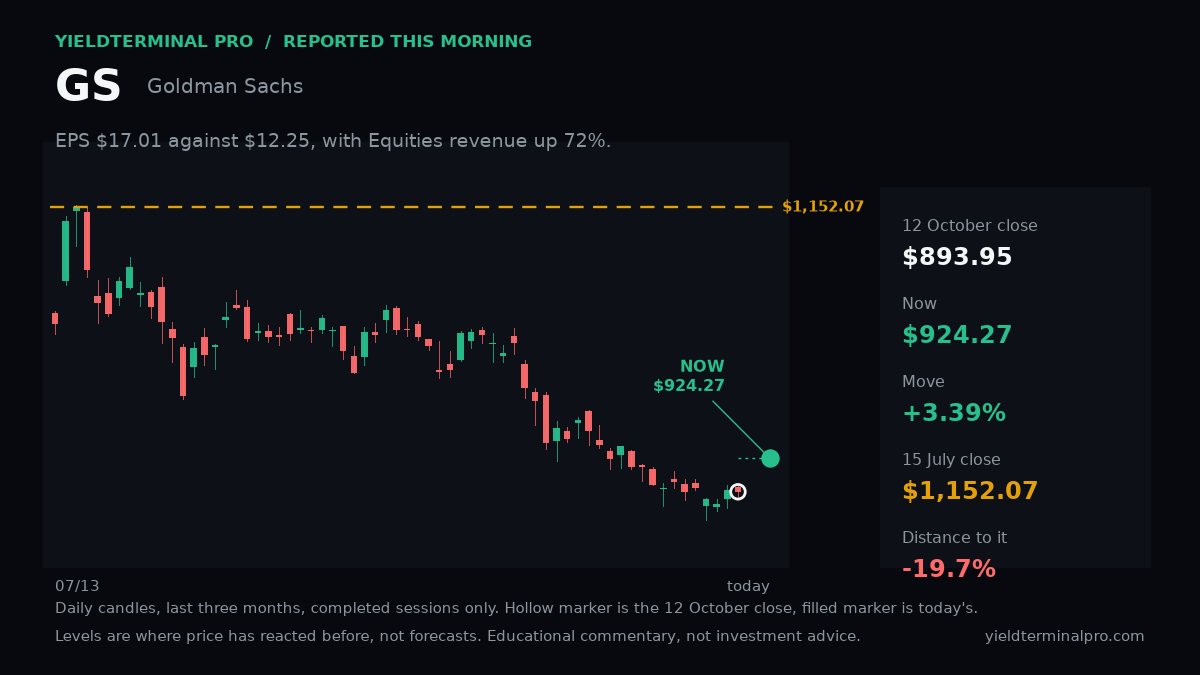
$GSThe Goldman Sachs Group, Inc. 924.27live price during the 13 October sessionGS is 19.7% below its 15 July close of 1,152.07, marked at 924.27 after reporting.
- 15 July closeA prior closing price the stock has traded away from, not a forecast.
- 1,152.07
- 12 October closeThe close the day's move is measured against.
- 893.95
Levels measured over a live print on 13 October 2026, with the chart behind it showing daily closes over the last three months through the 12 October session. A level measured over a different window can be a different number.
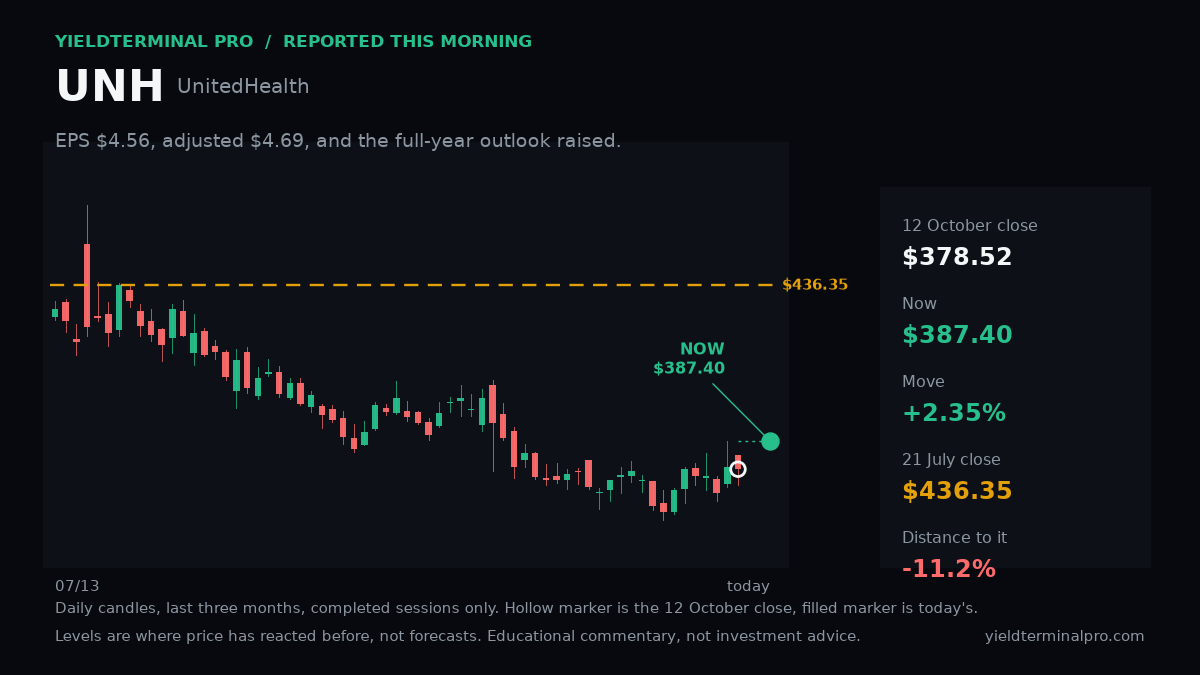
$UNHUnitedHealth Group Incorporated 387.40live price during the 13 October sessionUNH is 11.2% below its 21 July close of 436.35, marked at 387.40 after reporting.
- 21 July closeA prior closing price the stock has traded away from, not a forecast.
- 436.35
- 12 October closeThe close the day's move is measured against.
- 378.52
Levels measured over a live print on 13 October 2026, with the chart behind it showing daily closes over the last three months through the 12 October session. A level measured over a different window can be a different number.
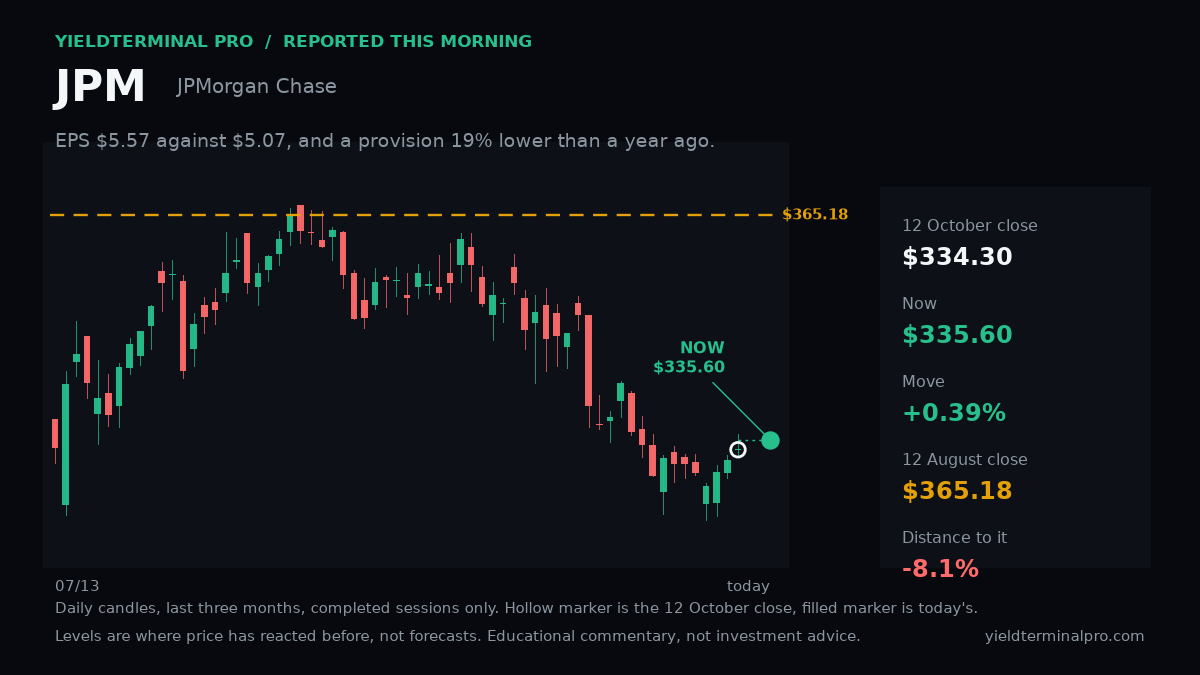
 335.60live price during the 13 October session
JPM is 8.1% below its 12 August close of 365.18, marked at 335.60 after reporting.
- 12 August closeA prior closing price the stock has traded away from, not a forecast.
- 365.18
- 12 October closeThe close the day's move is measured against.
- 334.30
Levels measured over a live print on 13 October 2026, with the chart behind it showing daily closes over the last three months through the 12 October session. A level measured over a different window can be a different number.
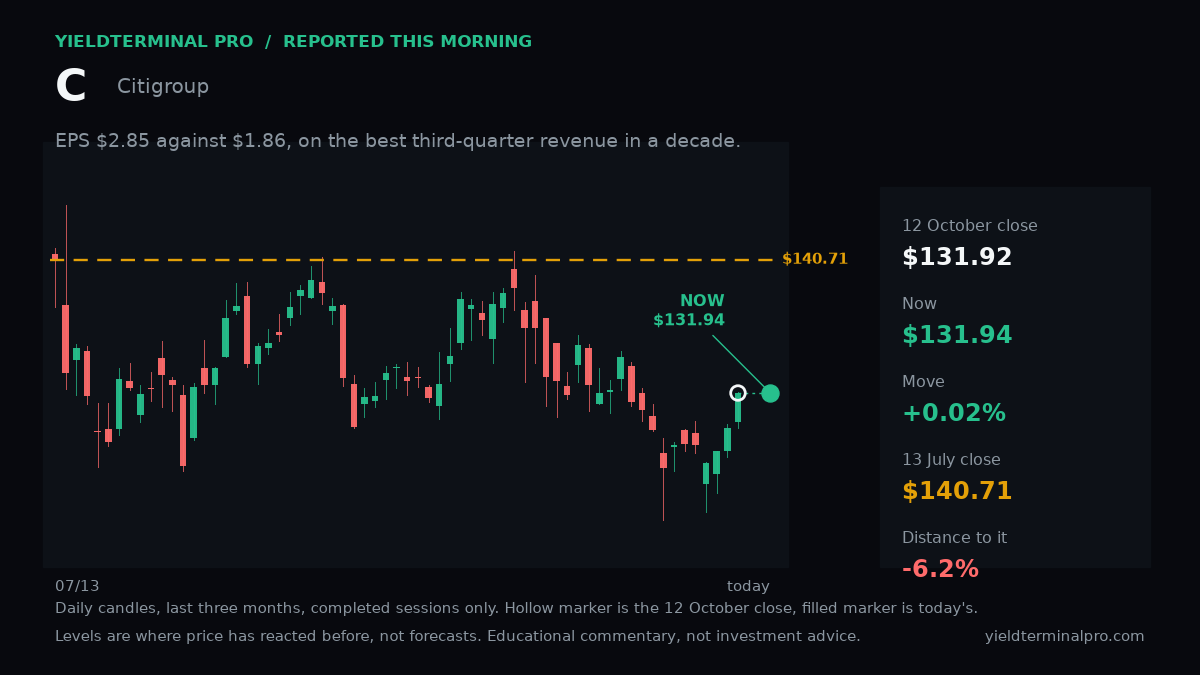
 131.94live price during the 13 October session
C is 6.2% below its 13 July close of 140.71, marked at 131.94 after reporting.
- 13 July closeA prior closing price the stock has traded away from, not a forecast.
- 140.71
- 12 October closeThe close the day's move is measured against.
- 131.92
Levels measured over a live print on 13 October 2026, with the chart behind it showing daily closes over the last three months through the 12 October session. A level measured over a different window can be a different number.
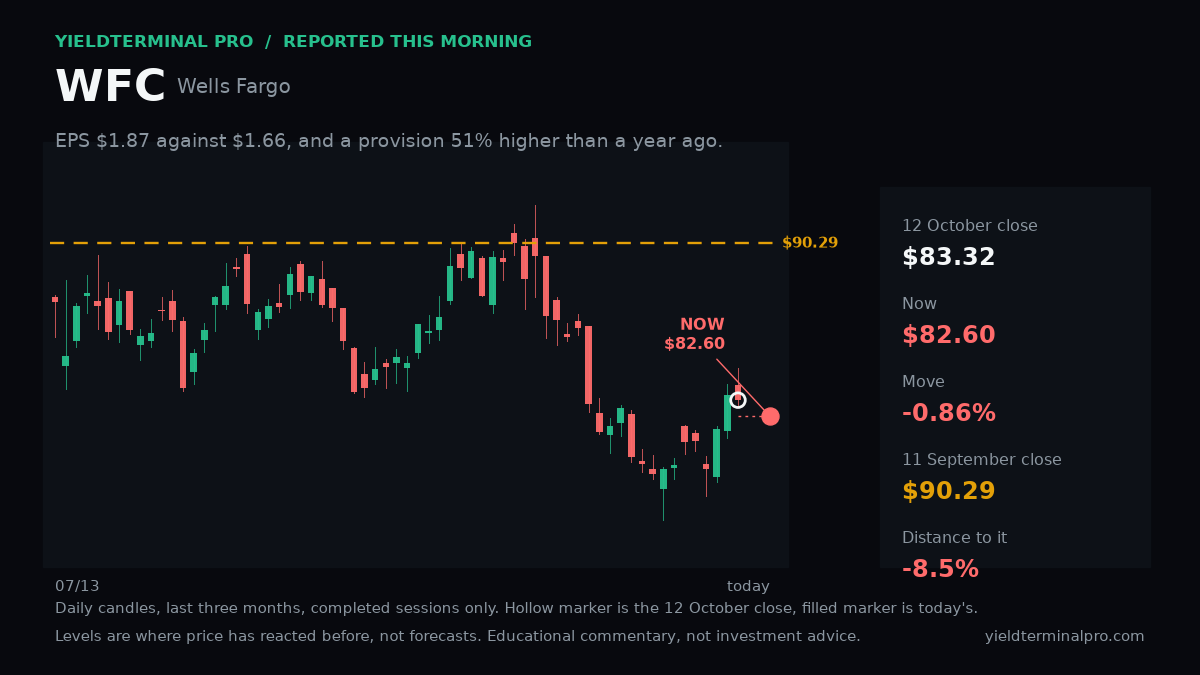
$WFCWells Fargo & Company 82.60live price during the 13 October sessionWFC is 8.5% below its 11 September close of 90.29, marked at 82.60 after reporting.
- 11 September closeA prior closing price the stock has traded away from, not a forecast.
- 90.29
- 12 October closeThe close the day's move is measured against.
- 83.32
Levels measured over a live print on 13 October 2026, with the chart behind it showing daily closes over the last three months through the 12 October session. A level measured over a different window can be a different number.
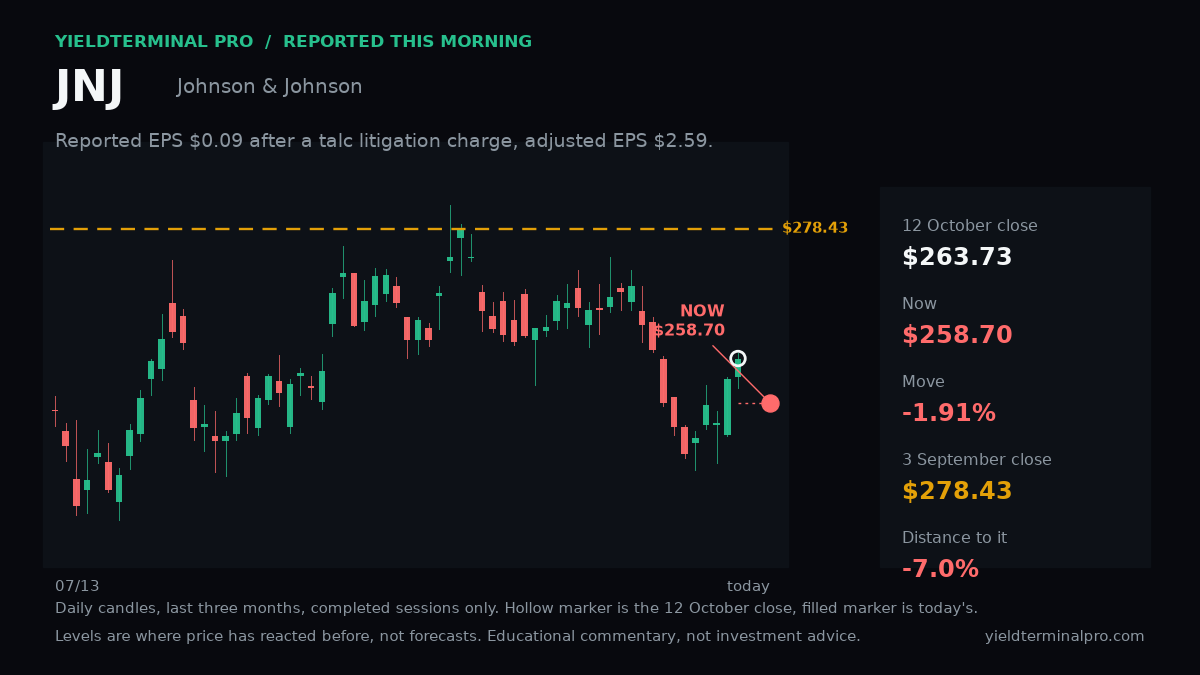
 258.70live price during the 13 October session
JNJ is 7.0% below its 3 September close of 278.43, marked at 258.70 after reporting.
- 3 September closeA prior closing price the stock has traded away from, not a forecast.
- 278.43
- 12 October closeThe close the day's move is measured against.
- 263.73
Levels measured over a live print on 13 October 2026, with the chart behind it showing daily closes over the last three months through the 12 October session. A level measured over a different window can be a different number.
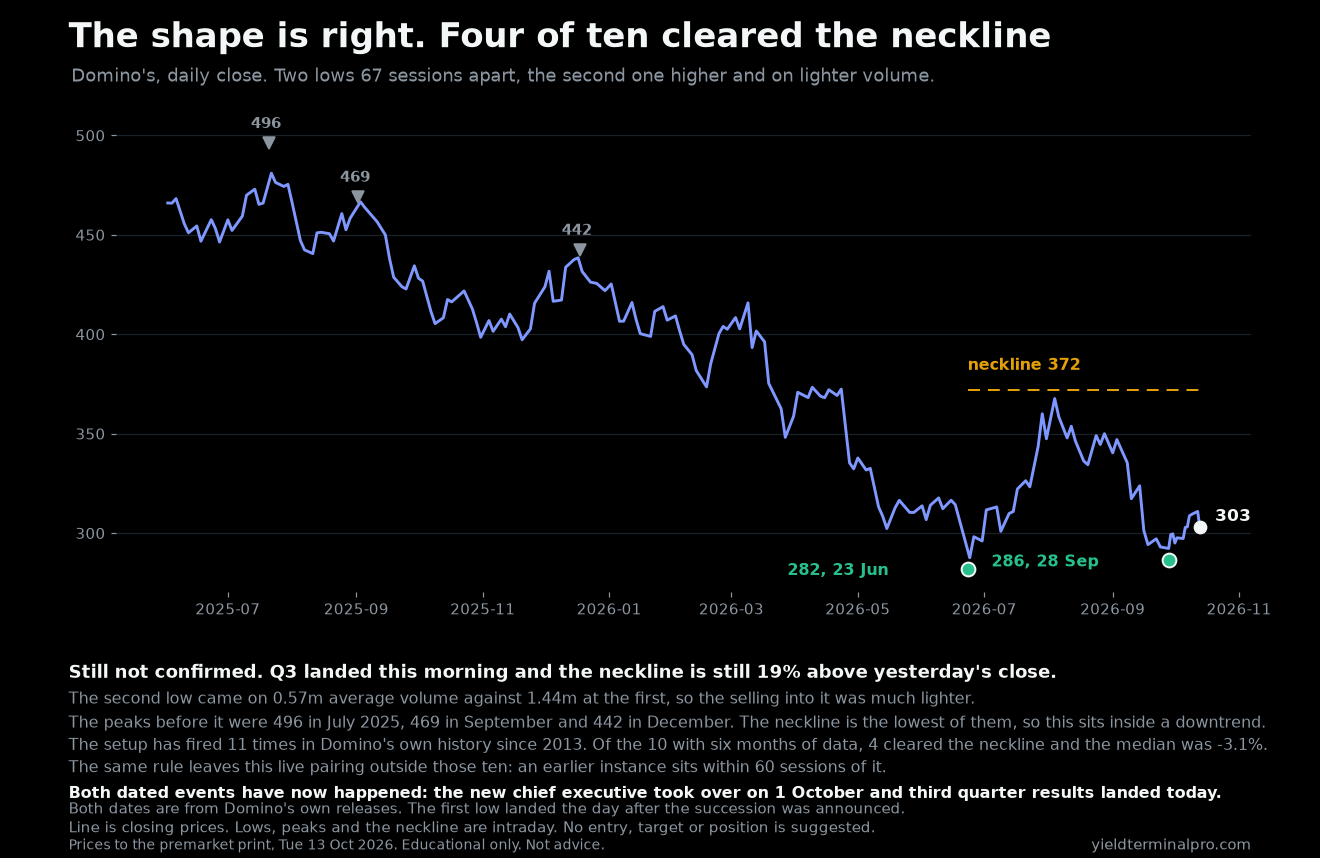
 303.00premarket print, 13 October 2026
DPZ's 372 neckline is 19% above its 12 October close of 310.90, so the double bottom is still unconfirmed. The stock marked 303 premarket after reporting.
- neckline (double bottom)The lowest of the three prior peaks: 496 in July 2025, 469 in September, 442 in December. Confirmation needs a CLOSE above it, which has not happened.
- 372.00
- 12 October closeThe base the 19% is measured from. The premarket print of 303 is a thinner number and would read 22.8%, which is why it is not the anchor.
- 310.90
- second low, 28 SeptemberHigher than the first low of 282 on 23 June, and on 0.57m average volume against 1.44m at the first.
- 286.00
Levels measured over a premarket print on 13 October 2026 against a neckline measured from the 12 October close, drawn from two closing lows 67 sessions apart on the daily closing line since July 2025. A level measured over a different window can be a different number.
$SPYSPDR S&P 500 ETF Trust 778.01October 13 regular-session closeSPY closed at $778.01, still below the October 6 intraday high at $781.62.
- October 6 intraday highRegular-session intraday extreme for the date in the label; not a closing price.
- 781.62
- October 13 intraday lowRegular-session intraday extreme for the date in the label; not a closing price.
- 775.95
- October 8 intraday lowRegular-session intraday extreme for the date in the label; not a closing price.
- 770.44
- 20-session SMAIndependently calculated from completed regular-session daily closes through October 13; drawn as a moving line on the chart.
- 769.87
- 50-session SMAIndependently calculated from completed regular-session daily closes through October 13; drawn as a moving line on the chart.
- 768.60
Levels measured over 45 completed regular sessions from 2026-08-11 through 2026-10-13; moving averages use their named number of completed sessions. Earlier pre-market marks are separate observations through about 8:38 a.m. ET on October 13. A level measured over a different window can be a different number.
 743.57October 13 regular-session close
QQQ closed at $743.57, below the October 12 intraday low at $744.85.
- October 12 high (intraday)Regular-session intraday extreme for the date in the label; not a closing price.
- 749.79
- October 12 low (intraday)Regular-session intraday extreme for the date in the label; not a closing price.
- 744.85
- October 13 intraday lowRegular-session intraday extreme for the date in the label; not a closing price.
- 738.84
- 20-session SMAIndependently calculated from completed regular-session daily closes through October 13; drawn as a moving line on the chart.
- 741.34
- 50-session SMAIndependently calculated from completed regular-session daily closes through October 13; drawn as a moving line on the chart.
- 726.55
Levels measured over 45 completed regular sessions from 2026-08-11 through 2026-10-13; moving averages use their named number of completed sessions. Earlier pre-market marks are separate observations through about 8:38 a.m. ET on October 13. A level measured over a different window can be a different number.
 162.36October 13 regular-session close
Vistra closed at $162.36, back above its $154.73 200-session average but below the October 12 high at $164.25.
- October 8 high (intraday)Regular-session intraday extreme for the date in the label; not a closing price.
- 168.75
- October 12 high (intraday)Regular-session intraday extreme for the date in the label; not a closing price.
- 164.25
- 200-session SMAIndependently calculated from completed regular-session daily closes through October 13.
- 154.73
- October 13 intraday lowRegular-session intraday extreme for the date in the label; not a closing price.
- 153.51
- 20-session SMAIndependently calculated from completed regular-session daily closes through October 13; drawn as a moving line on the chart.
- 146.37
- 50-session SMAIndependently calculated from completed regular-session daily closes through October 13; drawn as a moving line on the chart.
- 144.22
Levels measured over 45 completed regular sessions from 2026-08-11 through 2026-10-13; moving averages use their named number of completed sessions. Earlier pre-market marks are separate observations through about 8:38 a.m. ET on October 13. A level measured over a different window can be a different number.

$MUMicron Technology, Inc. 953.19October 13 regular-session closeMicron closed at $953.19, off its $929.03 session low but below the $981.98 50-session average.
- 50-session SMAIndependently calculated from completed regular-session daily closes through October 13.
- 981.98
- Morning observed highSeparate pre-market one-minute-bar observation through about 8:38 a.m. ET on October 13; not a regular-session high.
- 968.70
- October 13 intraday highRegular-session intraday extreme for the date in the label; not a closing price.
- 953.60
- October 13 intraday lowRegular-session intraday extreme for the date in the label; not a closing price.
- 929.03
- 20-session SMAIndependently calculated from completed regular-session daily closes through October 13; drawn as a moving line on the chart.
- 1,042.78
Levels measured over 45 completed regular sessions from 2026-08-11 through 2026-10-13; moving averages use their named number of completed sessions. Earlier pre-market marks are separate observations through about 8:38 a.m. ET on October 13. A level measured over a different window can be a different number.

$SOFISoFi Technologies, Inc. 15.24October 13 regular-session closeSoFi closed at $15.24, above the approximate $15 range boundary and below the $16.15 20-session average.
- 20-session SMAIndependently calculated from completed regular-session daily closes through October 13.
- 16.15
- October 12 high (intraday)Regular-session intraday extreme for the date in the label; not a closing price.
- 15.68
- Approx. range boundaryApproximate broader range boundary since late March; not an exact session low or a forecast.
- 15.00
- 50-session SMAIndependently calculated from completed regular-session daily closes through October 13; drawn as a moving line on the chart.
- 17.32
Levels measured over 45 completed regular sessions from 2026-08-11 through 2026-10-13; moving averages use their named number of completed sessions. Earlier pre-market marks are separate observations through about 8:38 a.m. ET on October 13. A level measured over a different window can be a different number.
 456.46October 13 regular-session close
VLO gained 4.69% from the October 12 close to $456.46 at the October 13 regular-session close. Above the 50-day at $372.94 and above the 200-day at $269.74.
- 50-session SMACompleted regular-session daily closes through October 13.
- 372.94
- 200-session SMACompleted regular-session daily closes through October 13.
- 269.74
Levels measured over 90 completed regular sessions from 2026-06-05 through 2026-10-13; moving averages use their named number of completed sessions, and the change compares October 13 with October 12 closes. A level measured over a different window can be a different number.
 143.20October 13 regular-session close
ORCL gained 4.23% from the October 12 close to $143.20 at the October 13 regular-session close. Below the 50-day at $145.92 and below the 200-day at $161.18.
- 50-session SMACompleted regular-session daily closes through October 13.
- 145.92
- 200-session SMACompleted regular-session daily closes through October 13.
- 161.18
Levels measured over 90 completed regular sessions from 2026-06-05 through 2026-10-13; moving averages use their named number of completed sessions, and the change compares October 13 with October 12 closes. A level measured over a different window can be a different number.
 172.78October 13 regular-session close
SMTC gained 2.67% from the October 12 close to $172.78 at the October 13 regular-session close. Above the 50-day at $155.68 and above the 200-day at $120.85.
- 50-session SMACompleted regular-session daily closes through October 13.
- 155.68
- 200-session SMACompleted regular-session daily closes through October 13.
- 120.85
Levels measured over 90 completed regular sessions from 2026-06-05 through 2026-10-13; moving averages use their named number of completed sessions, and the change compares October 13 with October 12 closes. A level measured over a different window can be a different number.
 762.50October 13 regular-session close
META gained 2.63% from the October 12 close to $762.50 at the October 13 regular-session close. Above the 50-day at $646.90 and above the 200-day at $631.00.
- 50-session SMACompleted regular-session daily closes through October 13.
- 646.90
- 200-session SMACompleted regular-session daily closes through October 13.
- 631.00
Levels measured over 90 completed regular sessions from 2026-06-05 through 2026-10-13; moving averages use their named number of completed sessions, and the change compares October 13 with October 12 closes. A level measured over a different window can be a different number.
 47.07October 13 regular-session close
ASTS fell 8.54% from the October 12 close to $47.07 at the October 13 regular-session close. Below the 50-day at $62.37 and below the 200-day at $80.42.
- 50-session SMACompleted regular-session daily closes through October 13.
- 62.37
- 200-session SMACompleted regular-session daily closes through October 13.
- 80.42
Levels measured over 90 completed regular sessions from 2026-06-05 through 2026-10-13; moving averages use their named number of completed sessions, and the change compares October 13 with October 12 closes. A level measured over a different window can be a different number.
 91.63October 13 regular-session close
KOD fell 7.69% from the October 12 close to $91.63 at the October 13 regular-session close. Above the 50-day at $51.15 and above the 200-day at $37.99.
- 50-session SMACompleted regular-session daily closes through October 13.
- 51.15
- 200-session SMACompleted regular-session daily closes through October 13.
- 37.99
Levels measured over 90 completed regular sessions from 2026-06-05 through 2026-10-13; moving averages use their named number of completed sessions, and the change compares October 13 with October 12 closes. A level measured over a different window can be a different number.
 464.24October 13 regular-session close
AMAT fell 6.69% from the October 12 close to $464.24 at the October 13 regular-session close. Below the 50-day at $488.66 and above the 200-day at $436.52.
- 50-session SMACompleted regular-session daily closes through October 13.
- 488.66
- 200-session SMACompleted regular-session daily closes through October 13.
- 436.52
Levels measured over 90 completed regular sessions from 2026-06-05 through 2026-10-13; moving averages use their named number of completed sessions, and the change compares October 13 with October 12 closes. A level measured over a different window can be a different number.
 24.01October 13 regular-session close
S fell 6.43% from the October 12 close to $24.01 at the October 13 regular-session close. Above the 50-day at $22.45 and above the 200-day at $17.06.
- 50-session SMACompleted regular-session daily closes through October 13.
- 22.45
- 200-session SMACompleted regular-session daily closes through October 13.
- 17.06
Levels measured over 90 completed regular sessions from 2026-06-05 through 2026-10-13; moving averages use their named number of completed sessions, and the change compares October 13 with October 12 closes. A level measured over a different window can be a different number.
 248.61October 13 regular-session close
JNJ fell 5.73% from the October 12 close to $248.61 at the October 13 regular-session close. Below the 50-day at $265.37 and above the 200-day at $243.41.
- 50-session SMACompleted regular-session daily closes through October 13.
- 265.37
- 200-session SMACompleted regular-session daily closes through October 13.
- 243.41
Levels measured over 90 completed regular sessions from 2026-06-05 through 2026-10-13; moving averages use their named number of completed sessions, and the change compares October 13 with October 12 closes. A level measured over a different window can be a different number.

Get the week in one email
Every level we marked, and whether price reached it. Free, Sundays.
Subscribing signs you up for the free YieldTerminal Sunday recap, one email a week. Educational only, not financial advice. Unsubscribe any time.