← All daily levels

Daily Levels, Sun, 4 Oct 2026

Written Sunday 4 October. Every price is the 2 October close; Nike is the week's close.

Educational commentary, not investment advice.

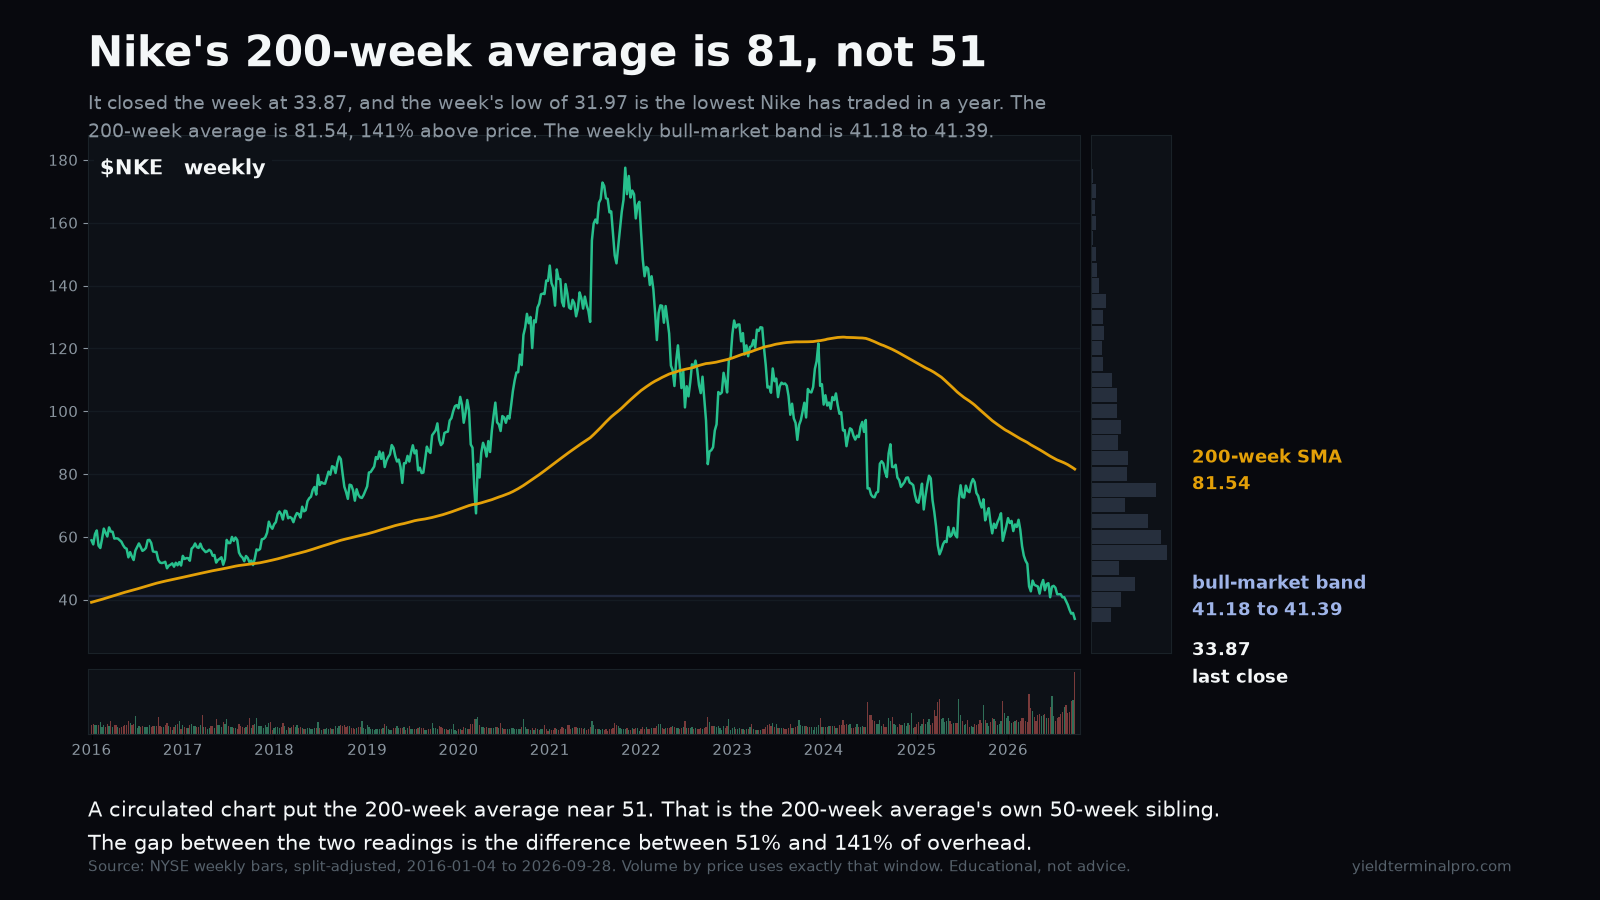
Four charts read off circulated TradingView screenshots. The moving-average legend on all four prints its values in the reverse of the order it labels them, so the figures taken at face value were wrong on every one. Nike is the expensive case: its 200-week average was read as 51 when it is 81.54, and 51.21 is the 50-week.

$METAMeta Platforms, Inc.
728.082 Oct close

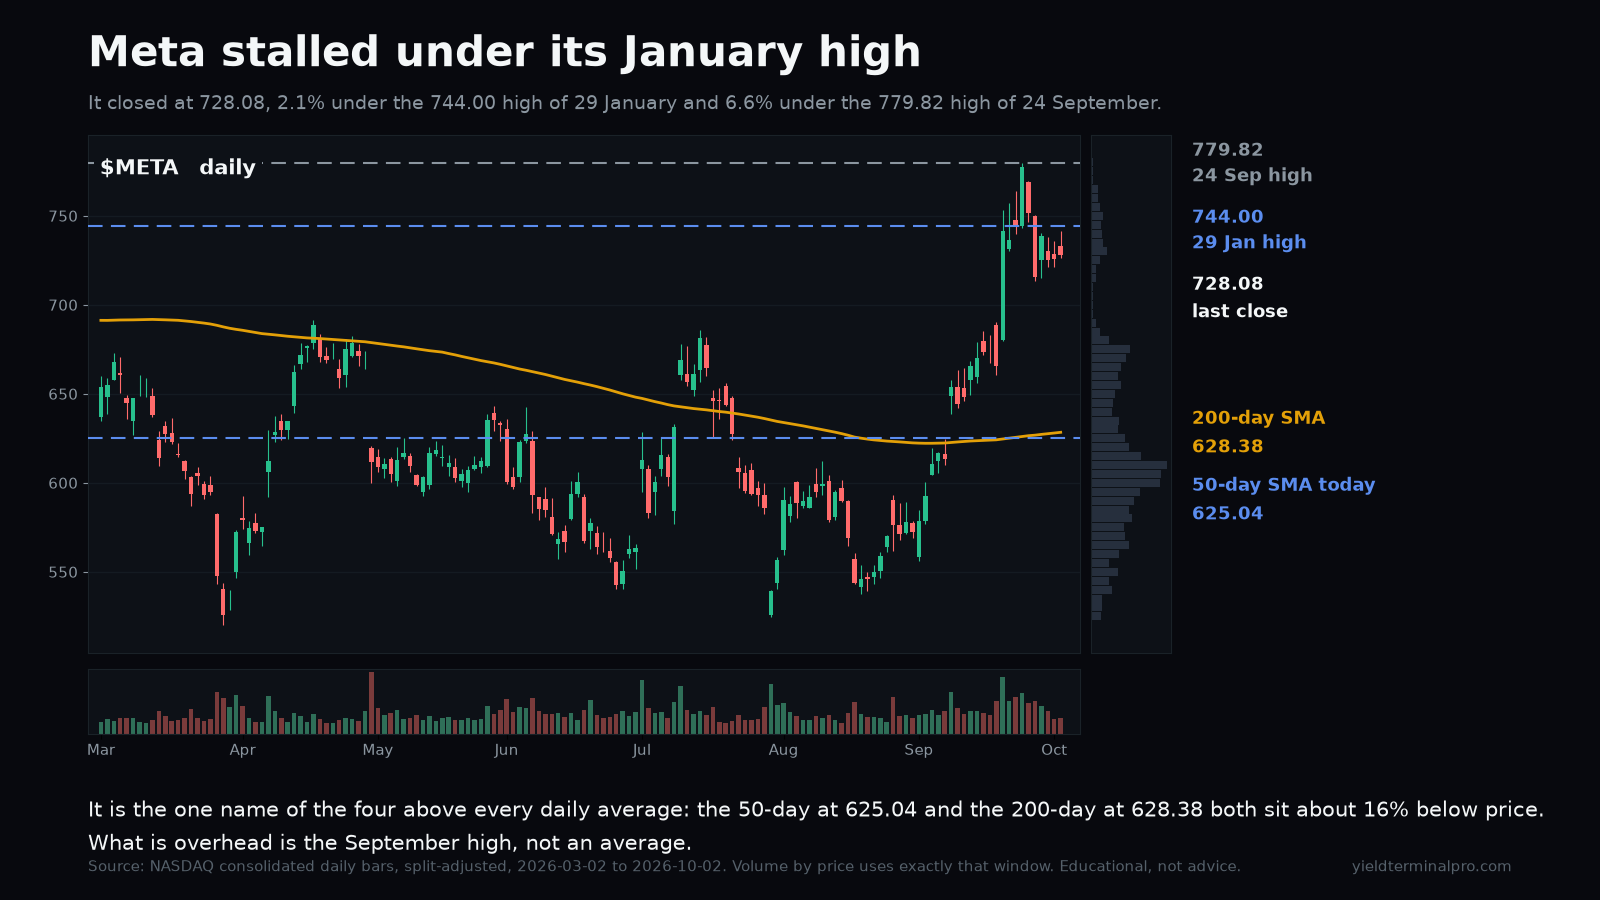
Meta is the only one of these four trading above every daily average, and it stopped just under the 744.00 high of 29 January. What sits overhead is the September high, not a moving average.

29 January highprice closed 2.1% below it
744.00
24 September highthe 52-week high; price is 6.6% below it
779.82
50-day simple moving averageprice is 16.5% above it
625.04
200-day simple moving averageprice is 15.9% above it
628.38

Levels measured over 2 March to 2 October 2026. A level measured over a different window can be a different number.
META chart
$NKENike, Inc.
33.872 Oct weekly close

Nike's 200-week simple moving average is 81.54, which is 141% above the price. A circulated chart put that average near 51; 51.21 is the 50-week average, not the 200-week. The week's low of 31.97 is the lowest Nike has traded in a year.

200-week simple moving average141% above price; the level a circulated chart put near 51
81.54
50-week simple moving averagethis is the figure that was mistaken for the 200-week
51.21
Weekly bull-market band20-week SMA to 21-week EMA, a generic indicator
41.18 to 41.39
52-week lowthe week's low, set 2 October 2026
31.97

Levels measured over 4 January 2016 to 28 September 2026, weekly. A level measured over a different window can be a different number.

NKE chart
$CRWVCoreWeave, Inc.
89.622 Oct close

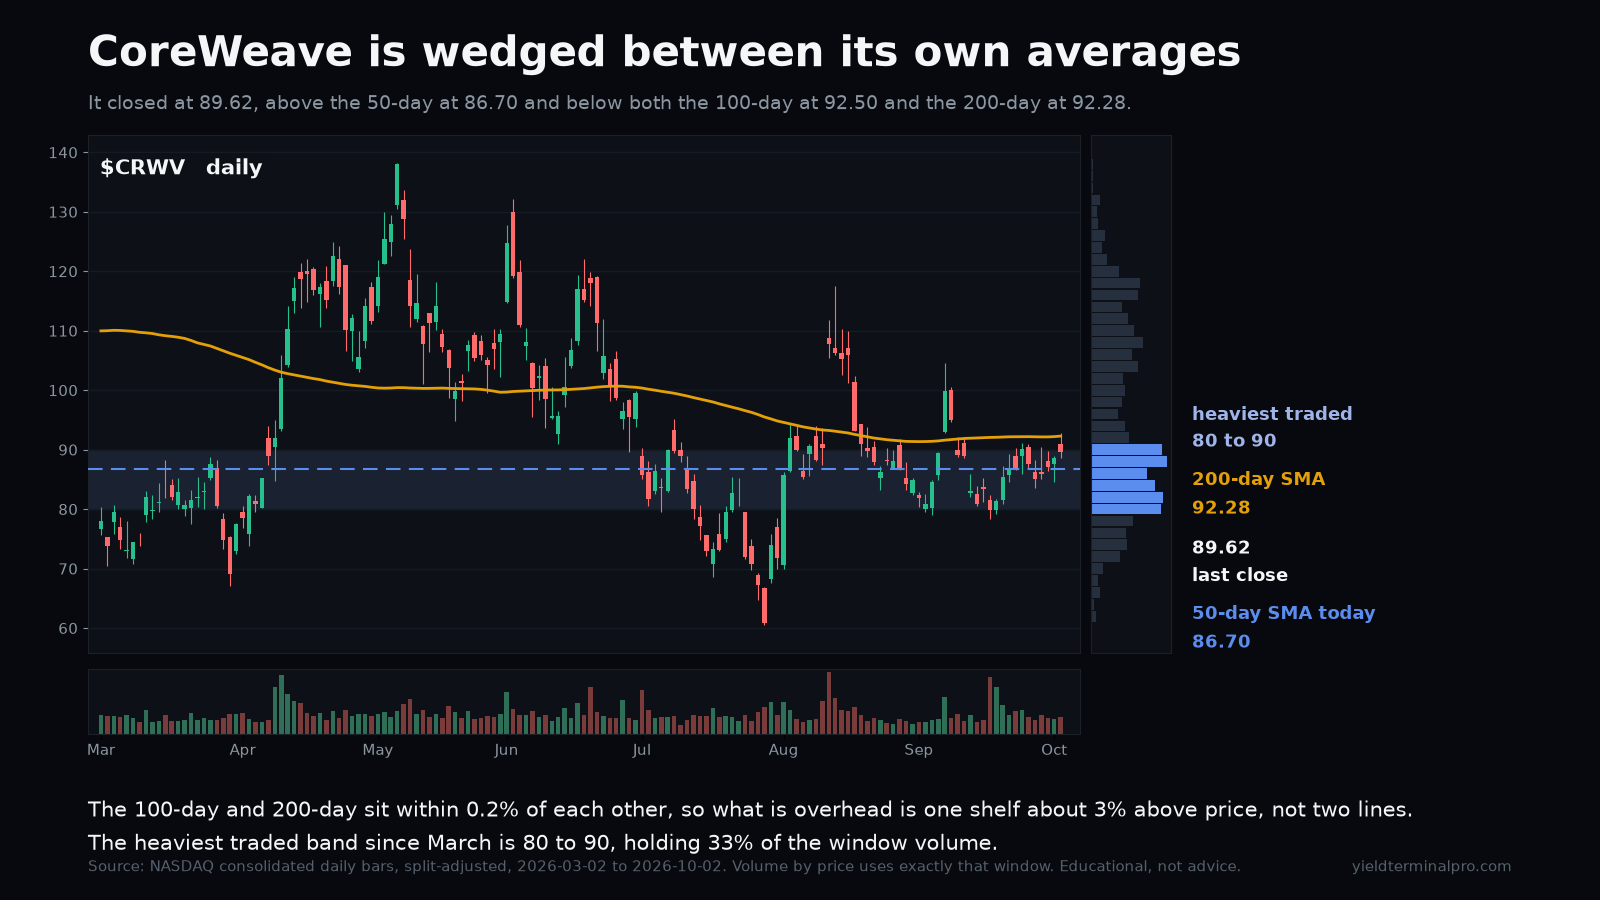
CoreWeave closed between its own averages: above the 50-day at 86.70 and below both the 100-day at 92.50 and the 200-day at 92.28. Those two sit 0.2% apart, so what is overhead is a single shelf about 3% above price rather than two separate lines.

50-day simple moving averagedrawn as 85.24 on the circulated chart
86.70
200-day simple moving average2.9% above price
92.28
100-day simple moving average3.2% above price, 0.2% from the 200-day
92.50
3 September lowthe last swing low beneath price
79.03

Levels measured over 2 March to 2 October 2026. A level measured over a different window can be a different number.
CRWV chart
$ADBEAdobe Inc.
237.692 Oct close

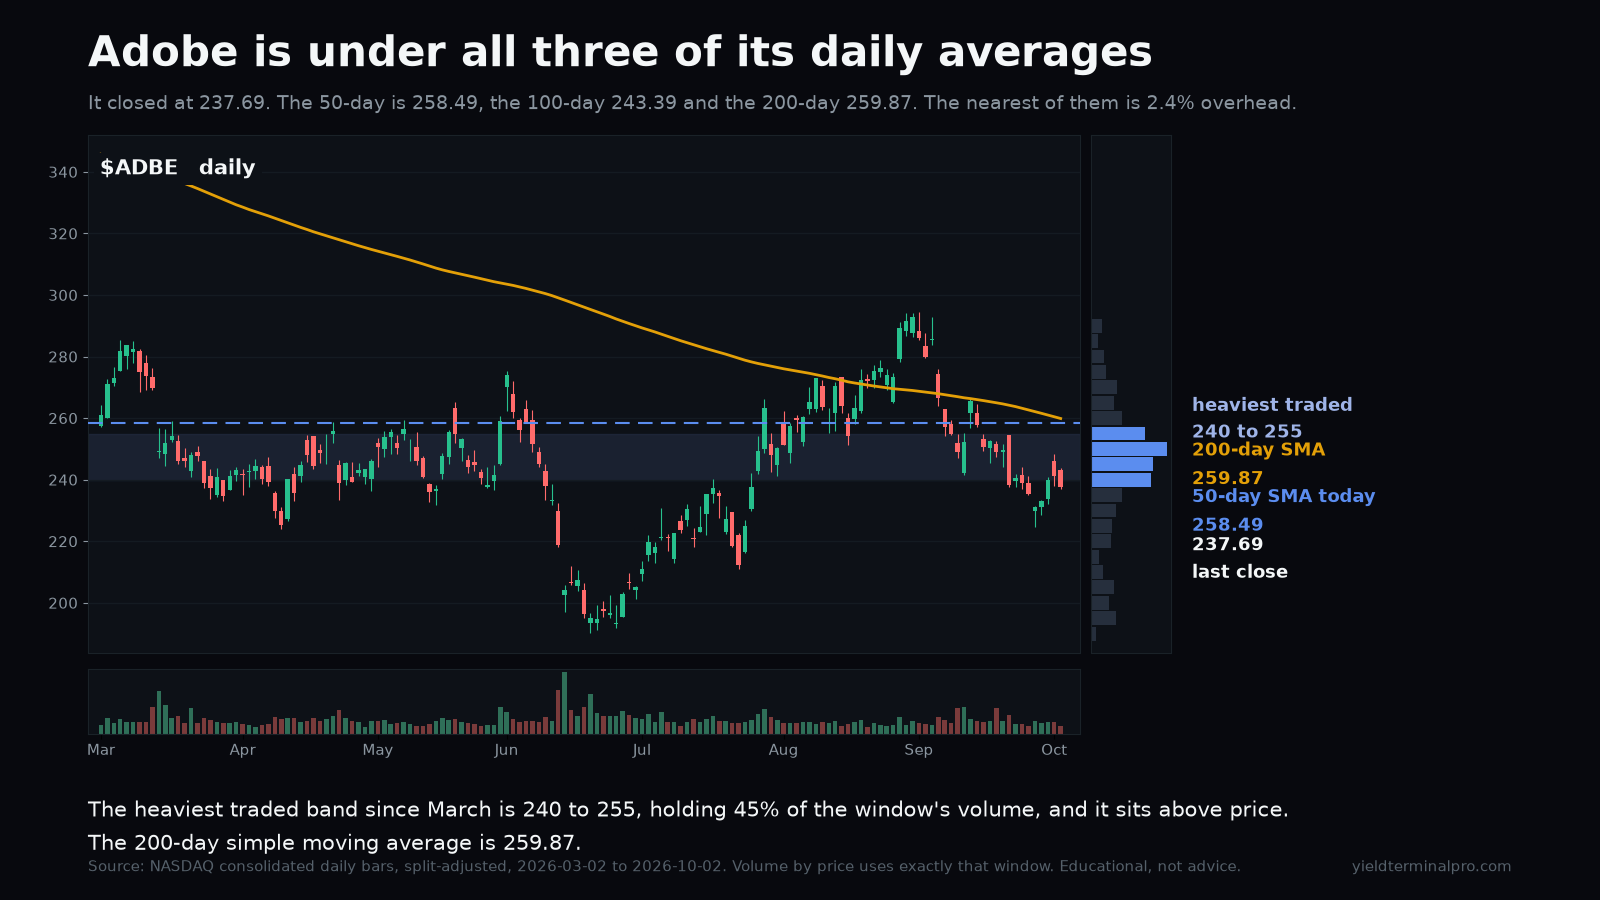
Adobe closed under all three of its daily averages, and the nearest of them is only 2.4% overhead. The heaviest traded band since March, 240 to 255, holds 45% of the window's volume and sits entirely above the close.

100-day simple moving averagethe nearest average overhead, 2.4% above price
243.39
50-day simple moving average8.0% above price
258.49
200-day simple moving average8.5% above price
259.87
Heaviest traded band45% of the window's volume, all of it above the close
240.00 to 255.00

Levels measured over 2 March to 2 October 2026. A level measured over a different window can be a different number.
ADBE chart

Get the week in one email

Every level we marked, and whether price reached it. Free, Sundays.

Subscribing signs you up for the free YieldTerminal Sunday recap, one email a week. Educational only, not financial advice. Unsubscribe any time.

See the full disclaimer.