← All daily levels

Daily Levels, Sat, 3 Oct 2026

Written Saturday 3 October. Every price is the 2 October close.

Educational commentary, not investment advice.

Four charts, one claim each, written against Friday's closes. Three of the four sit under their 200-day average. Western Digital is the one that closed back above its own, and only after the session low had already gone through it.

$WDCWestern Digital Corp
415.292 Oct close

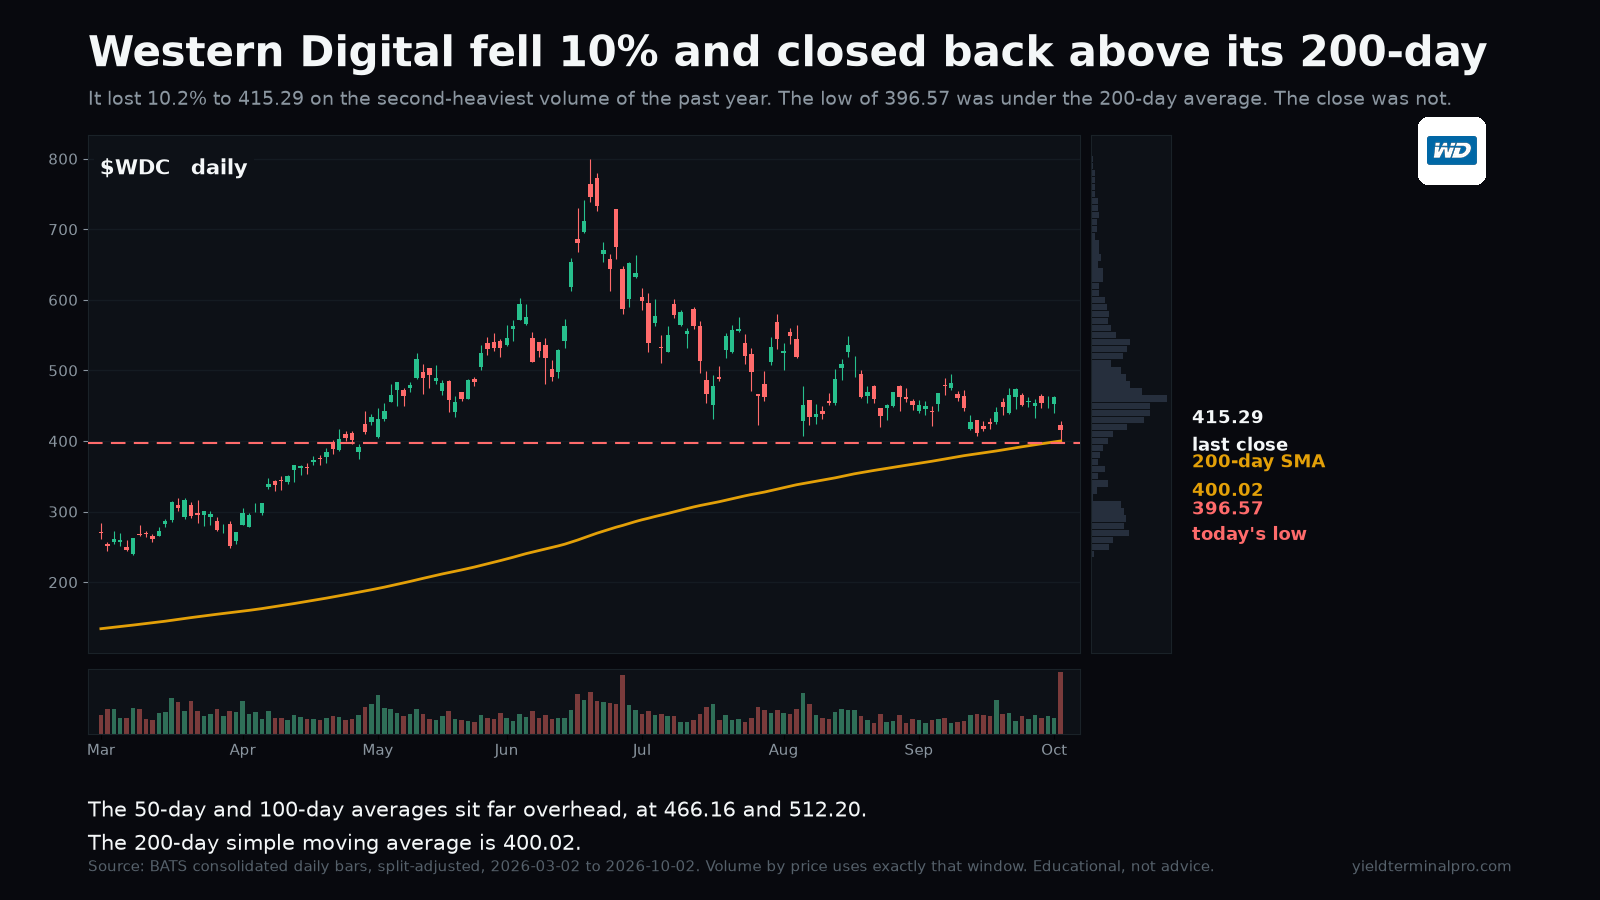
Friday's low went through the 200-day average and the close came back above it, on the second-heaviest volume of the past year. One session above a line is a hold, not a repair, and the 50-day and 100-day both sit far overhead.

200-day simple moving averagethe low broke it, the close did not
400.02
2 October session lowbelow the 200-day
396.57
50-day simple moving averageprice is 11% below it
466.16
100-day simple moving averageprice is 19% below it
512.20

Levels measured over 2 March to 2 October 2026. A level measured over a different window can be a different number.
WDC chartSee the chart on X →
$TTWOTake-Two Interactive Software Inc
202.732 Oct close

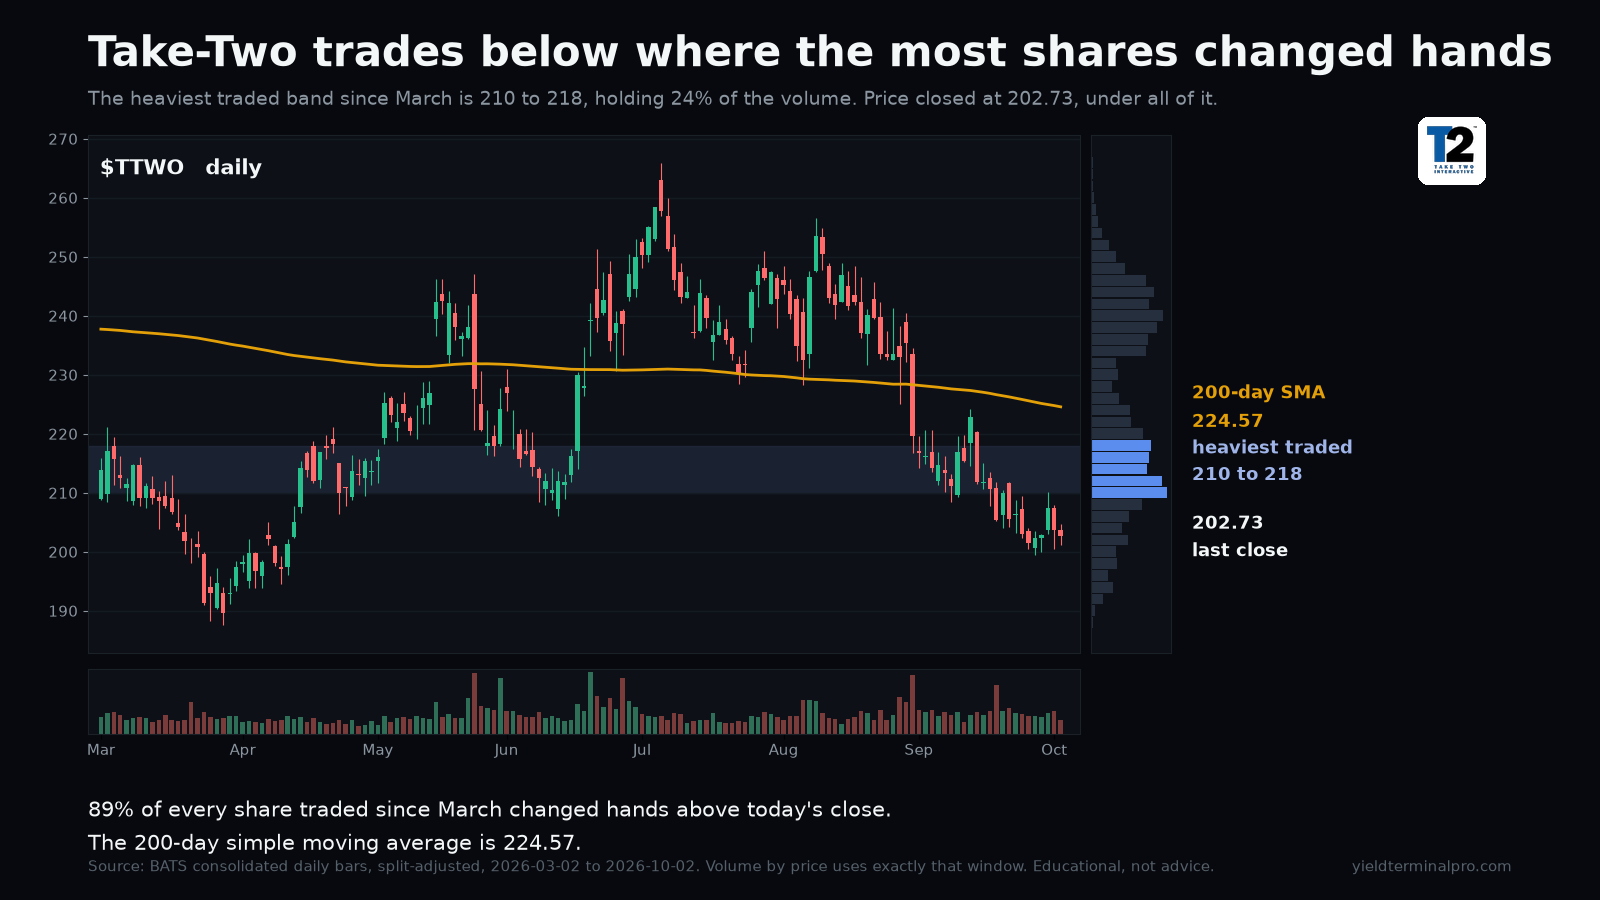
Take-Two closed below the band where the most shares have changed hands since March, and 89% of the window's volume changed hands above that close. What sits overhead is supply, not support.

Heaviest traded band24% of the window's volume, all of it above price
210.00 to 218.00
200-day simple moving averageprice is 11% below it
224.57
52-week lowprice is 8% above it
187.63

Levels measured over 2 March to 2 October 2026. A level measured over a different window can be a different number.

TTWO chartSee the chart on X →
$TSLATesla Inc
370.592 Oct close

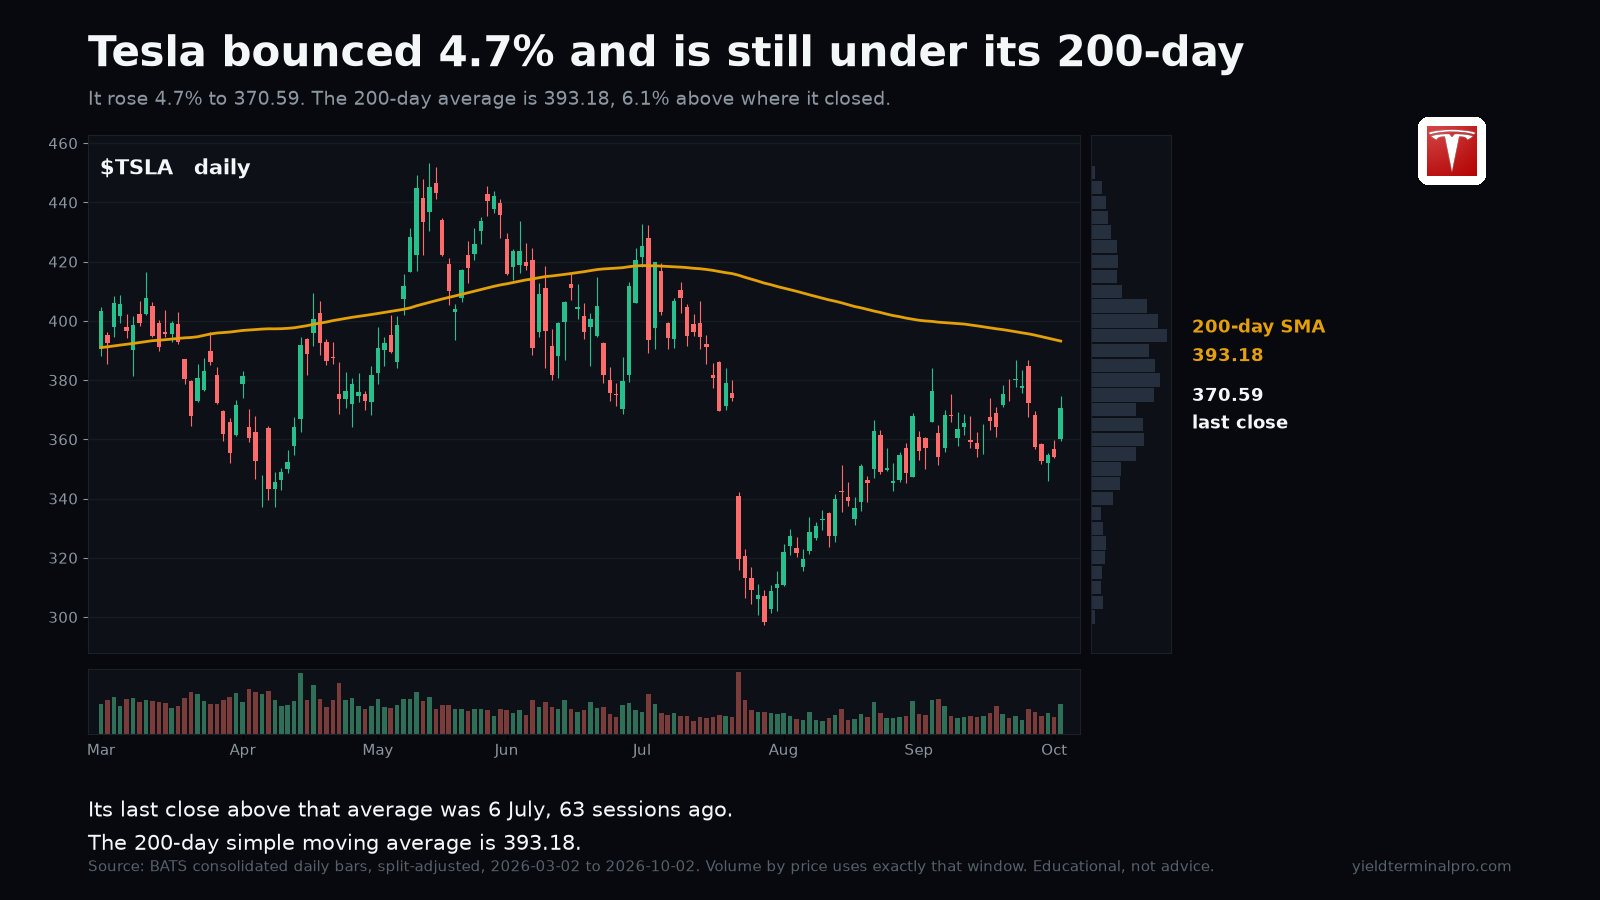
Tesla rose 4.7% and is still under its 200-day average. Its last close above that line was 6 July, 63 sessions earlier, and it finished 6% short of it. Nearly three months under one line is a trend, not a dip.

200-day simple moving averageprice is 6.1% below it; last close above was 6 July 2026, 63 sessions earlier
393.18
2 October session lowthe day opened the bounce from here
359.42
52-week lowprice is 25% above it
297.38

Levels measured over 2 March to 2 October 2026. A level measured over a different window can be a different number.

TSLA chartSee the chart on X →
$VSTVistra Corp
140.022 Oct close

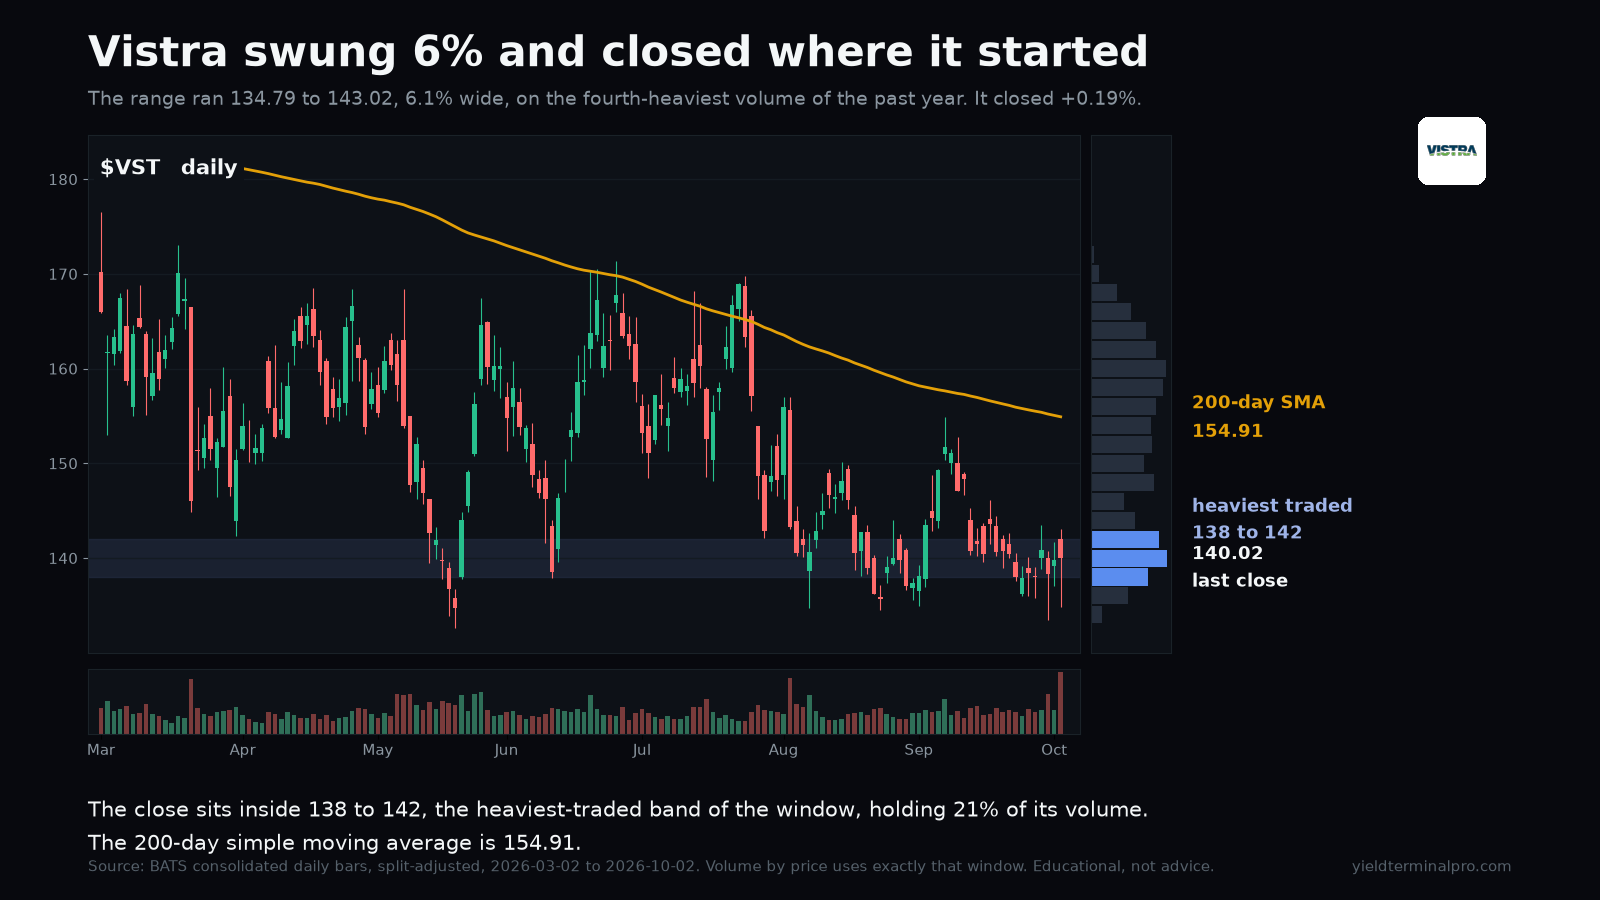
Vistra travelled a 6.1% range on the fourth-heaviest volume of the past year and closed 0.19% higher, inside the heaviest-traded band of the window. All of that movement bought no net change in position.

2 October session range6.1% wide, fourth-heaviest volume of the past year
134.79 to 143.02
Heaviest traded band21% of the window's volume; the close sits inside it
138.00 to 142.00
200-day simple moving averageprice is 10% below it
154.91

Levels measured over 2 March to 2 October 2026. A level measured over a different window can be a different number.

VST chartSee the chart on X →

Get the week in one email

Every level we marked, and whether price reached it. Free, Sundays.

Subscribing signs you up for the free YieldTerminal Sunday recap, one email a week. Educational only, not financial advice. Unsubscribe any time.

See the full disclaimer.