Later recorded SPY premarket trading broke the completed October 22 low. The preserved SPY chart shows an earlier premarket observation, and a separate note records the later $760.58 check. Other dated levels and issuer results retain their recorded-session bases.
$SPYSPY — October 23 Morning Watch — daily 762.56Earlier recorded October 23 premarket observationEarlier recorded October 23 premarket $762.56 against completed October 22 close $763.96 and low $761.17. The later verified $760.58 observation is recorded separately; it is not plotted on this earlier chart.
- October 22 intraday low
- 761.17
- October 22 intraday high
- 767.71
- 20-day SMA through October 22
- 770.72
- 50-day SMA through October 22
- 768.17
- 200-day SMA through October 22
- 726.65
- October 21 intraday low
- 768.40
Levels measured over Completed US regular-session history through October 22. Recorded October 23 premarket observations are separate and appear only where corroborated.. A level measured over a different window can be a different number.
 See the chart on X →
$SPYSPY — October 23 Morning Watch — later premarket update 760.58Later recorded October 23 premarket observation; separate from completed daily candleLater recorded October 23 Nasdaq premarket $760.58 (Yahoo near $760.51), below the completed October 22 intraday low $761.17. That low now needs a reclaim, then a daily retest and close above. This later point is not plotted in the preserved earlier chart.
- October 22 intraday low; reclaim test
- 761.17
- October 22 regular close
- 763.96
- 50-day SMA through October 22
- 768.17
- 20-day SMA through October 22
- 770.72
Levels measured over Completed regular-session history through October 22. Earlier chart point $762.56 and later observed $760.58 are separate recorded premarket observations; neither enters the October 22 candle.. A level measured over a different window can be a different number.
See the chart on X →$QQQQQQ — October 23 Morning Watch — daily 704.84October 23 recorded premarket observationSeparate October 23 premarket 704.84 versus completed October 22 close 704.47; daily bars remain completed through October 22.
- October 22 intraday low
- 701.90
- October 22 intraday high
- 715.43
- 20-day SMA through October 22
- 737.24
- 50-day SMA through October 22
- 726.37
- 200-day SMA through October 22
- 676.89
- October 21 intraday low
- 719.71
Levels measured over Completed US regular-session history through October 22. Recorded October 23 premarket observations are separate and appear only where corroborated.. A level measured over a different window can be a different number.
 See the chart on X →
$QQQQQQ — October 23 Morning Watch — closing context 704.47October 22 completed regular-session closeCompleted closing decline October 6 to October 16, separate rebound to October 21, then a new lower close October 22. October 23 premarket is excluded.
Levels measured over Completed regular-session closes only; premarket excluded.. A level measured over a different window can be a different number.
 See the chart on X →
$MXLMXL — October 23 Morning Watch — daily 65.28October 22 completed regular-session closeNo verified October 23 premarket quote shown; completed October 22 close 65.28.
- October 22 intraday low
- 63.49
- October 22 intraday high
- 71.60
- 20-day SMA through October 22
- 88.73
- 50-day SMA through October 22
- 77.83
- 200-day SMA through October 22
- 58.42
- October 21 intraday low
- 73.58
Levels measured over Completed US regular-session history through October 22. Recorded October 23 premarket observations are separate and appear only where corroborated.. A level measured over a different window can be a different number.
 See the chart on X →
$NEMNEM — October 23 Morning Watch — daily 114.11October 22 completed regular-session closeNo verified October 23 premarket quote shown; completed October 22 close 114.11.
- October 22 intraday low
- 111.41
- October 22 intraday high
- 114.31
- 20-day SMA through October 22
- 116.20
- 50-day SMA through October 22
- 121.77
- 200-day SMA through October 22
- 112.45
- October 21 intraday low
- 115.44
- October 14 intraday low
- 109.84
Levels measured over Completed US regular-session history through October 22. Recorded October 23 premarket observations are separate and appear only where corroborated.. A level measured over a different window can be a different number.
 See the chart on X →
$WDCWDC — October 23 Morning Watch — daily 341.96October 23 recorded premarket observationSeparate October 23 premarket 341.96 versus completed October 22 close 354.19; daily bars remain completed through October 22. The recorded premarket point was below the October 22 low.
- October 22 intraday low
- 348.23
- October 22 intraday high
- 367.34
- 20-day SMA through October 22
- 400.70
- 50-day SMA through October 22
- 435.87
- 200-day SMA through October 22
- 413.93
- October 21 intraday low
- 367.13
Levels measured over Completed US regular-session history through October 22. Recorded October 23 premarket observations are separate and appear only where corroborated.. A level measured over a different window can be a different number.
 See the chart on X →
$BEBE — October 23 Morning Watch — daily 208.80October 23 recorded premarket observationSeparate October 23 premarket 208.80 versus completed October 22 close 217.77; daily bars remain completed through October 22. The later recorded premarket point was below the October 22 low.
- October 22 intraday low
- 210.74
- October 22 intraday high
- 229.91
- 20-day SMA through October 22
- 262.07
- 50-day SMA through October 22
- 249.16
- 200-day SMA through October 22
- 218.86
- October 21 intraday low
- 229.30
Levels measured over Completed US regular-session history through October 22. Recorded October 23 premarket observations are separate and appear only where corroborated.. A level measured over a different window can be a different number.
 See the chart on X →
$MXLMXL — October 23 Morning Watch — earnings 65.28October 22 completed regular-session close; graphic retains its stated financial periodSeptember 2026 quarter issuer financial results; keep reported results, cash flows and future guidance in their separate scopes.
Levels measured over Issuer financial period shown on chart; completed price history through October 22. No live quote implied.. A level measured over a different window can be a different number.
 See the chart on X →
$MXLMXL — October 23 Morning Watch — cash and outlook 65.28October 22 completed regular-session close; graphic retains its stated financial periodSeptember 2026 quarter issuer financial results; keep reported results, cash flows and future guidance in their separate scopes.
Levels measured over Issuer financial period shown on chart; completed price history through October 22. No live quote implied.. A level measured over a different window can be a different number.
 See the chart on X →
$NEMNEM — October 23 Morning Watch — earnings 114.11October 22 completed regular-session close; graphic retains its stated financial periodSeptember 2026 quarter issuer financial results; keep reported results, cash flows and future guidance in their separate scopes.
Levels measured over Issuer financial period shown on chart; completed price history through October 22. No live quote implied.. A level measured over a different window can be a different number.
 See the chart on X →
$NEMNEM — October 23 Morning Watch — cash and outlook 114.11October 22 completed regular-session close; graphic retains its stated financial periodSeptember 2026 quarter issuer financial results; keep reported results, cash flows and future guidance in their separate scopes.
Levels measured over Issuer financial period shown on chart; completed price history through October 22. No live quote implied.. A level measured over a different window can be a different number.
 See the chart on X →
$WDCWDC — October 23 Morning Watch — earnings 354.19October 22 completed regular-session close; graphic retains its stated financial periodfiscal 2027 first quarter issuer financial results; keep reported results, cash flows and future guidance in their separate scopes.
Levels measured over Issuer financial period shown on chart; completed price history through October 22. No live quote implied.. A level measured over a different window can be a different number.
 See the chart on X →
$WDCWDC — October 23 Morning Watch — cash and outlook 354.19October 22 completed regular-session close; graphic retains its stated financial periodfiscal 2027 first quarter issuer financial results; keep reported results, cash flows and future guidance in their separate scopes.
Levels measured over Issuer financial period shown on chart; completed price history through October 22. No live quote implied.. A level measured over a different window can be a different number.
 See the chart on X →
$BEBE — October 23 Morning Watch — earnings 217.77October 22 completed regular-session close; graphic retains its stated financial periodSeptember 2026 quarter issuer financial results; keep reported results, cash flows and future guidance in their separate scopes.
Levels measured over Issuer financial period shown on chart; completed price history through October 22. No live quote implied.. A level measured over a different window can be a different number.
 See the chart on X →
$BEBE — October 23 Morning Watch — cash and outlook 217.77October 22 completed regular-session close; graphic retains its stated financial periodSeptember 2026 quarter issuer financial results; keep reported results, cash flows and future guidance in their separate scopes.
Levels measured over Issuer financial period shown on chart; completed price history through October 22. No live quote implied.. A level measured over a different window can be a different number.
 See the chart on X →
$AXPAmerican Express — October 23 midday chart 312.93Recorded October 23 regular-session observation; separate from completed daily candleRecorded $312.93 regular-session observation below completed October 22 low $322.47 and below the 50- and 200-day averages. The dated low needs a reclaim.
- October 22 intraday low; reclaim test
- 322.47
- October 22 intraday high
- 326.27
- 20-day SMA through October 22
- 309.90
- 50-day SMA through October 22
- 319.80
- 200-day SMA through October 22
- 327.62
Levels measured over Completed US regular-session candles and SMAs through October 22; October 23 quote separate. A level measured over a different window can be a different number.
 See the chart on X →
$SLBSLB — October 23 midday chart 53.29Recorded October 23 regular-session observation; separate from completed daily candleRecorded $53.29 regular-session observation above completed October 22 high $51.16 and above the 50- and 200-day averages. The dated high is a nearby retest level.
- October 22 intraday high; nearby retest
- 51.16
- October 22 regular-session close
- 49.55
- 20-day SMA through October 22
- 49.44
- 50-day SMA through October 22
- 52.45
- 200-day SMA through October 22
- 51.20
Levels measured over Completed US regular-session candles and SMAs through October 22; October 23 quote separate. A level measured over a different window can be a different number.
 See the chart on X →
$NEMNewmont — October 23 midday chart 109.78Recorded October 23 regular-session observation; separate from completed daily candleRecorded $109.78 regular-session observation below completed October 22 low $111.41 and below the 50- and 200-day averages. The dated low needs a reclaim.
- October 22 intraday low; reclaim test
- 111.41
- October 22 intraday high
- 114.31
- 20-day SMA through October 22
- 116.20
- 50-day SMA through October 22
- 121.77
- 200-day SMA through October 22
- 112.45
Levels measured over Completed US regular-session candles and SMAs through October 22; October 23 quote separate. A level measured over a different window can be a different number.
 See the chart on X →
$NVDANvidia — October 23 midday chart 211.60Recorded October 23 regular-session observation; separate from completed daily candleRecorded $211.60 regular-session observation below the completed 50-day average $222.77, above the 200-day average $203.56, and between the October 22 intraday low $211.26 and high $218.88.
- October 22 intraday low
- 211.26
- October 22 intraday high
- 218.88
- 20-day SMA through October 22
- 226.25
- 50-day SMA through October 22
- 222.77
- 200-day SMA through October 22
- 203.56
Levels measured over Completed US regular-session candles and SMAs through October 22; October 23 quote separate. A level measured over a different window can be a different number.
 See the chart on X →
$MXLMaxLinear — October 23 midday chart 63.17Recorded October 23 regular-session observation; separate from completed daily candleSeparate October 23 regular-session $63.17, below completed October 22 low $63.49, below the 50-day $77.83 and above the 200-day $58.42. A daily reclaim of the old low would matter.
- October 22 intraday low; reclaim test
- 63.49
- October 22 intraday high
- 71.60
- 20-day SMA through October 22
- 88.73
- 50-day SMA through October 22
- 77.83
- 200-day SMA through October 22
- 58.42
- October 22 regular close
- 65.28
Levels measured over Completed US regular-session candles and SMAs through October 22; October 23 observed quote shown separately. A level measured over a different window can be a different number.
 See the chart on X →
$WDCWDC - October 23 WDC-earnings 354.19October 22 completed regular close; price reference only for a financial or comparative chartFiscal-first-quarter revenue reached $4.381 billion and GAAP operating income $2.046 billion; the prior-year operating result was also positive.
Levels measured over Western Digital fiscal Q1 2027, three months ended October 2, 2026. A level measured over a different window can be a different number.
 See the chart on X →
$WDCWDC - October 23 WDC-cash-outlook 354.19October 22 completed regular close; price reference only for a financial or comparative chartFiscal-first-quarter operating cash of $1.604 billion less $227 million of net property and equipment purchases yielded $1.377 billion of issuer-defined free cash flow.
Levels measured over Western Digital fiscal Q1 2027, three months ended October 2, 2026. A level measured over a different window can be a different number.
 See the chart on X →
$WDCWDC - October 23 WDC-daily 344.89Recorded, corroborated October 23 regular-session observation; separate from completed daily candlesRecorded October 23 US regular-session observation $344.89 (-2.63%) was below the October 22 intraday low $348.23 and completed 20-, 50- and 200-session averages; a daily retest and close above the old low is needed for a reclaim.
- 20-session SMA through October 22
- 400.70
- 50-session SMA through October 22
- 435.87
- 200-session SMA through October 22
- 413.93
- October 22 intraday high
- 367.34
- October 22 intraday low
- 348.23
Levels measured over Completed daily history through October 22; separate October 23 regular observation. A level measured over a different window can be a different number.
 See the chart on X →
$WDCWDC - October 23 WDC-six-month-context 354.19October 22 completed regular close; October 23 observation is excluded from the completed closing-price series and shown separatelyThe full dated decline and later rebound are separate phases; the October 23 observation is excluded from the completed-close context.
Levels measured over Completed daily closes through October 22; separate later regular-session observation. A level measured over a different window can be a different number.
 See the chart on X →
$BEBE - October 23 BE-VRT-income 217.77October 22 completed regular close; price reference only for a financial or comparative chartBloom's September Q3 and Vertiv's June Q2 are different reporting windows; both latest reports show GAAP operating profit, but raw totals do not rank the shares.
Levels measured over Bloom Q3 ended September 30; Vertiv Q2 ended June 30; prior-year comparisons are issuer-specific. A level measured over a different window can be a different number.
 See the chart on X →
$VRTVRT - October 23 BE-VRT-income 195.59October 22 completed regular close; price reference only for a financial or comparative chartBloom's September Q3 and Vertiv's June Q2 are different reporting windows; both latest reports show GAAP operating profit, but raw totals do not rank the shares.
Levels measured over Bloom Q3 ended September 30; Vertiv Q2 ended June 30; prior-year comparisons are issuer-specific. A level measured over a different window can be a different number.
See the chart on X →$BEBE - October 23 BE-VRT-cash 217.77October 22 completed regular close; price reference only for a financial or comparative chartBloom's Q3 operating cash was negative $27.1 million; operating cash less $153.5 million of property and equipment purchases was negative $180.6 million of our arithmetic, not issuer-defined free cash flow.
Levels measured over Bloom Q3 ended September 30; Vertiv Q2 ended June 30; cash definitions differ. A level measured over a different window can be a different number.
 See the chart on X →
$VRTVRT - October 23 BE-VRT-cash 195.59October 22 completed regular close; price reference only for a financial or comparative chartVertiv's Q2 operating cash was $1.100 billion and its issuer-defined adjusted free cash flow was $925.3 million; Bloom's cash period and definition differ.
Levels measured over Bloom Q3 ended September 30; Vertiv Q2 ended June 30; cash definitions differ. A level measured over a different window can be a different number.
See the chart on X →$BEBE - October 23 BE-daily 191.33Recorded, corroborated October 23 regular-session observation; separate from completed daily candlesRecorded October 23 US regular-session observation $191.33 (-12.14%) was below the October 22 intraday low $210.74 and completed 20-, 50- and 200-session averages; that low now needs a daily reclaim.
- 20-session SMA through October 22
- 262.07
- 50-session SMA through October 22
- 249.16
- 200-session SMA through October 22
- 218.86
- October 22 intraday high
- 229.91
- October 22 intraday low
- 210.74
Levels measured over Completed daily history through October 22; separate October 23 regular observation. A level measured over a different window can be a different number.
 See the chart on X →
$VRTVRT - October 23 VRT-daily 195.59Recorded, corroborated October 23 regular-session observation; separate from completed daily candlesRecorded October 23 US regular-session observation $195.59 was roughly unchanged from the October 22 completed close, inside its $193.14-$204.00 intraday range and below completed 20-, 50- and 200-session averages.
- 20-session SMA through October 22
- 233.15
- 50-session SMA through October 22
- 249.56
- 200-session SMA through October 22
- 268.96
- October 22 intraday high
- 204.00
- October 22 intraday low
- 193.14
Levels measured over Completed daily history through October 22; separate October 23 regular observation. A level measured over a different window can be a different number.
 See the chart on X →
$BEBE - October 23 BE-VRT-relative 217.77October 22 completed regular close; price reference only for a financial or comparative chartBE and VRT are compared across the same completed closing-price window; dividends are excluded. October 23 observations are excluded from that closing-price series and shown separately.
Levels measured over Identical completed daily closing dates ending October 22; price-only index, first close rebased to 100. A level measured over a different window can be a different number.
 See the chart on X →
$VRTVRT - October 23 BE-VRT-relative 195.59October 22 completed regular close; price reference only for a financial or comparative chartBE and VRT are compared across the same completed closing-price window; dividends are excluded. October 23 observations are excluded from that closing-price series and shown separately.
Levels measured over Identical completed daily closing dates ending October 22; price-only index, first close rebased to 100. A level measured over a different window can be a different number.
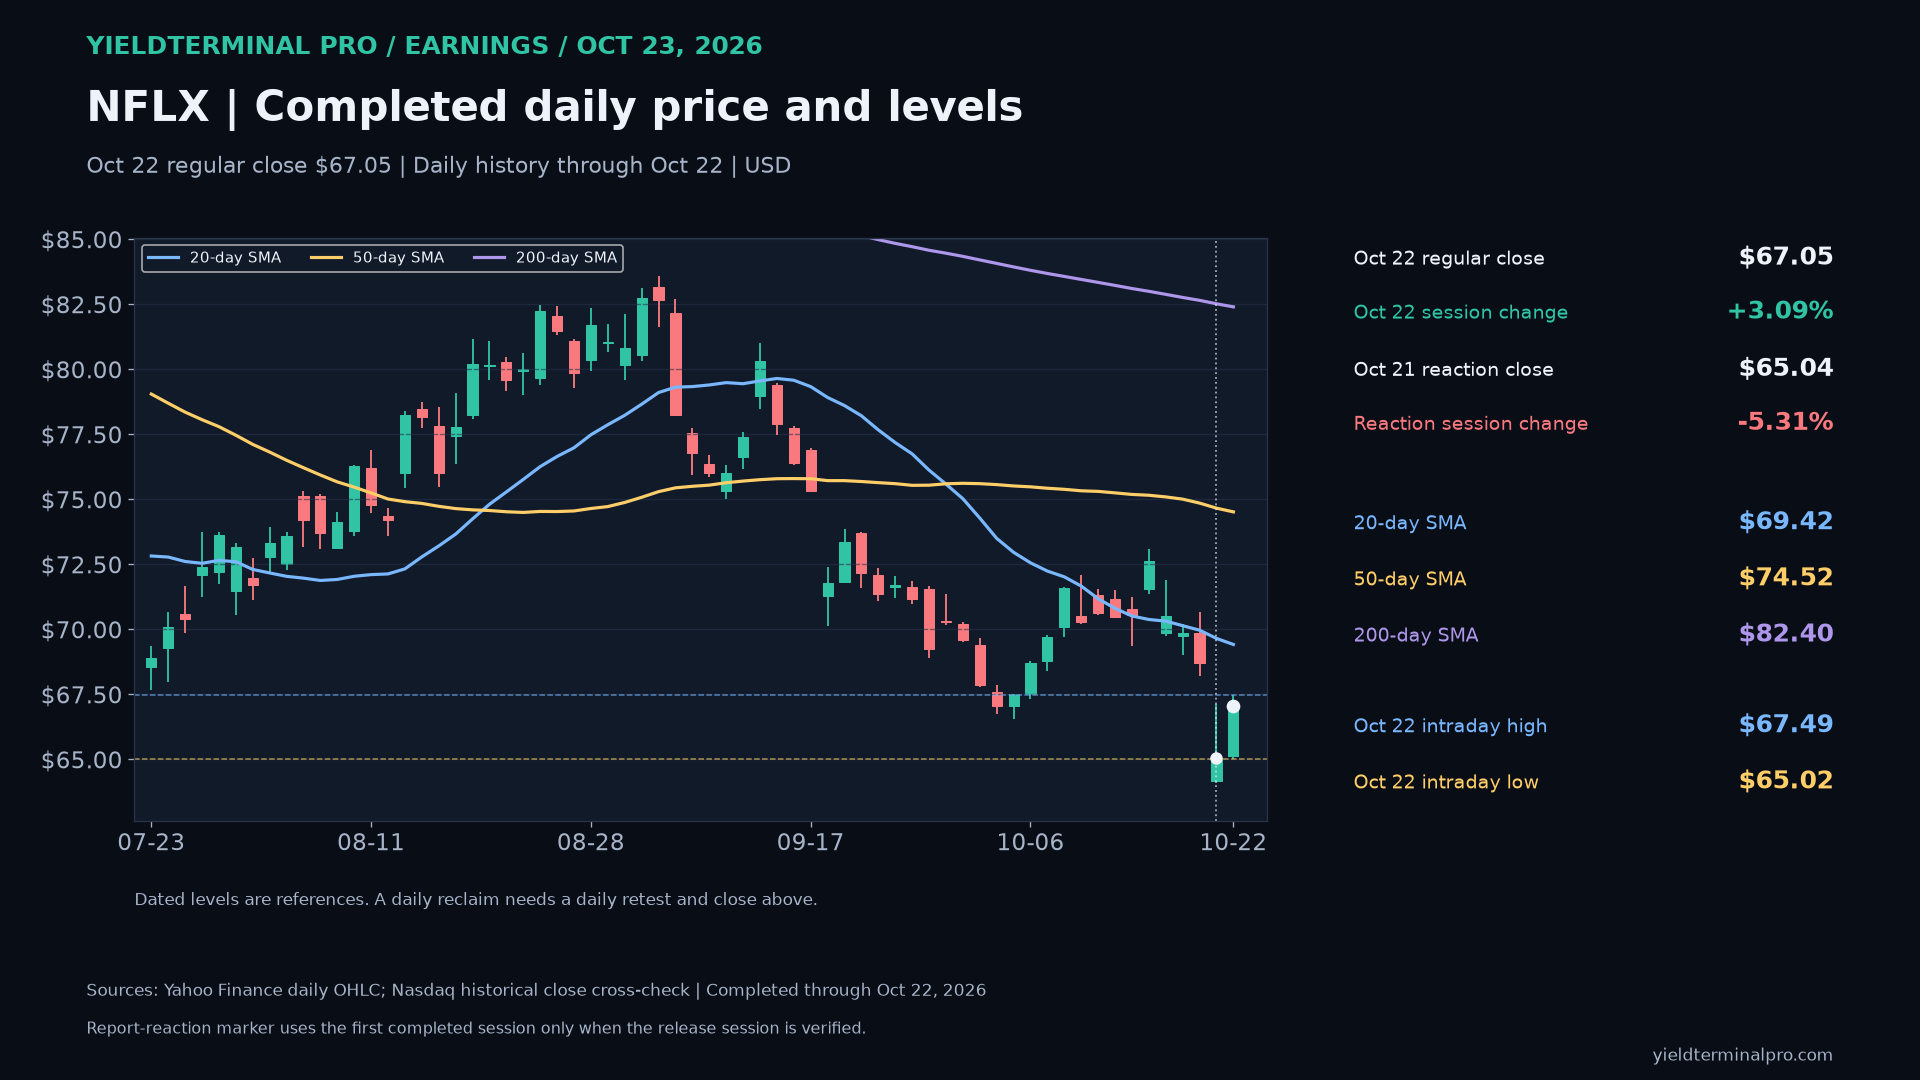
See the chart on X →$NFLXNetflix, Inc. — October 23 earnings review 67.05October 22 completed regular-session closeNFLX closed October 22 at $67.05, below its 50-day average ($74.52) and below its 200-day average ($82.40). The October 22 high ($67.49) and low ($65.02) are dated reference levels. This is completed daily history, not an October 23 quote.
- October 22 intraday high
- 67.49
- October 22 intraday low
- 65.02
- 50-day SMA through October 22
- 74.52
- 200-day SMA through October 22
- 82.40
Levels measured over Completed US regular-session daily history through October 22, 2026. Daily averages use completed closes; earnings result and price session are separate dated evidence.. A level measured over a different window can be a different number.
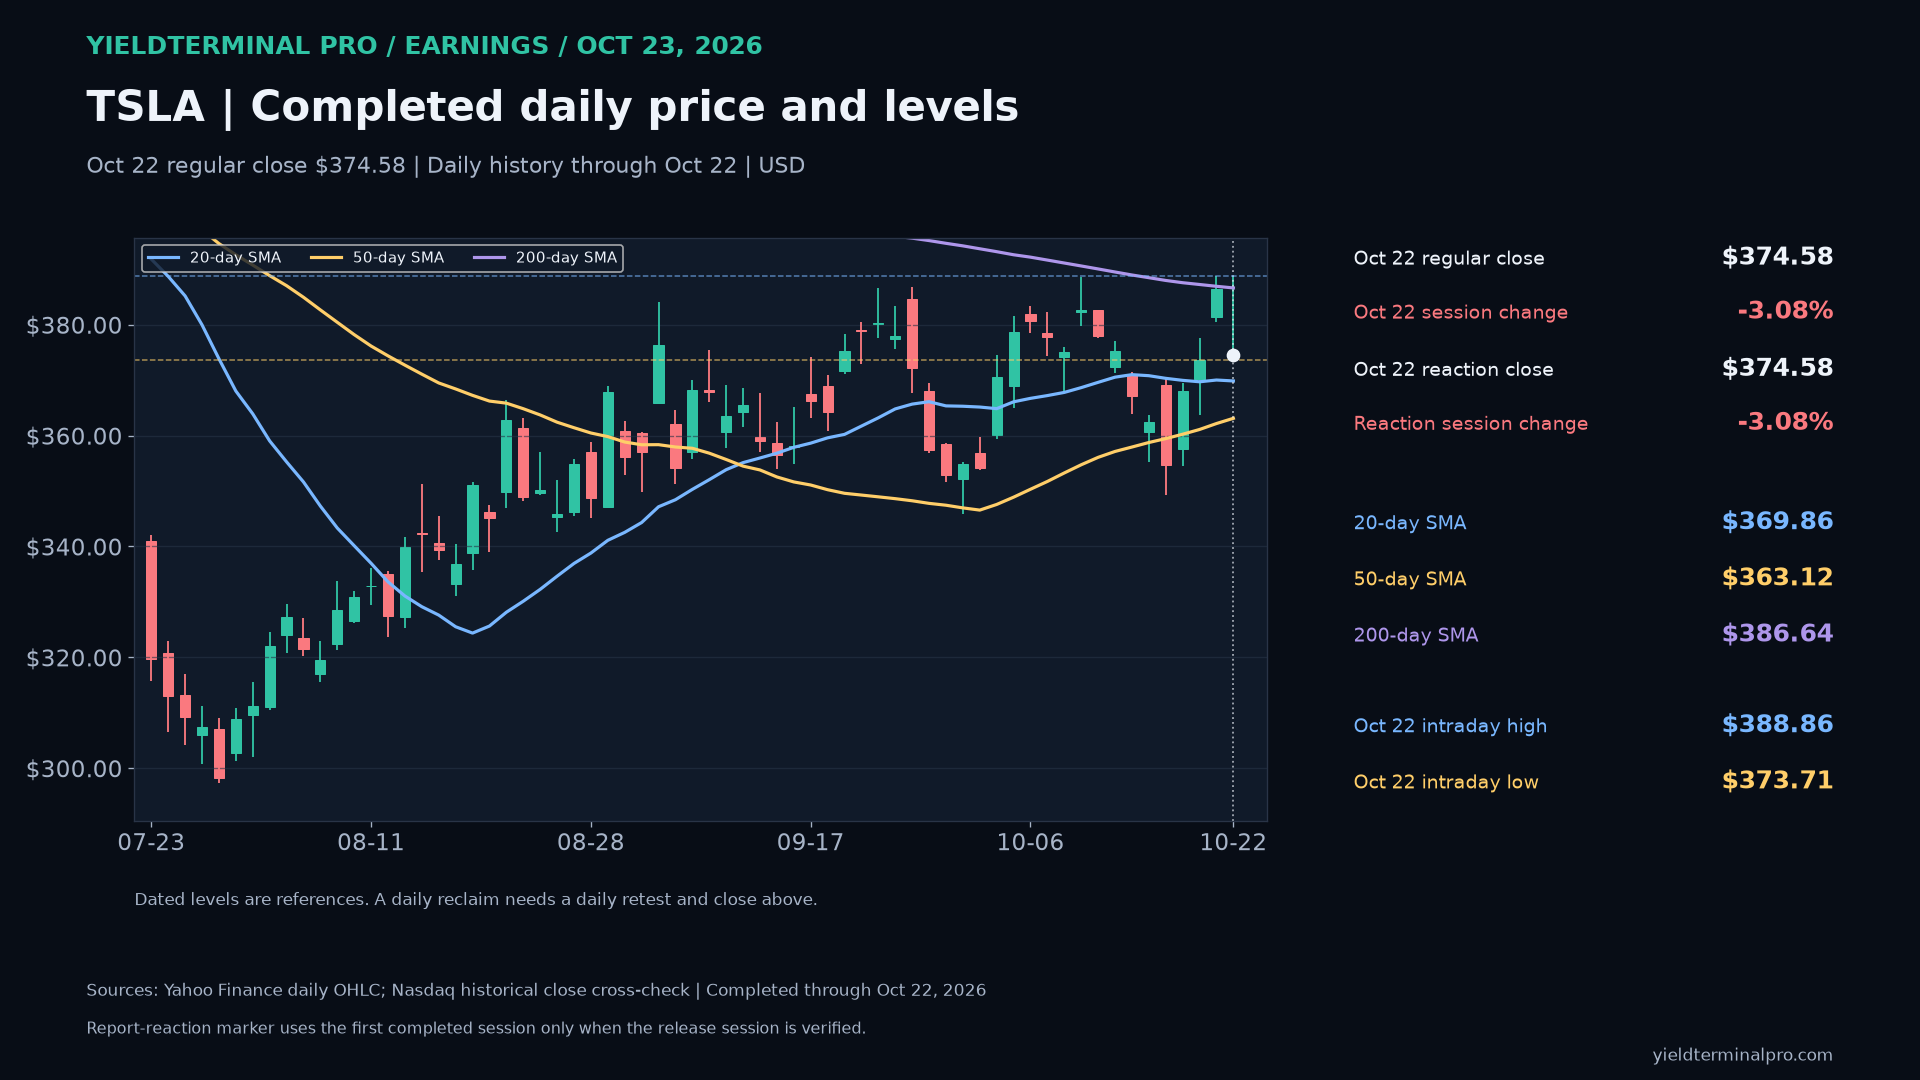
$TSLATesla, Inc. — October 23 earnings review 374.58October 22 completed regular-session closeTSLA closed October 22 at $374.58, above its 50-day average ($363.12) and below its 200-day average ($386.64). The October 22 high ($388.86) and low ($373.71) are dated reference levels. This is completed daily history, not an October 23 quote.
- October 22 intraday high
- 388.86
- October 22 intraday low
- 373.71
- 50-day SMA through October 22
- 363.12
- 200-day SMA through October 22
- 386.64
Levels measured over Completed US regular-session daily history through October 22, 2026. Daily averages use completed closes; earnings result and price session are separate dated evidence.. A level measured over a different window can be a different number.
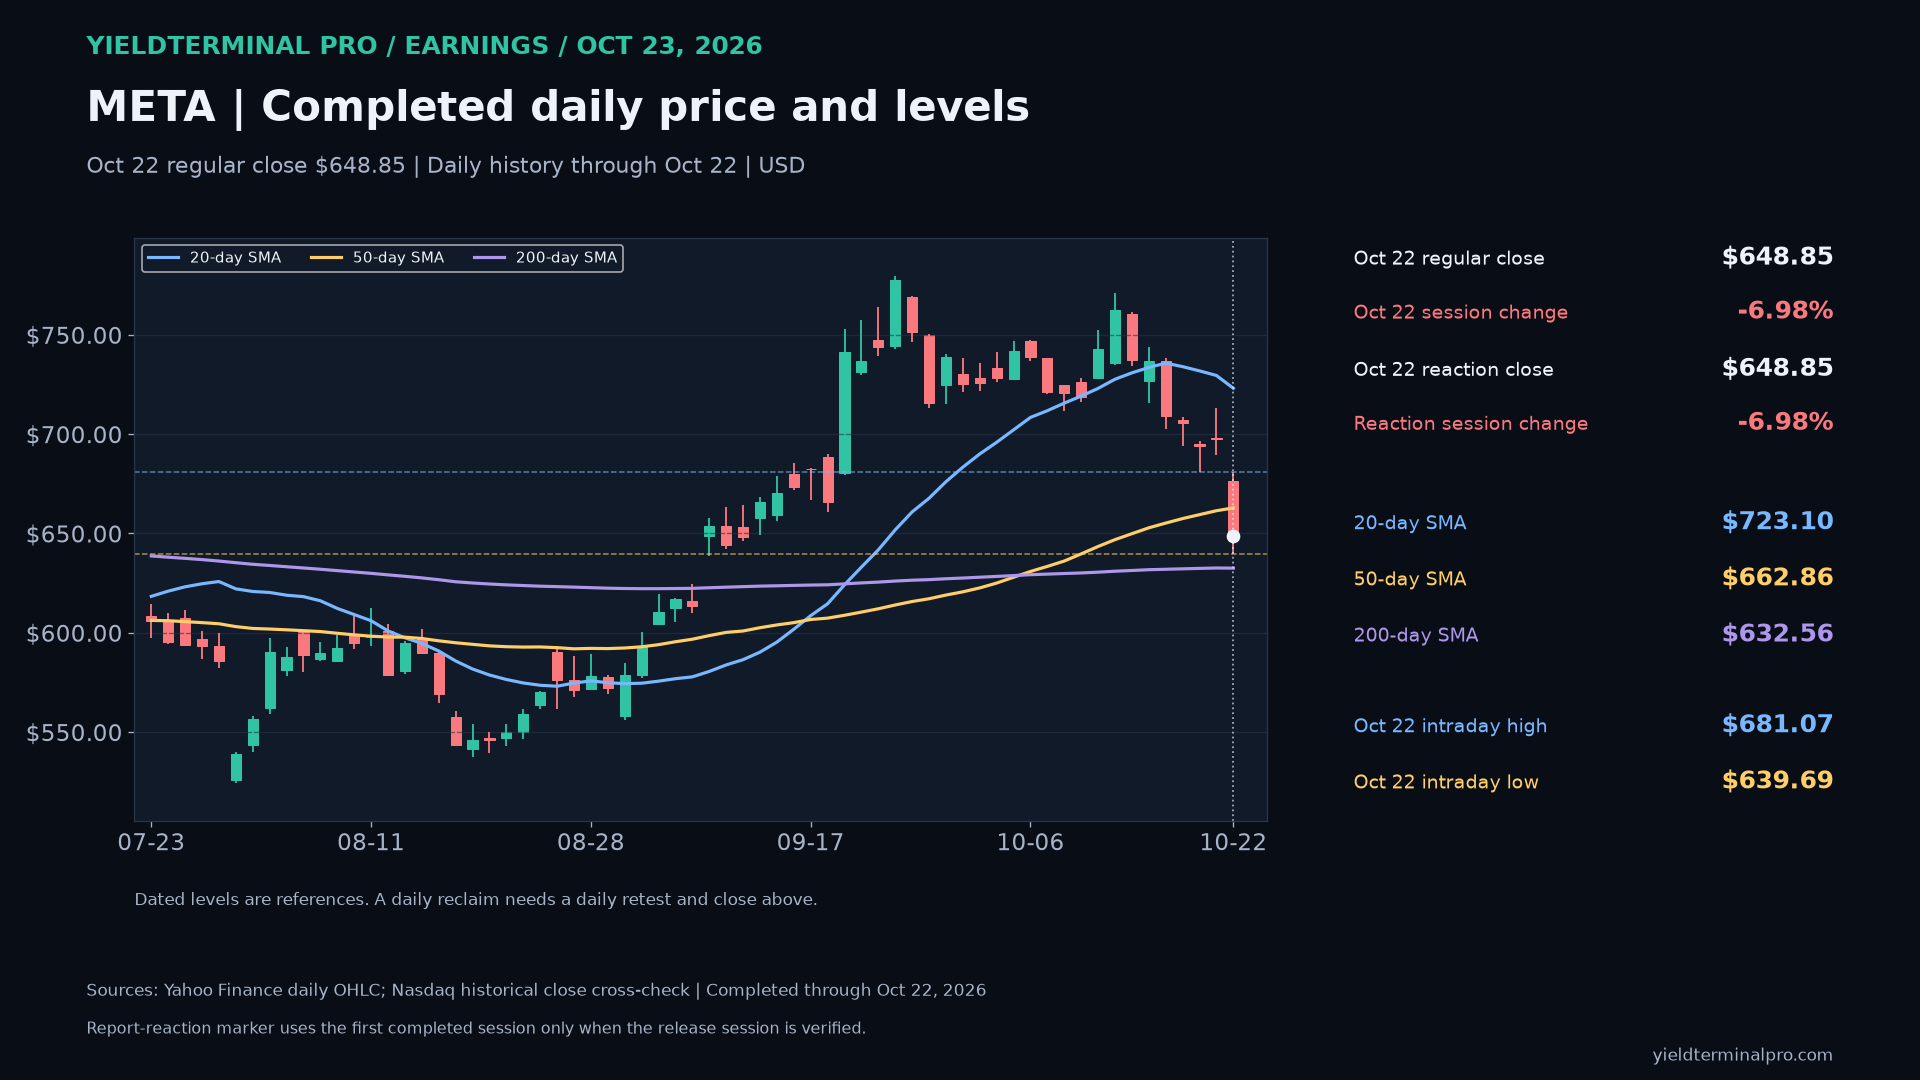
$METAMeta Platforms, Inc. — October 23 earnings review 648.85October 22 completed regular-session closeMETA closed October 22 at $648.85, below its 50-day average ($662.86) and above its 200-day average ($632.56). The October 22 high ($681.07) and low ($639.69) are dated reference levels. This is completed daily history, not an October 23 quote.
- October 22 intraday high
- 681.07
- October 22 intraday low
- 639.69
- 50-day SMA through October 22
- 662.86
- 200-day SMA through October 22
- 632.56
Levels measured over Completed US regular-session daily history through October 22, 2026. Daily averages use completed closes; earnings result and price session are separate dated evidence.. A level measured over a different window can be a different number.
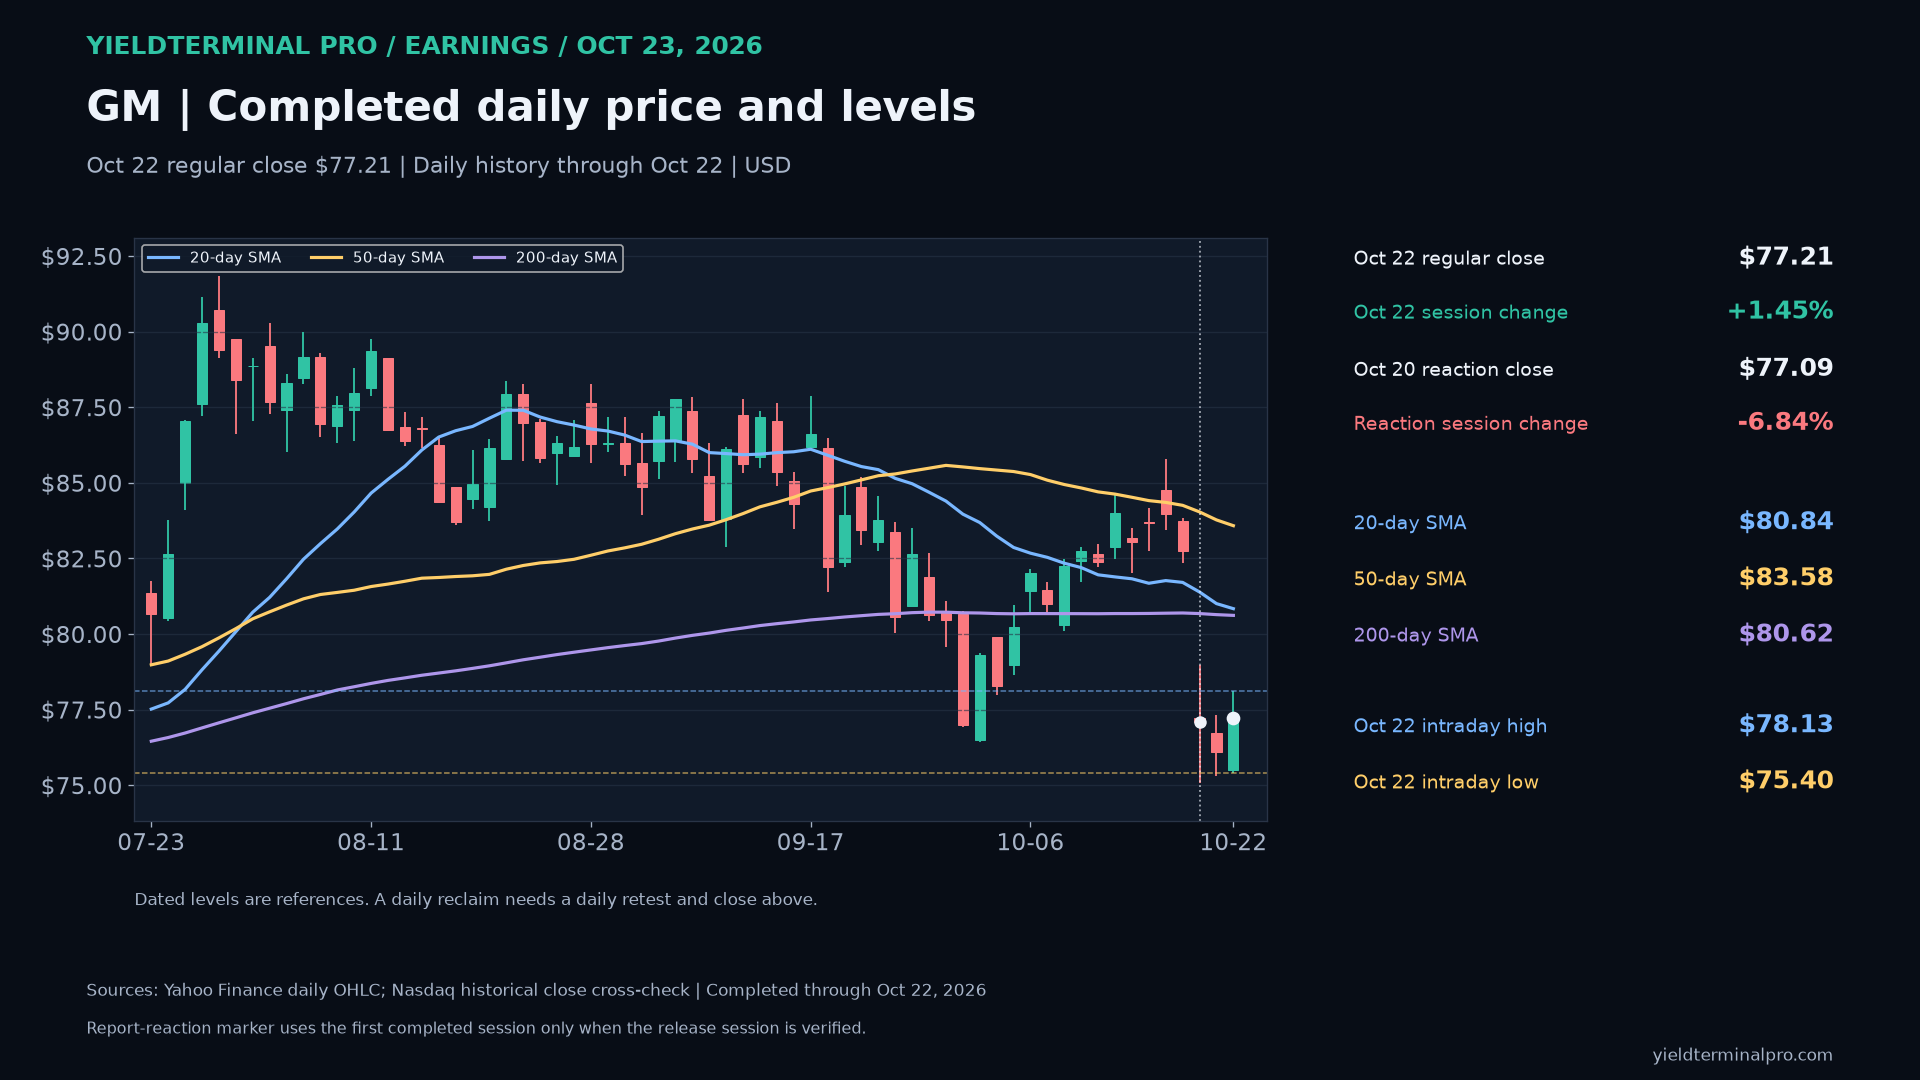
$GMGeneral Motors Company — October 23 earnings review 77.21October 22 completed regular-session closeGM closed October 22 at $77.21, below its 50-day average ($83.58) and below its 200-day average ($80.62). The October 22 high ($78.13) and low ($75.40) are dated reference levels. This is completed daily history, not an October 23 quote.
- October 22 intraday high
- 78.13
- October 22 intraday low
- 75.40
- 50-day SMA through October 22
- 83.58
- 200-day SMA through October 22
- 80.62
Levels measured over Completed US regular-session daily history through October 22, 2026. Daily averages use completed closes; earnings result and price session are separate dated evidence.. A level measured over a different window can be a different number.
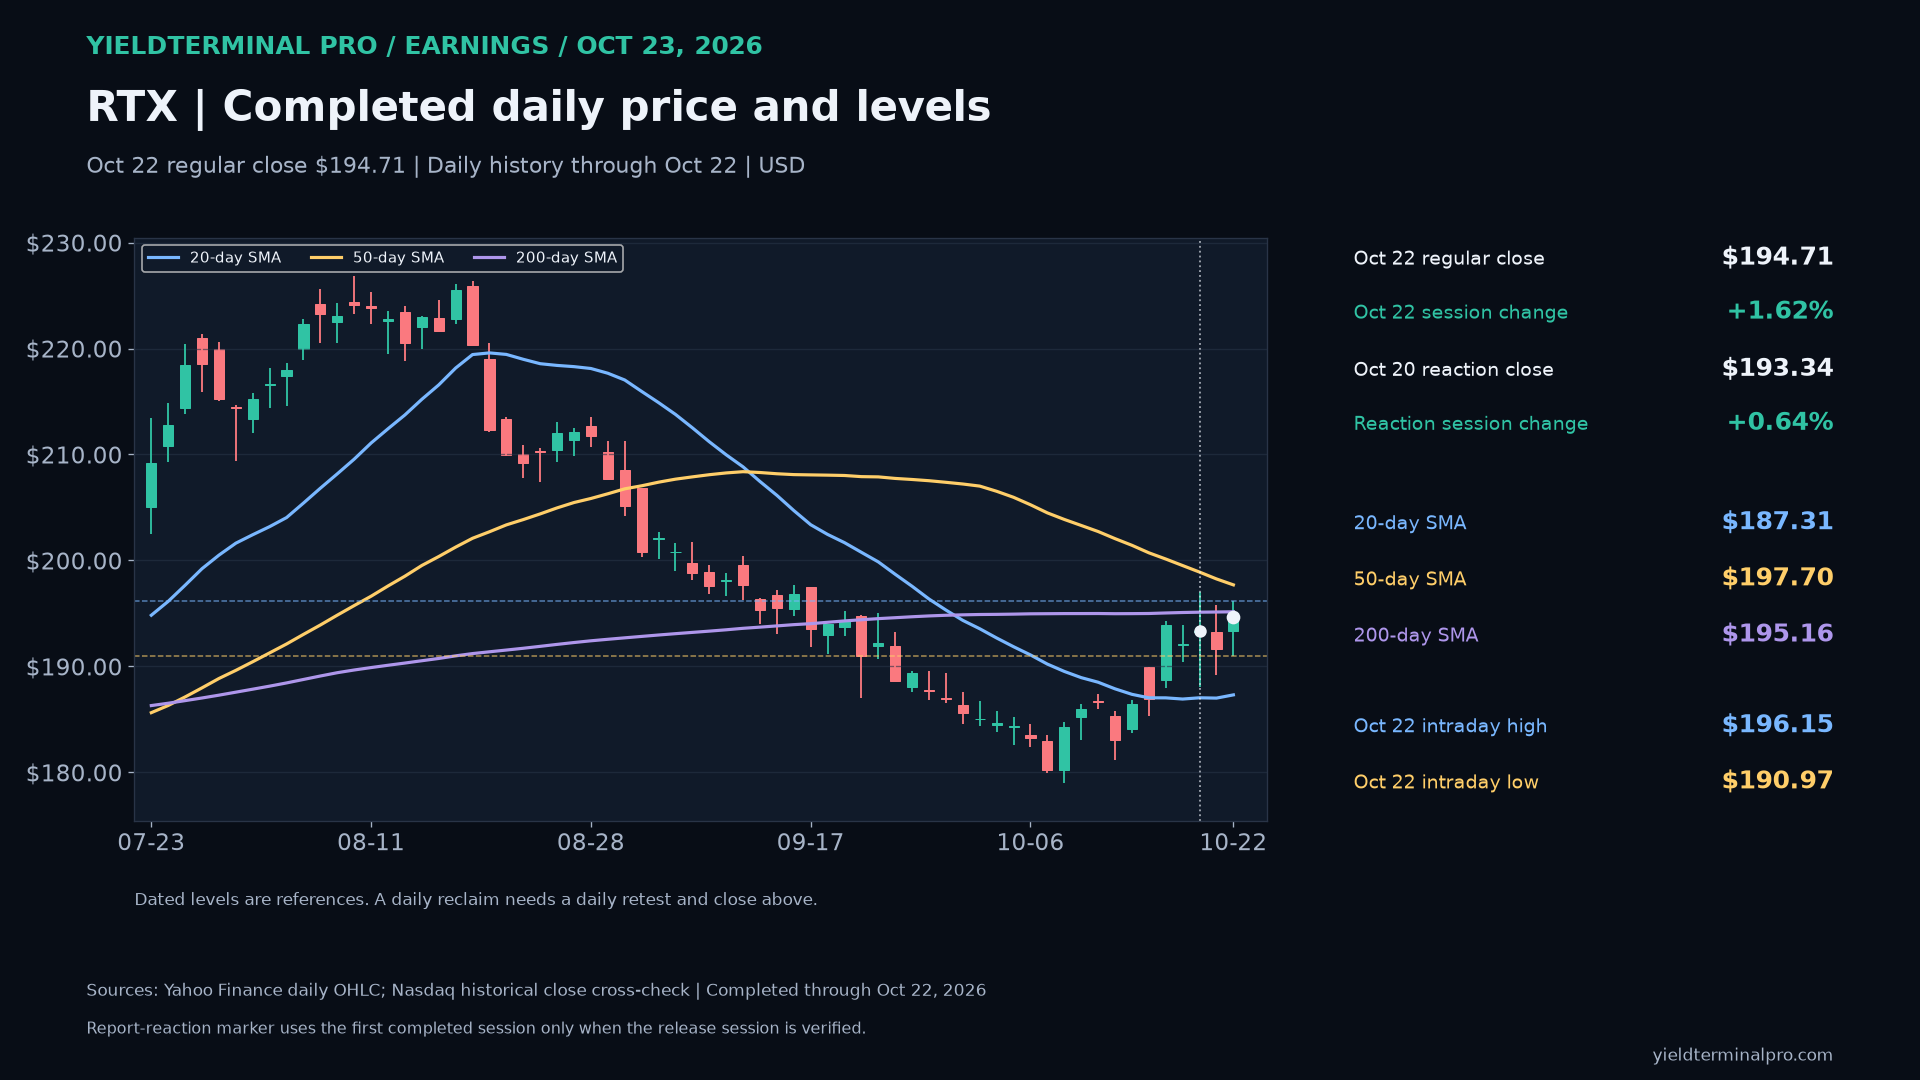
$RTXRTX Corporation — October 23 earnings review 194.71October 22 completed regular-session closeRTX closed October 22 at $194.71, below its 50-day average ($197.70) and below its 200-day average ($195.16). The October 22 high ($196.15) and low ($190.97) are dated reference levels. This is completed daily history, not an October 23 quote.
- October 22 intraday high
- 196.15
- October 22 intraday low
- 190.97
- 50-day SMA through October 22
- 197.70
- 200-day SMA through October 22
- 195.16
Levels measured over Completed US regular-session daily history through October 22, 2026. Daily averages use completed closes; earnings result and price session are separate dated evidence.. A level measured over a different window can be a different number.
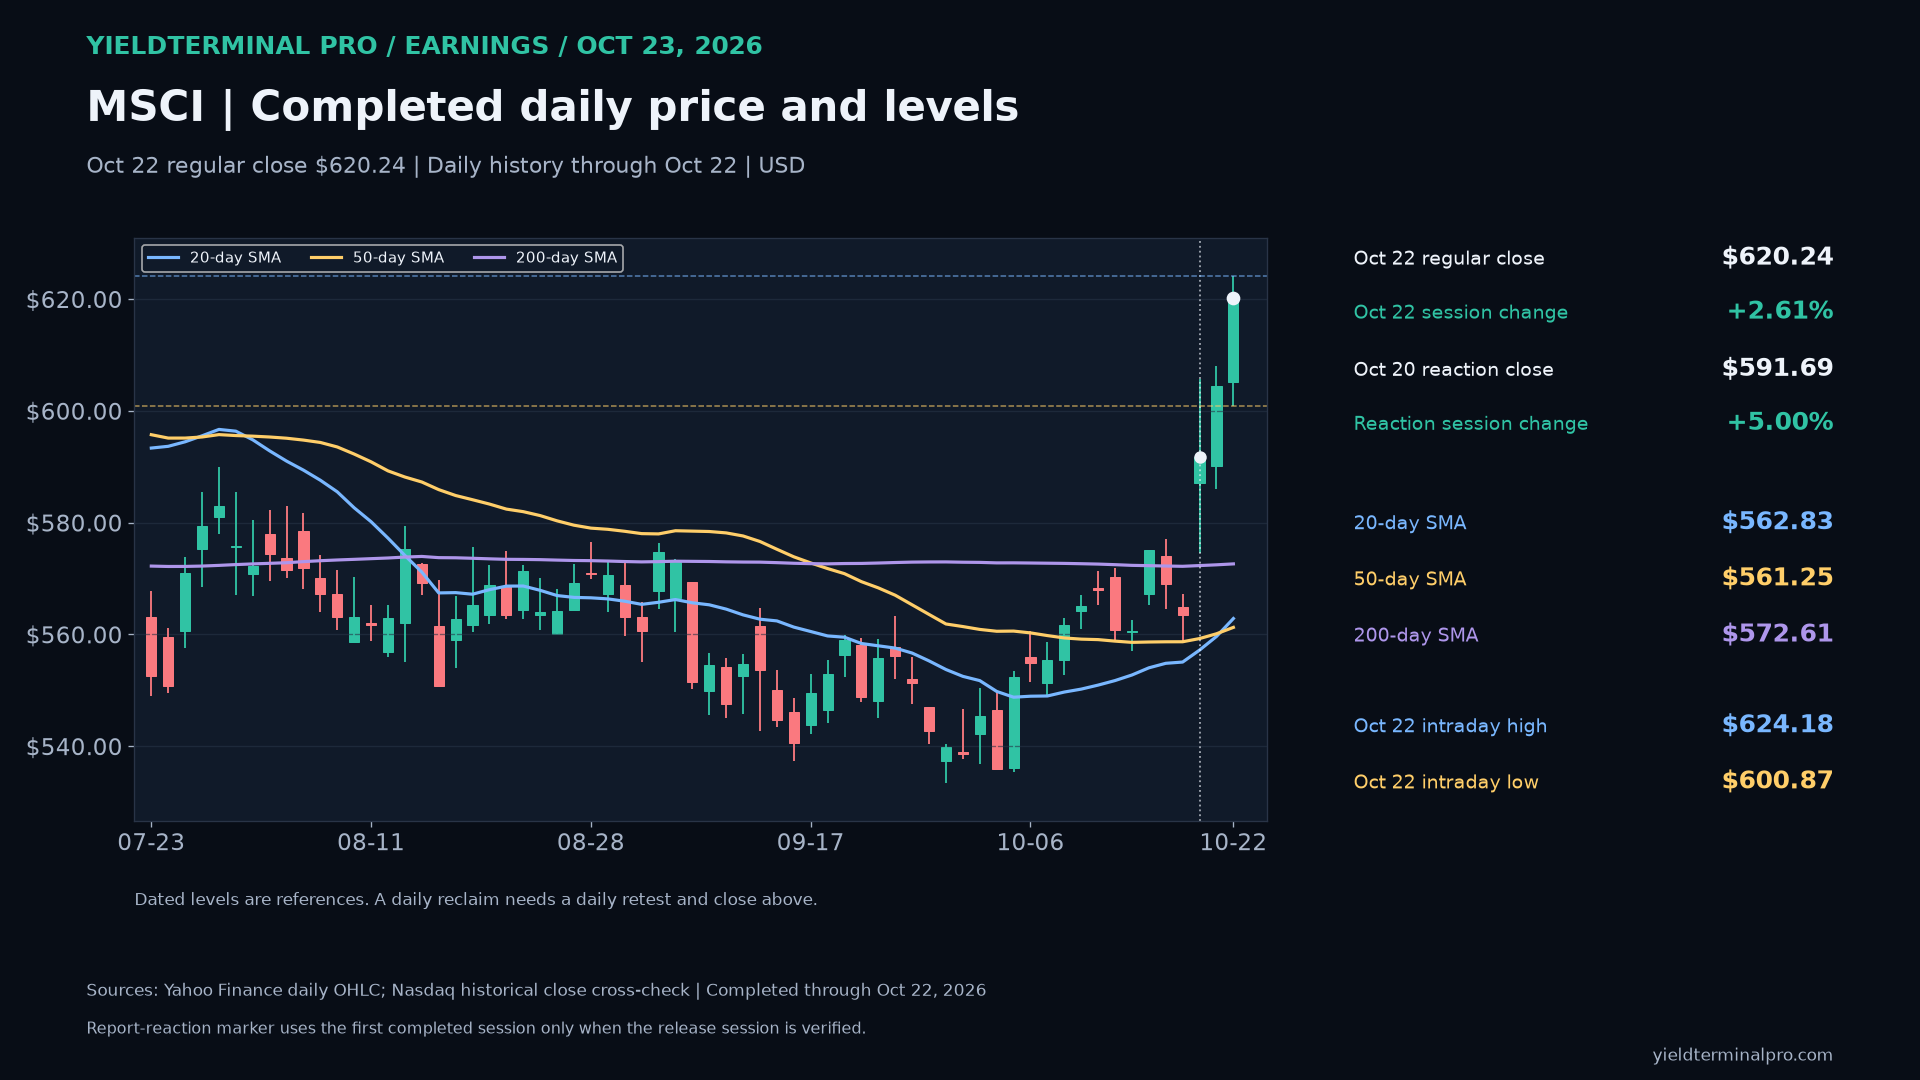
$MSCIMSCI Inc. — October 23 earnings review 620.24October 22 completed regular-session closeMSCI closed October 22 at $620.24, above its 50-day average ($561.25) and above its 200-day average ($572.61). The October 22 high ($624.18) and low ($600.87) are dated reference levels. This is completed daily history, not an October 23 quote.
- October 22 intraday high
- 624.18
- October 22 intraday low
- 600.87
- 50-day SMA through October 22
- 561.25
- 200-day SMA through October 22
- 572.61
Levels measured over Completed US regular-session daily history through October 22, 2026. Daily averages use completed closes; earnings result and price session are separate dated evidence.. A level measured over a different window can be a different number.
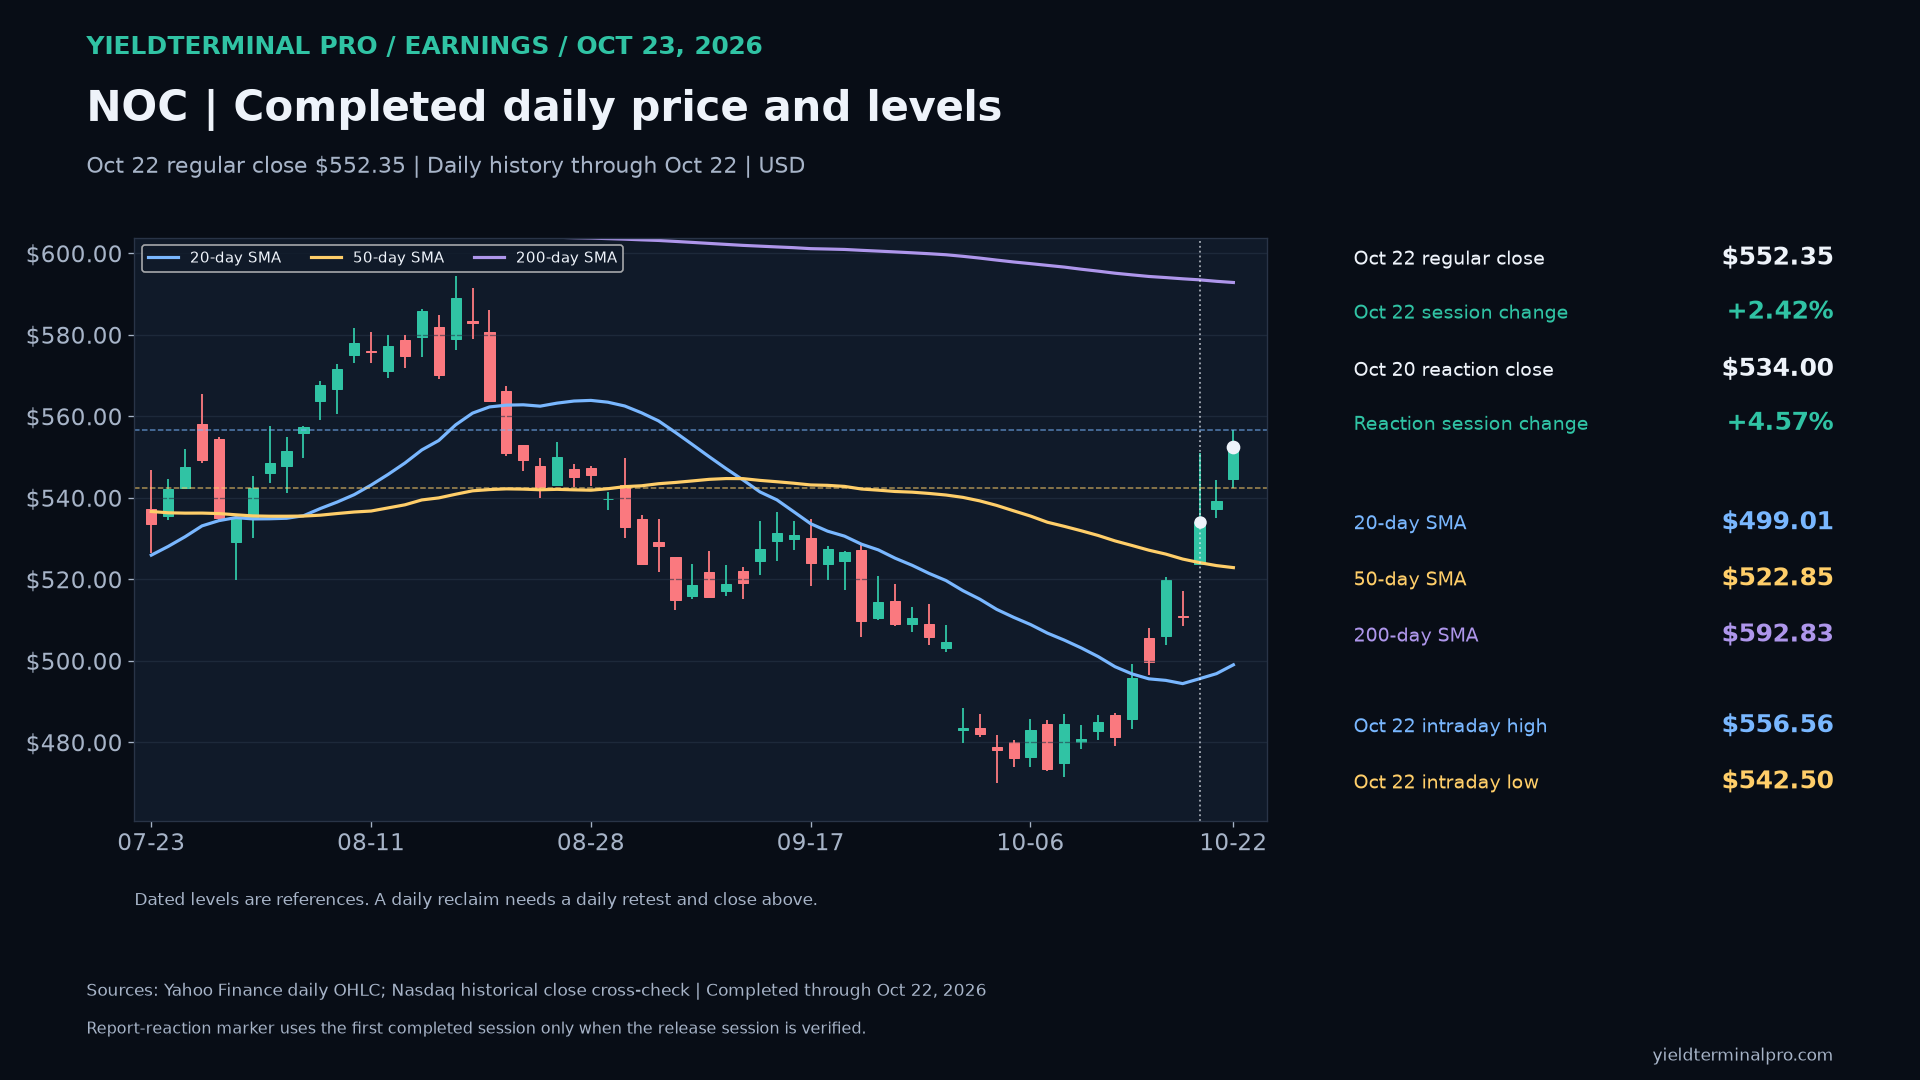
$NOCNorthrop Grumman — October 23 earnings review 552.35October 22 completed regular-session closeNOC closed October 22 at $552.35, above its 50-day average ($522.85) and below its 200-day average ($592.83). The October 22 high ($556.56) and low ($542.50) are dated reference levels. This is completed daily history, not an October 23 quote.
- October 22 intraday high
- 556.56
- October 22 intraday low
- 542.50
- 50-day SMA through October 22
- 522.85
- 200-day SMA through October 22
- 592.83
Levels measured over Completed US regular-session daily history through October 22, 2026. Daily averages use completed closes; earnings result and price session are separate dated evidence.. A level measured over a different window can be a different number.
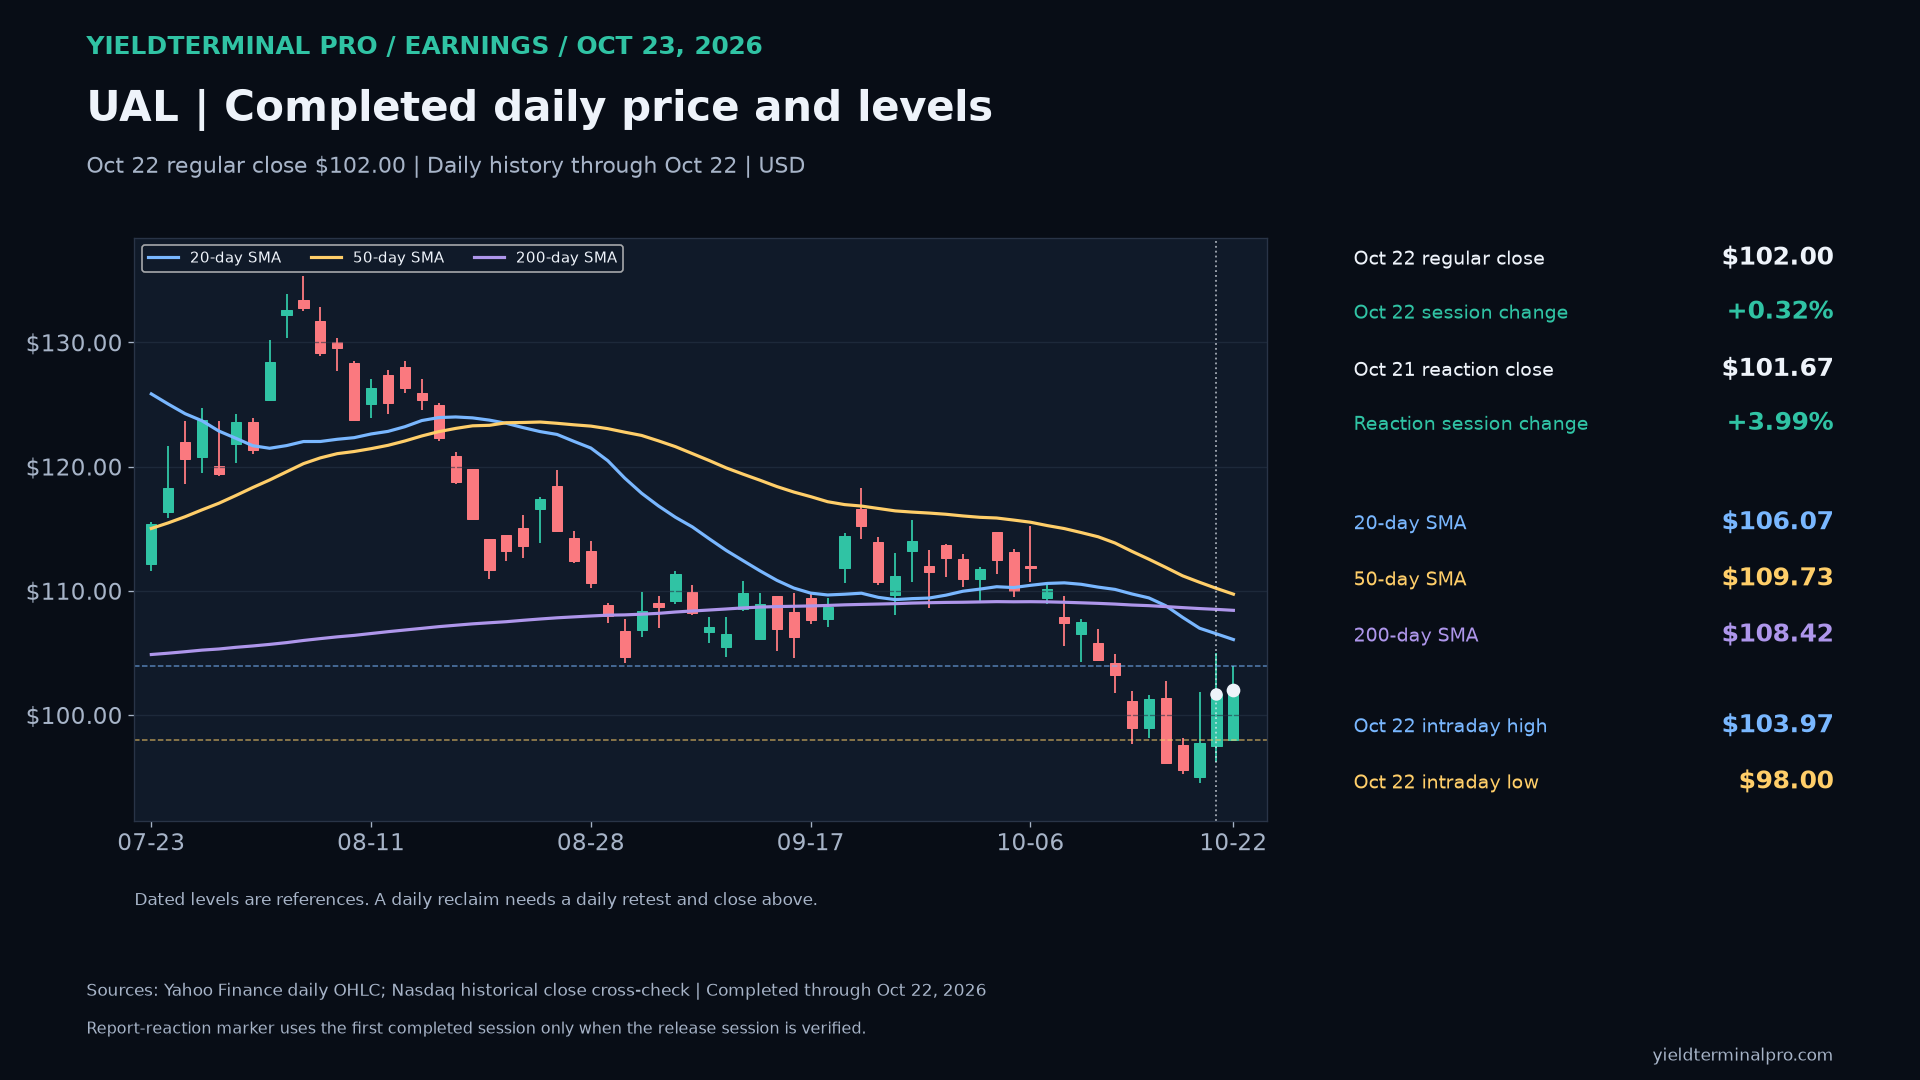
$UALUnited Airlines Holdings, Inc. — October 23 earnings review 102.00October 22 completed regular-session closeUAL closed October 22 at $102.00, below its 50-day average ($109.73) and below its 200-day average ($108.42). The October 22 high ($103.97) and low ($98.00) are dated reference levels. This is completed daily history, not an October 23 quote.
- October 22 intraday high
- 103.97
- October 22 intraday low
- 98.00
- 50-day SMA through October 22
- 109.73
- 200-day SMA through October 22
- 108.42
Levels measured over Completed US regular-session daily history through October 22, 2026. Daily averages use completed closes; earnings result and price session are separate dated evidence.. A level measured over a different window can be a different number.
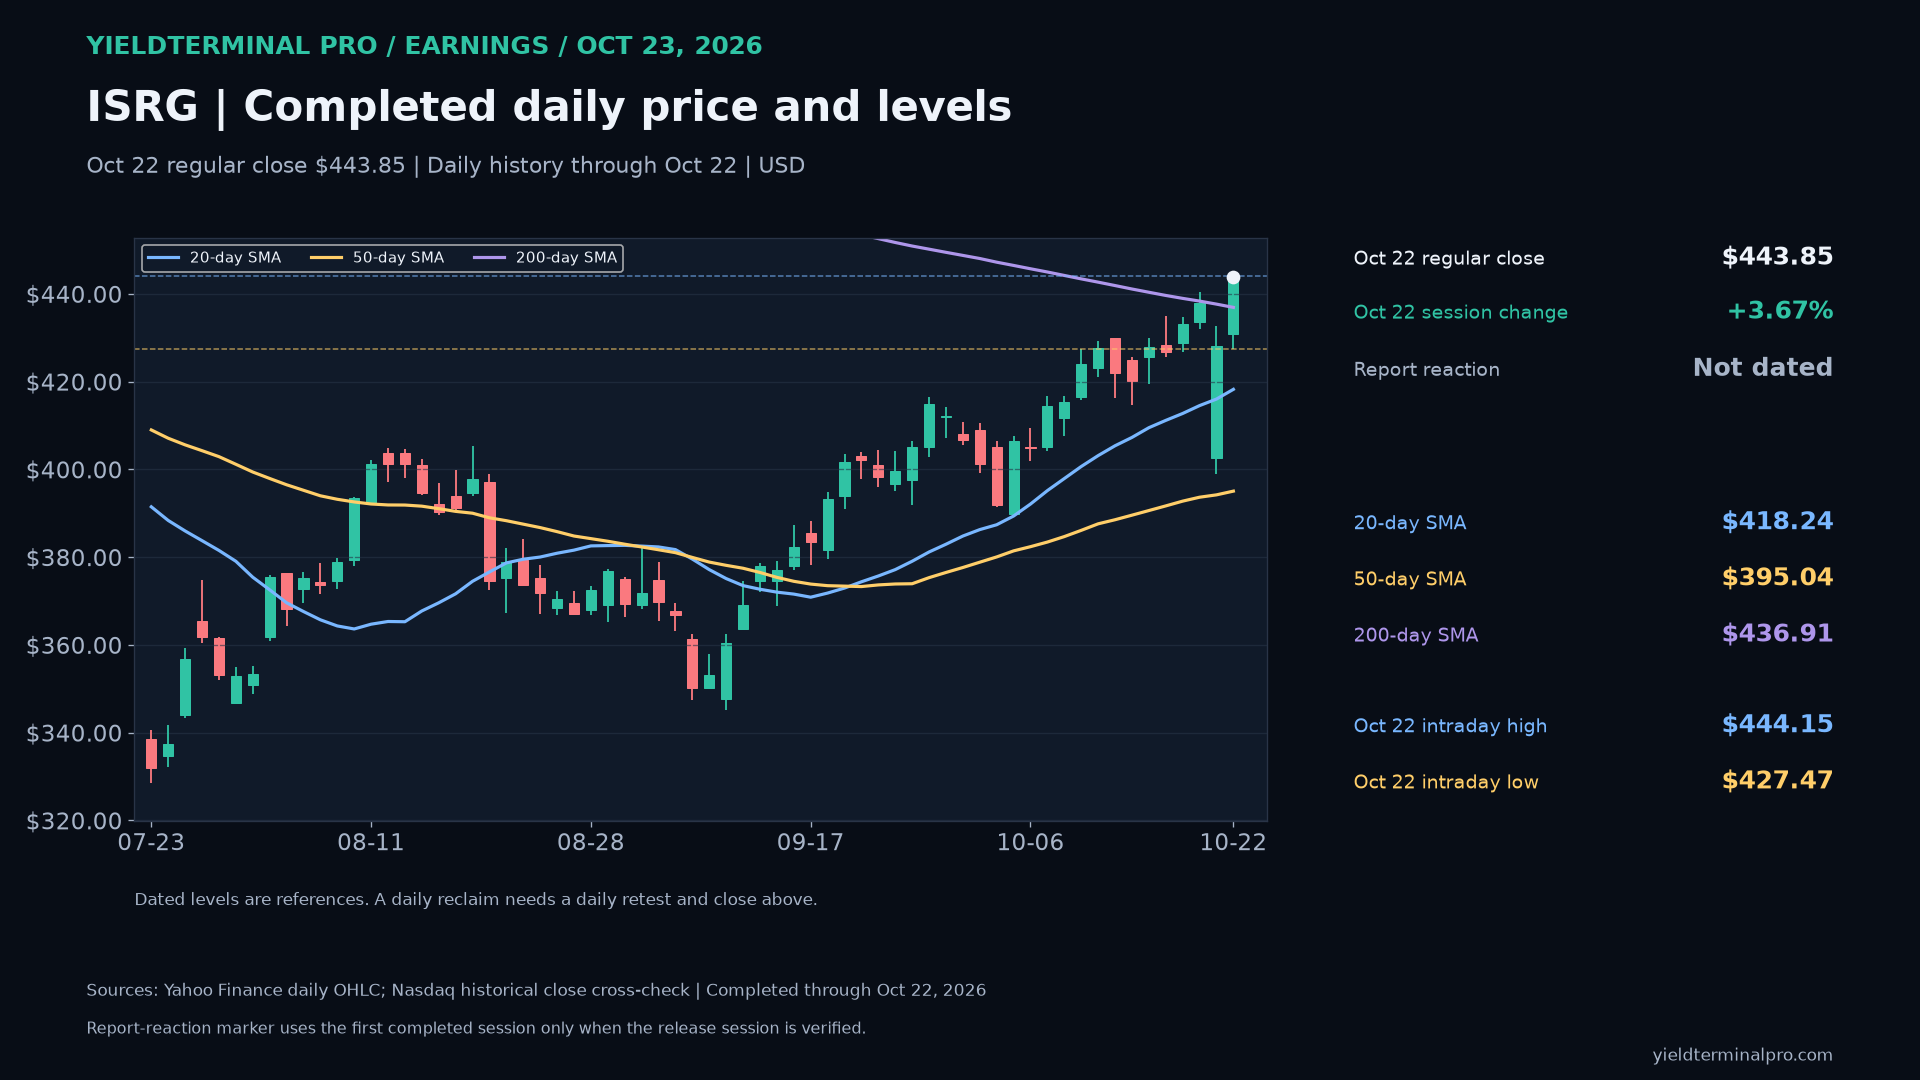
$ISRGIntuitive Surgical, Inc. — October 23 earnings review 443.85October 22 completed regular-session closeISRG closed October 22 at $443.85, above its 50-day average ($395.04) and above its 200-day average ($436.91). The October 22 high ($444.15) and low ($427.47) are dated reference levels. This is completed daily history, not an October 23 quote.
- October 22 intraday high
- 444.15
- October 22 intraday low
- 427.47
- 50-day SMA through October 22
- 395.04
- 200-day SMA through October 22
- 436.91
Levels measured over Completed US regular-session daily history through October 22, 2026. Daily averages use completed closes; earnings result and price session are separate dated evidence.. A level measured over a different window can be a different number.
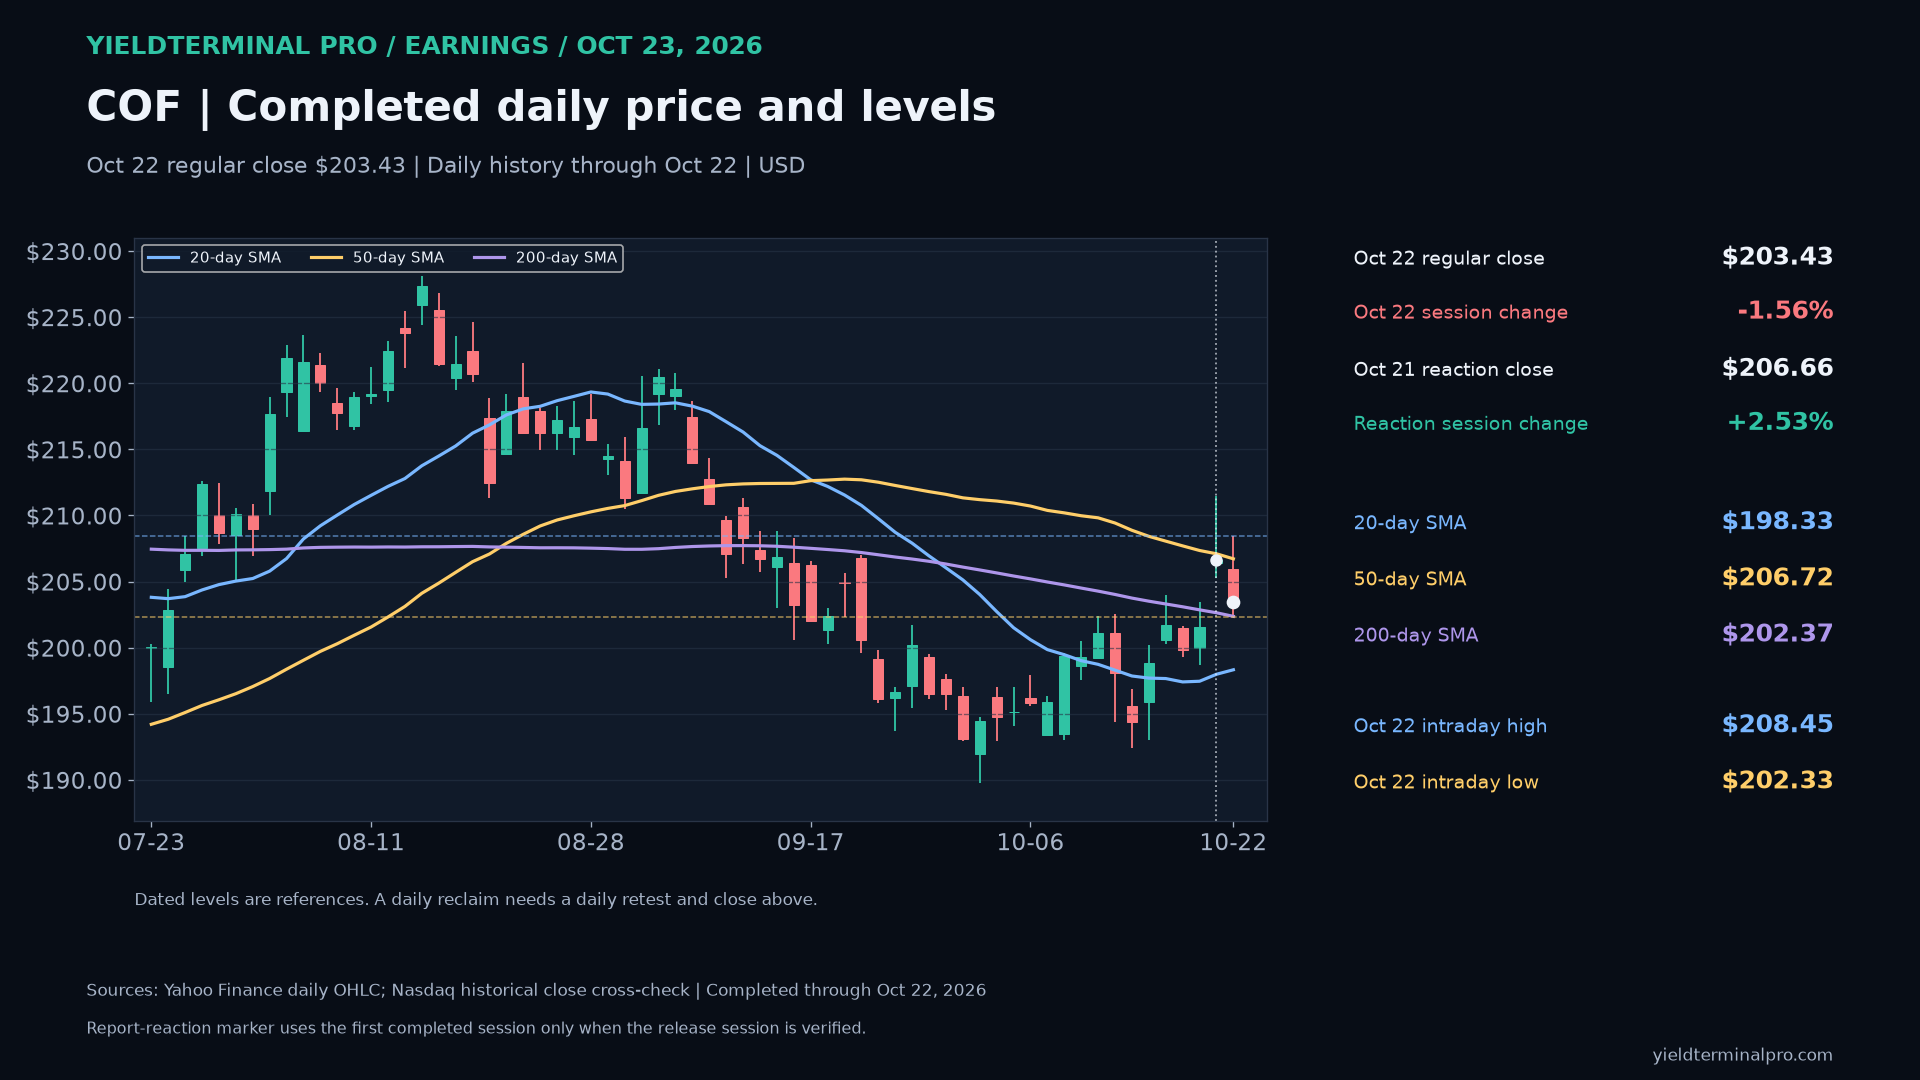
$COFCapital One Financial Corporation — October 23 earnings review 203.43October 22 completed regular-session closeCOF closed October 22 at $203.43, below its 50-day average ($206.72) and above its 200-day average ($202.37). The October 22 high ($208.45) and low ($202.33) are dated reference levels. This is completed daily history, not an October 23 quote.
- October 22 intraday high
- 208.45
- October 22 intraday low
- 202.33
- 50-day SMA through October 22
- 206.72
- 200-day SMA through October 22
- 202.37
Levels measured over Completed US regular-session daily history through October 22, 2026. Daily averages use completed closes; earnings result and price session are separate dated evidence.. A level measured over a different window can be a different number.
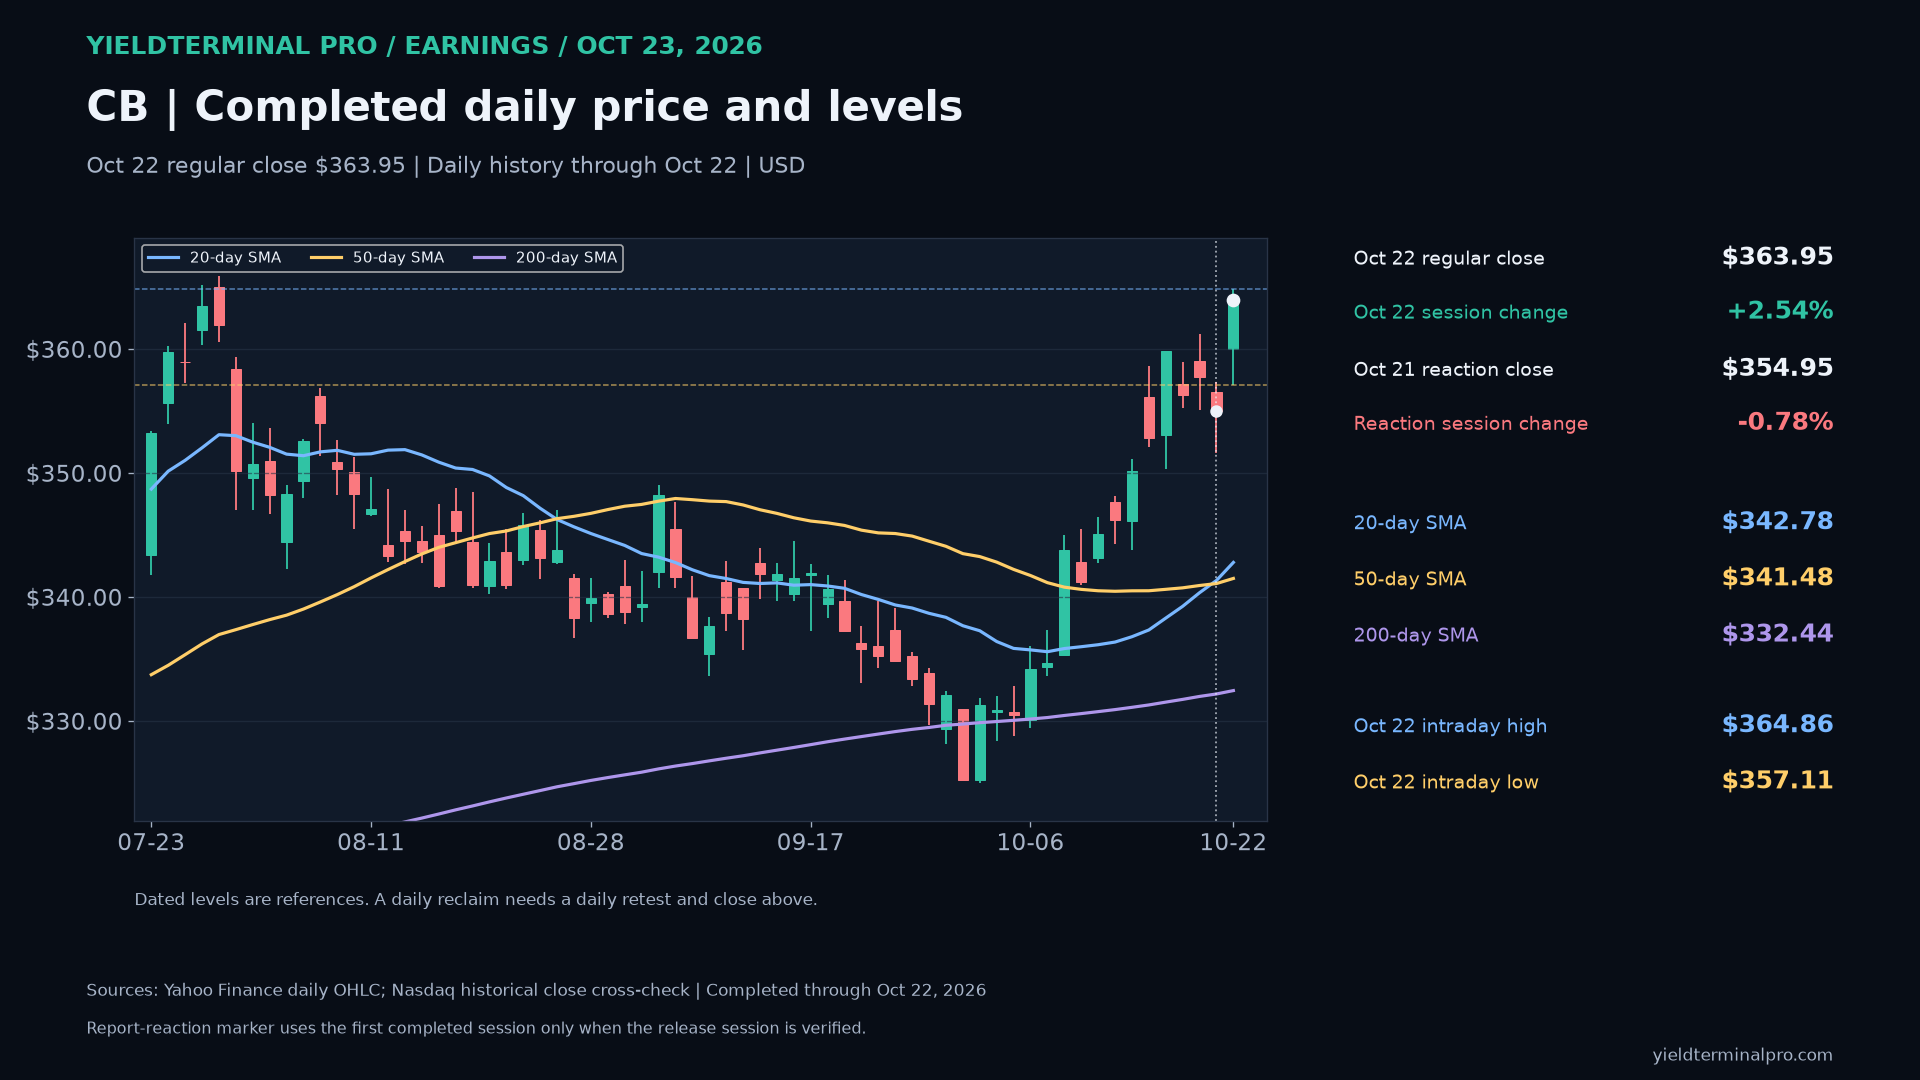
$CBChubb — October 23 earnings review 363.95October 22 completed regular-session closeCB closed October 22 at $363.95, above its 50-day average ($341.48) and above its 200-day average ($332.44). The October 22 high ($364.86) and low ($357.11) are dated reference levels. This is completed daily history, not an October 23 quote.
- October 22 intraday high
- 364.86
- October 22 intraday low
- 357.11
- 50-day SMA through October 22
- 341.48
- 200-day SMA through October 22
- 332.44
Levels measured over Completed US regular-session daily history through October 22, 2026. Daily averages use completed closes; earnings result and price session are separate dated evidence.. A level measured over a different window can be a different number.
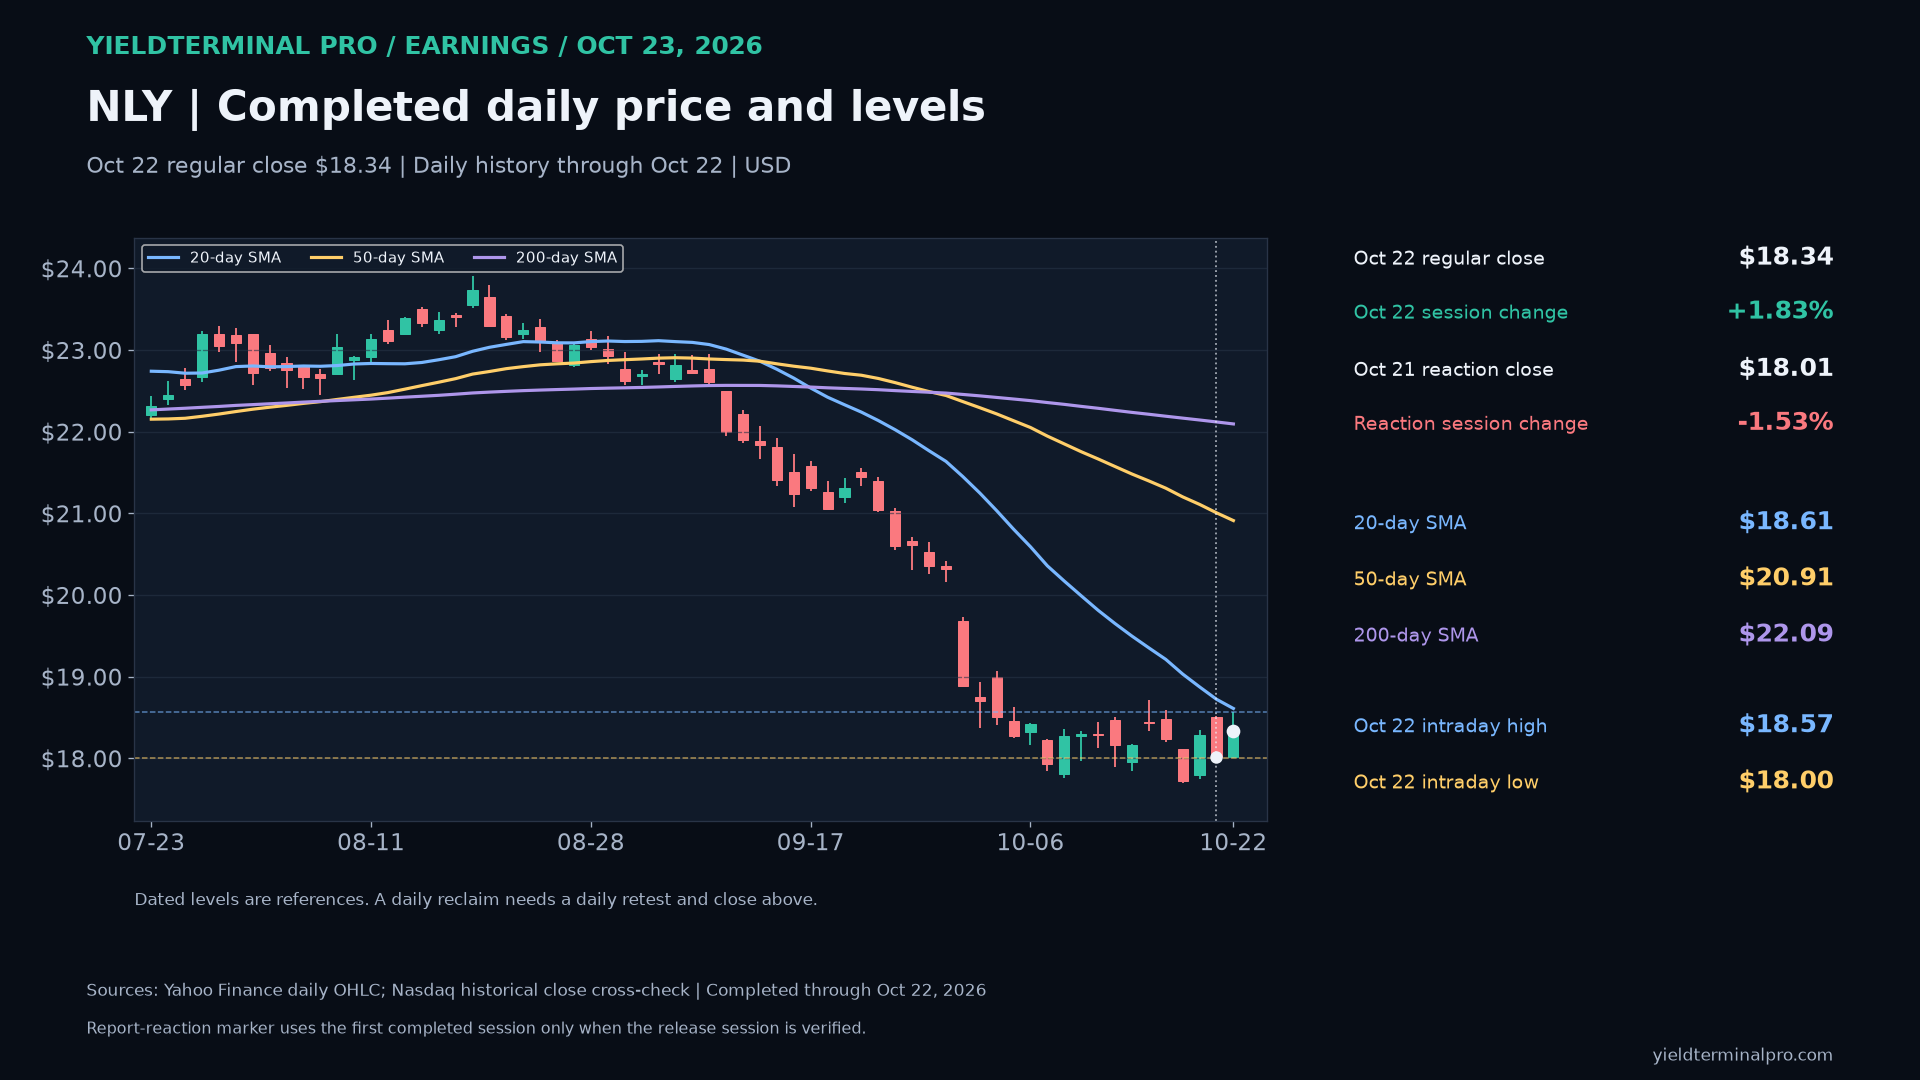
$NLYAnnaly Capital — October 23 earnings review 18.34October 22 completed regular-session closeNLY closed October 22 at $18.34, below its 50-day average ($20.91) and below its 200-day average ($22.09). The October 22 high ($18.57) and low ($18.00) are dated reference levels. This is completed daily history, not an October 23 quote.
- October 22 intraday high
- 18.57
- October 22 intraday low
- 18.00
- 50-day SMA through October 22
- 20.91
- 200-day SMA through October 22
- 22.09
Levels measured over Completed US regular-session daily history through October 22, 2026. Daily averages use completed closes; earnings result and price session are separate dated evidence.. A level measured over a different window can be a different number.
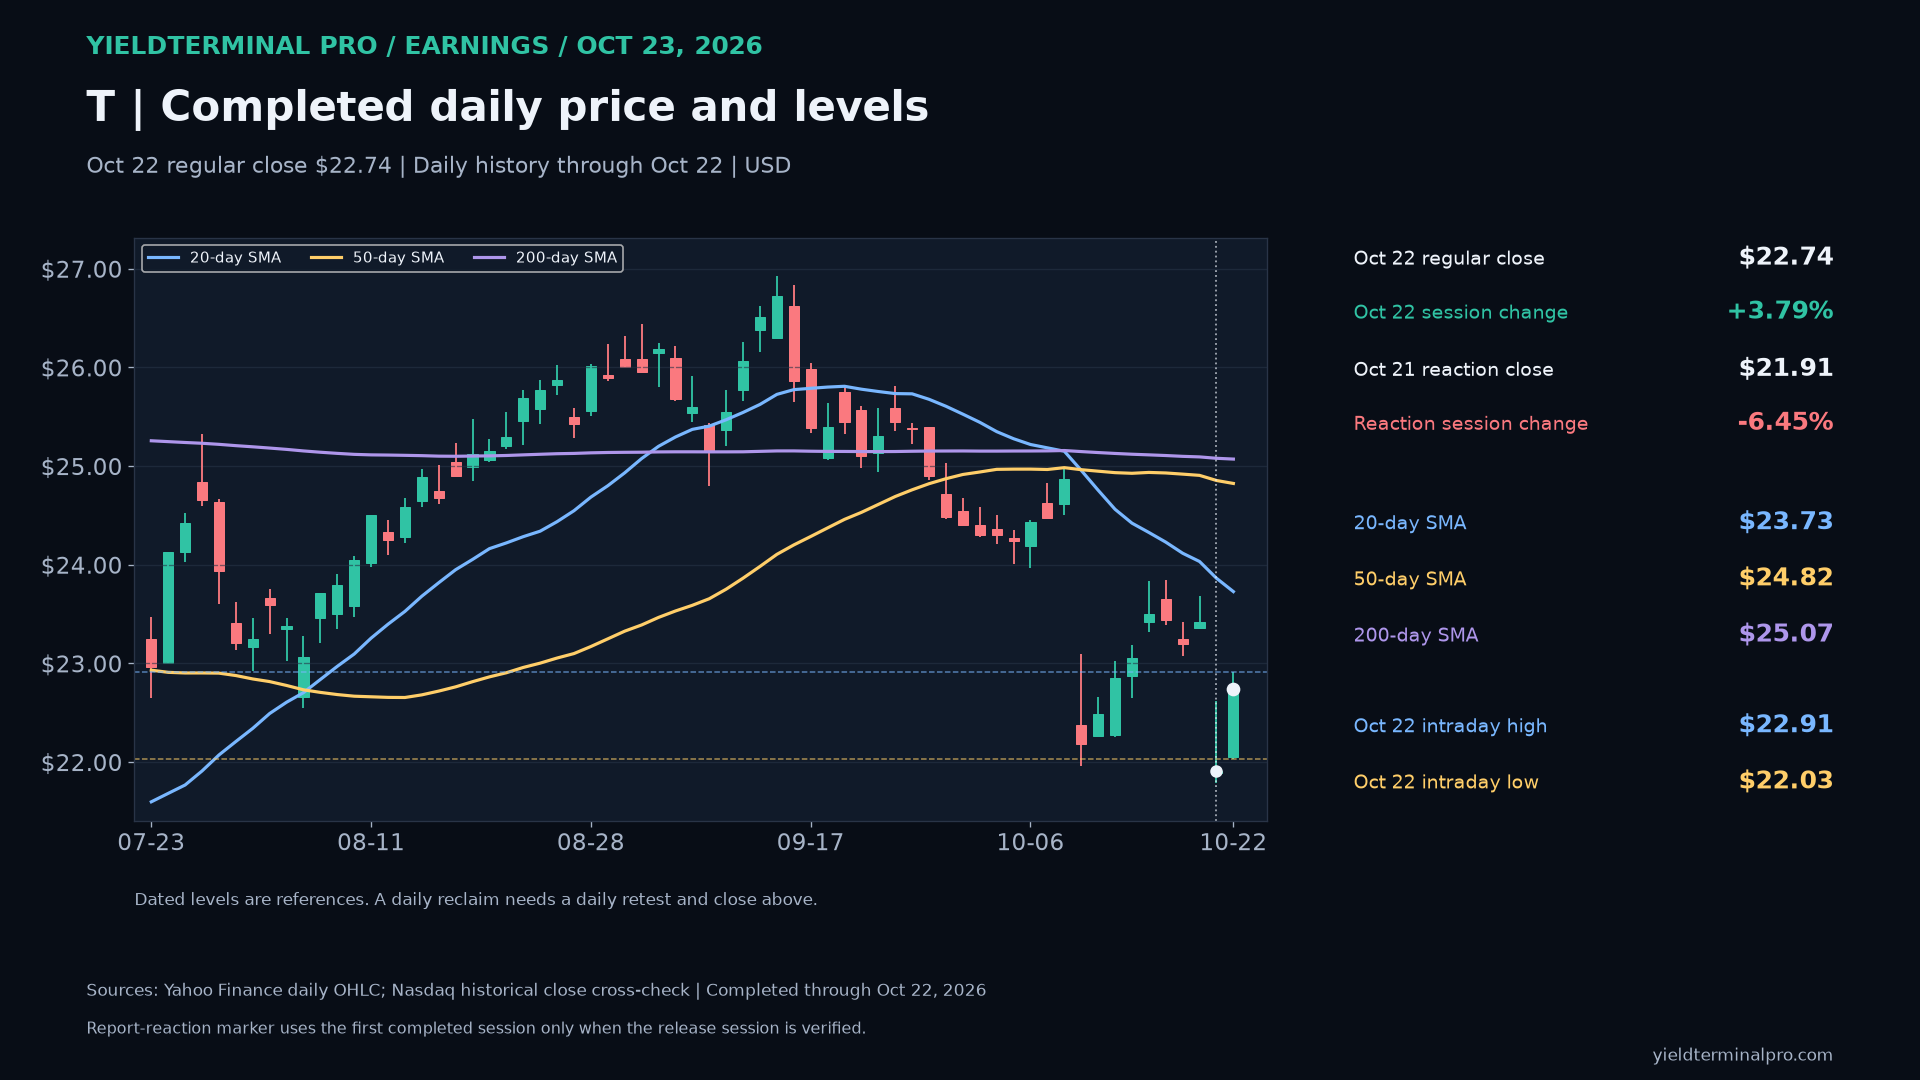
$TAT&T Inc. — October 23 earnings review 22.74October 22 completed regular-session closeT closed October 22 at $22.74, below its 50-day average ($24.82) and below its 200-day average ($25.07). The October 22 high ($22.91) and low ($22.03) are dated reference levels. This is completed daily history, not an October 23 quote.
- October 22 intraday high
- 22.91
- October 22 intraday low
- 22.03
- 50-day SMA through October 22
- 24.82
- 200-day SMA through October 22
- 25.07
Levels measured over Completed US regular-session daily history through October 22, 2026. Daily averages use completed closes; earnings result and price session are separate dated evidence.. A level measured over a different window can be a different number.
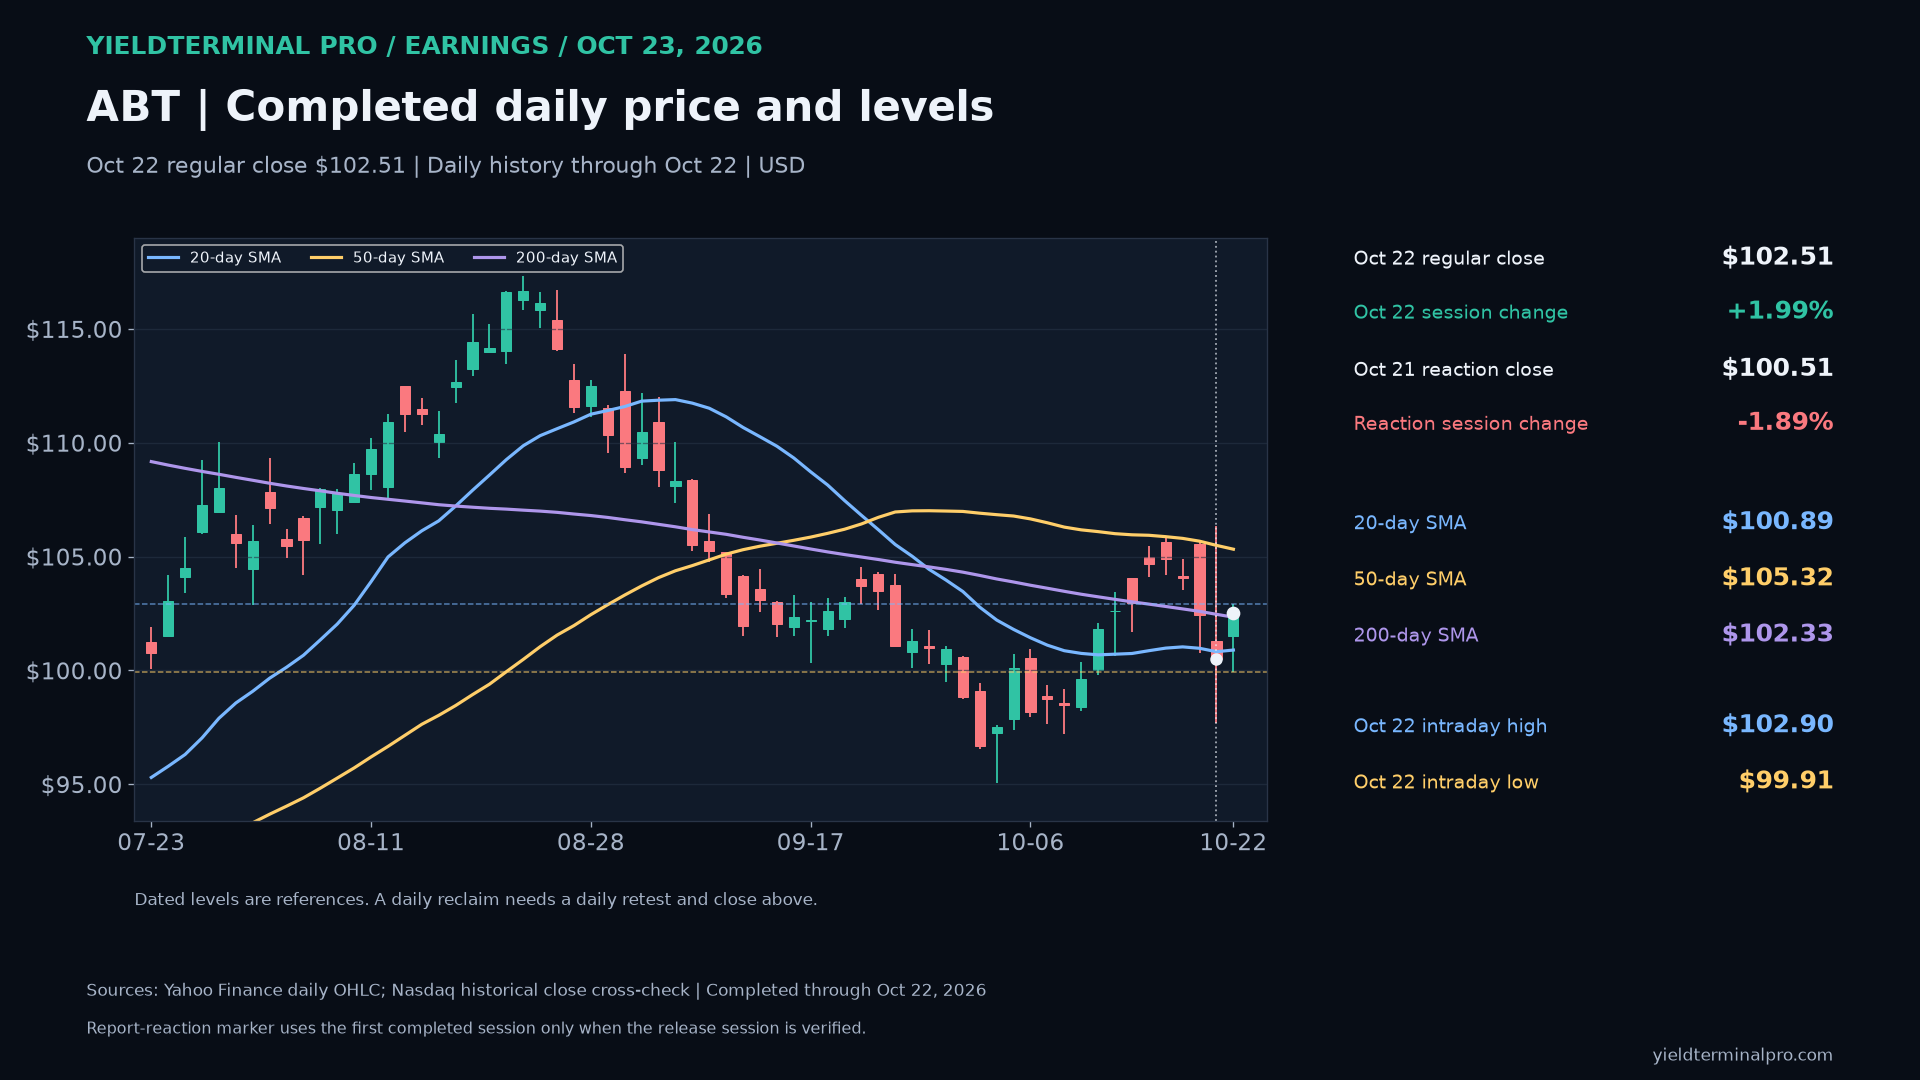
$ABTAbbott Laboratories — October 23 earnings review 102.51October 22 completed regular-session closeABT closed October 22 at $102.51, below its 50-day average ($105.32) and above its 200-day average ($102.33). The October 22 high ($102.90) and low ($99.91) are dated reference levels. This is completed daily history, not an October 23 quote.
- October 22 intraday high
- 102.90
- October 22 intraday low
- 99.91
- 50-day SMA through October 22
- 105.32
- 200-day SMA through October 22
- 102.33
Levels measured over Completed US regular-session daily history through October 22, 2026. Daily averages use completed closes; earnings result and price session are separate dated evidence.. A level measured over a different window can be a different number.
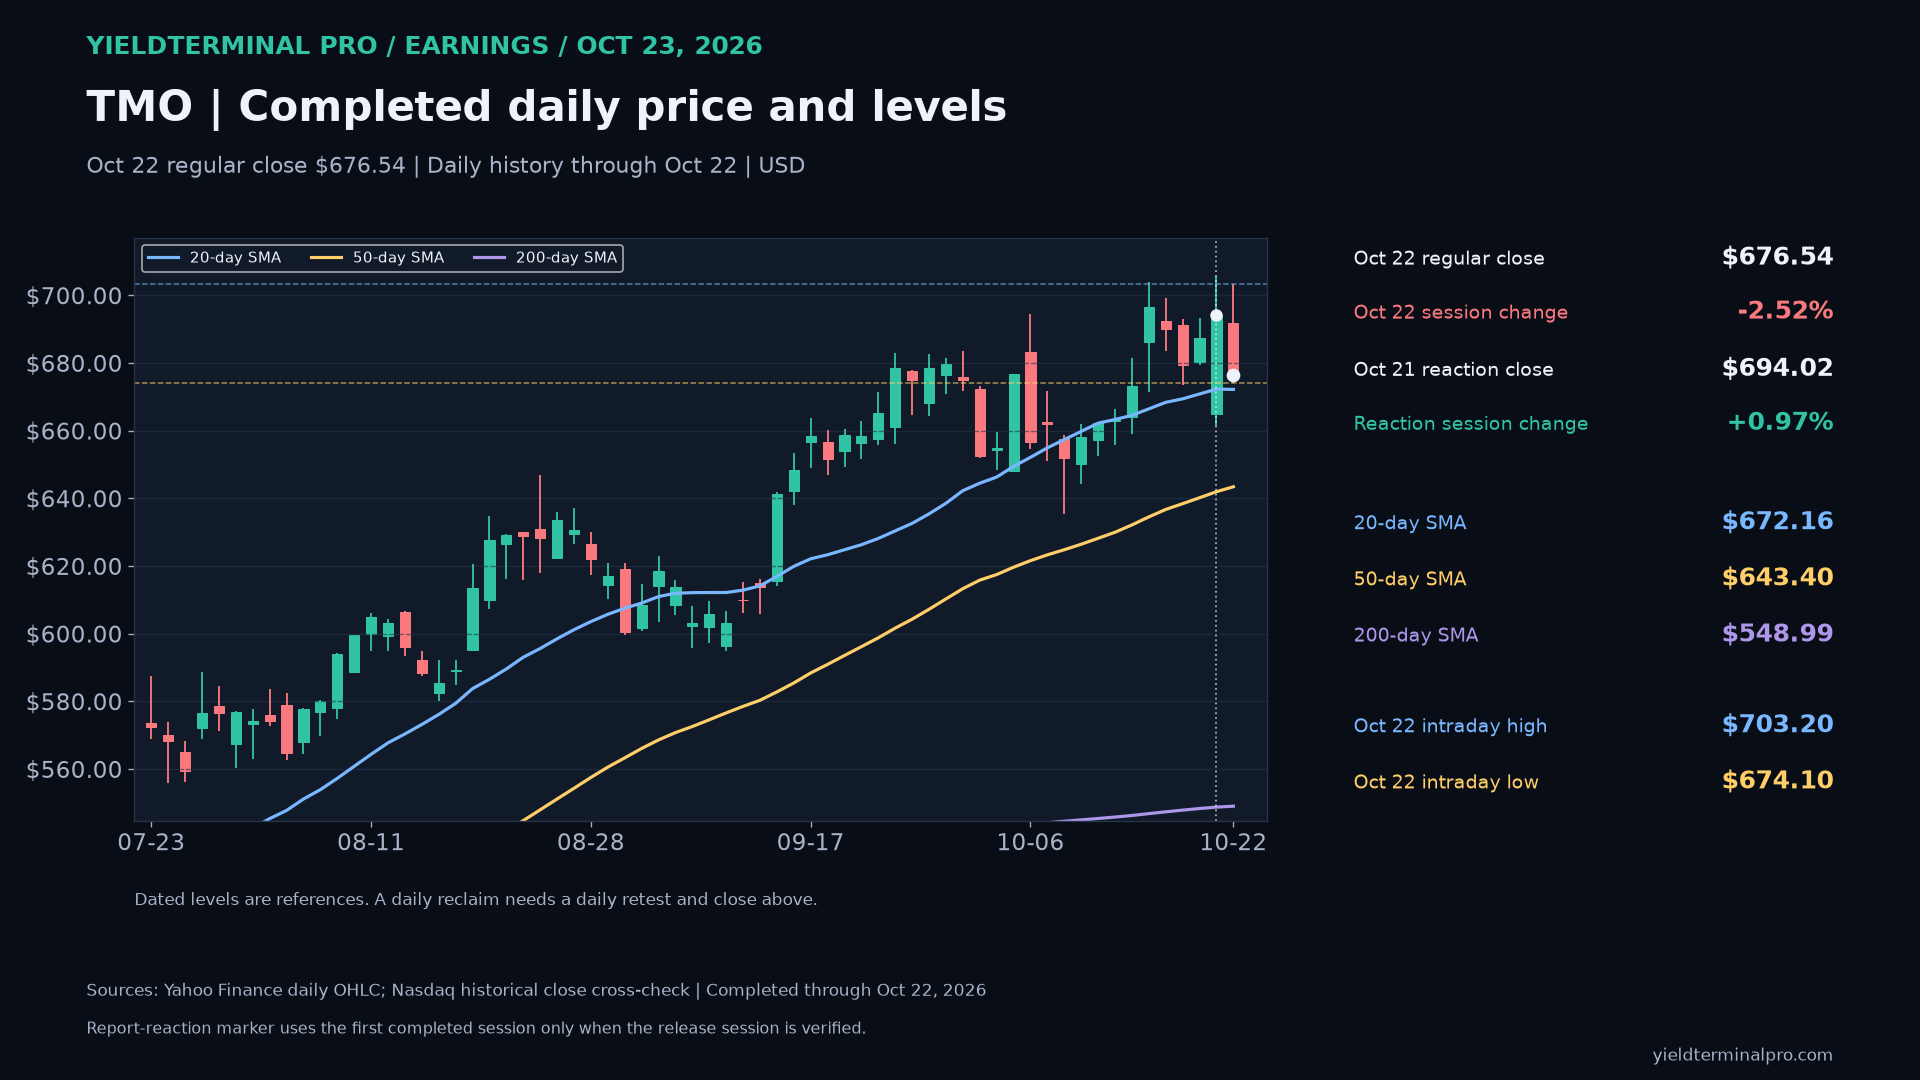
$TMOThermo Fisher Scientific Inc. — October 23 earnings review 676.54October 22 completed regular-session closeTMO closed October 22 at $676.54, above its 50-day average ($643.40) and above its 200-day average ($548.99). The October 22 high ($703.20) and low ($674.10) are dated reference levels. This is completed daily history, not an October 23 quote.
- October 22 intraday high
- 703.20
- October 22 intraday low
- 674.10
- 50-day SMA through October 22
- 643.40
- 200-day SMA through October 22
- 548.99
Levels measured over Completed US regular-session daily history through October 22, 2026. Daily averages use completed closes; earnings result and price session are separate dated evidence.. A level measured over a different window can be a different number.
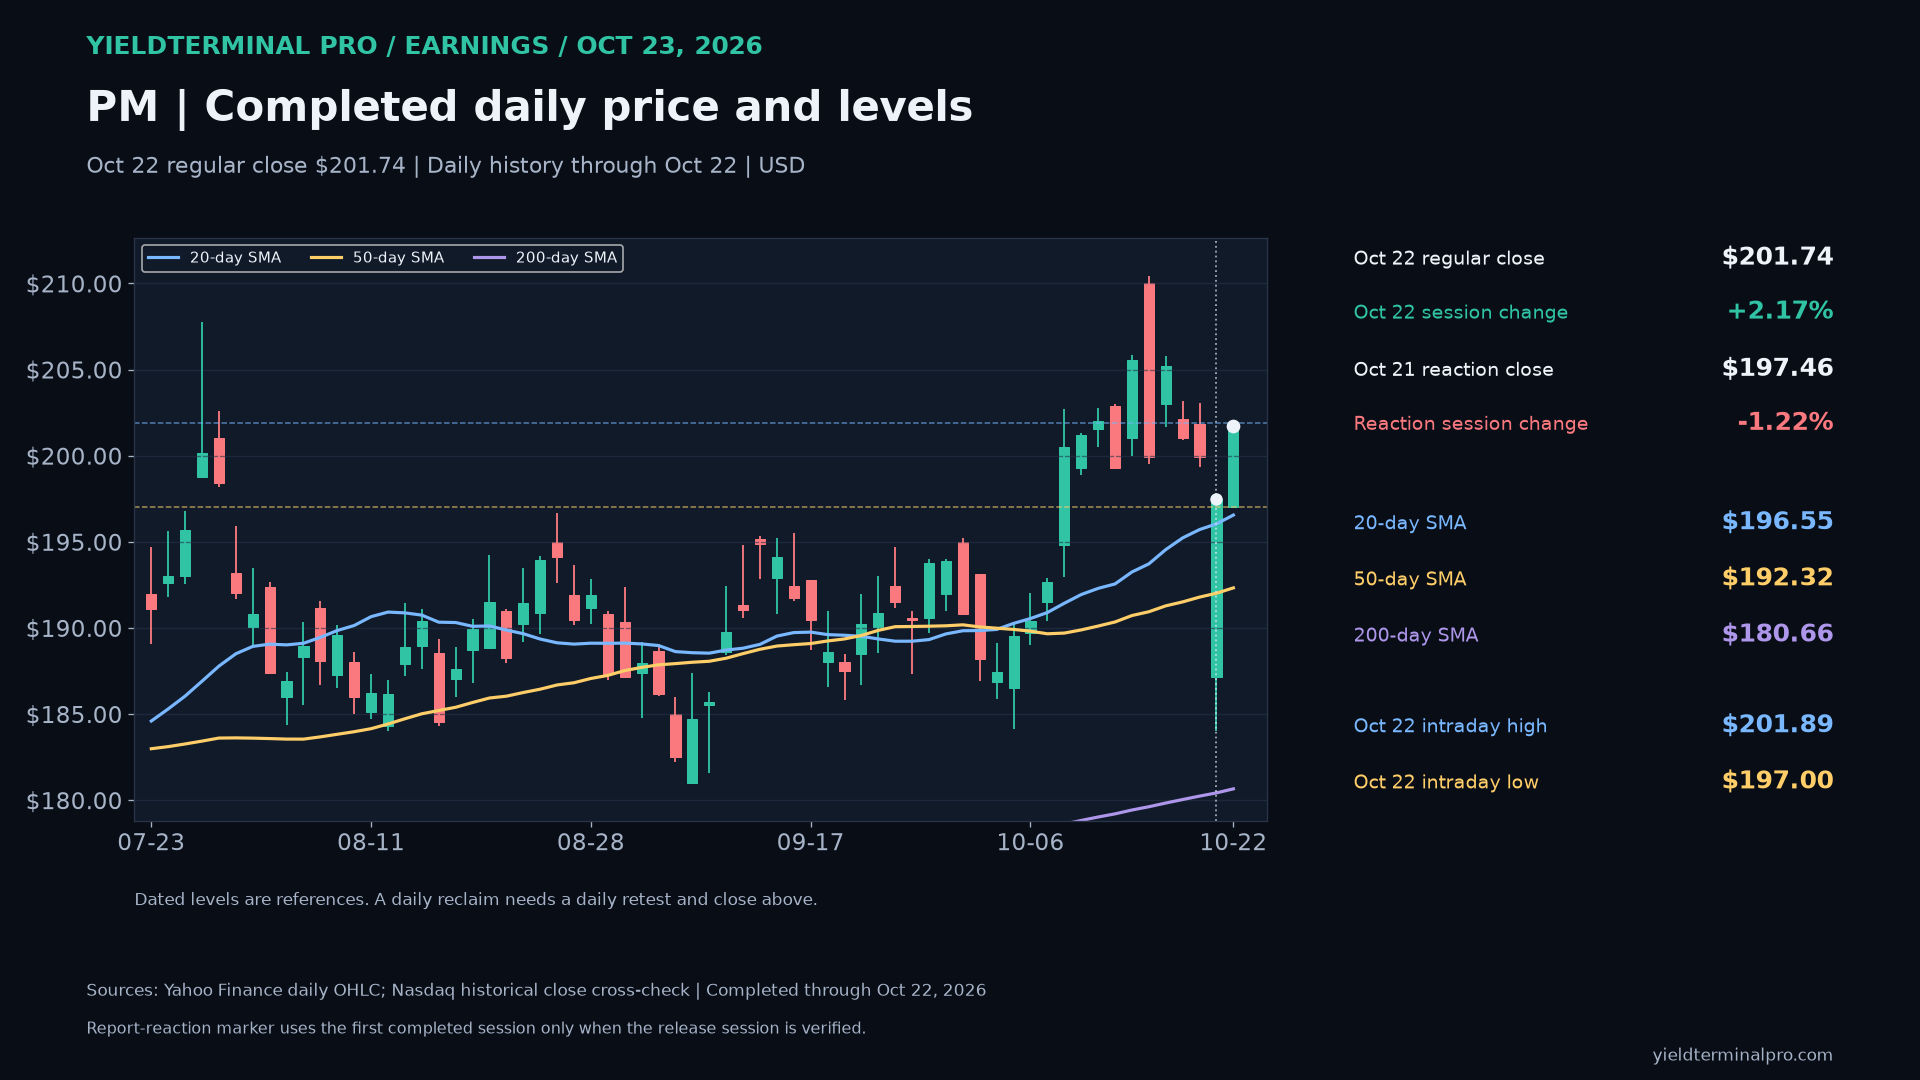
$PMPhilip Morris International — October 23 earnings review 201.74October 22 completed regular-session closePM closed October 22 at $201.74, above its 50-day average ($192.32) and above its 200-day average ($180.66). The October 22 high ($201.89) and low ($197.00) are dated reference levels. This is completed daily history, not an October 23 quote.
- October 22 intraday high
- 201.89
- October 22 intraday low
- 197.00
- 50-day SMA through October 22
- 192.32
- 200-day SMA through October 22
- 180.66
Levels measured over Completed US regular-session daily history through October 22, 2026. Daily averages use completed closes; earnings result and price session are separate dated evidence.. A level measured over a different window can be a different number.
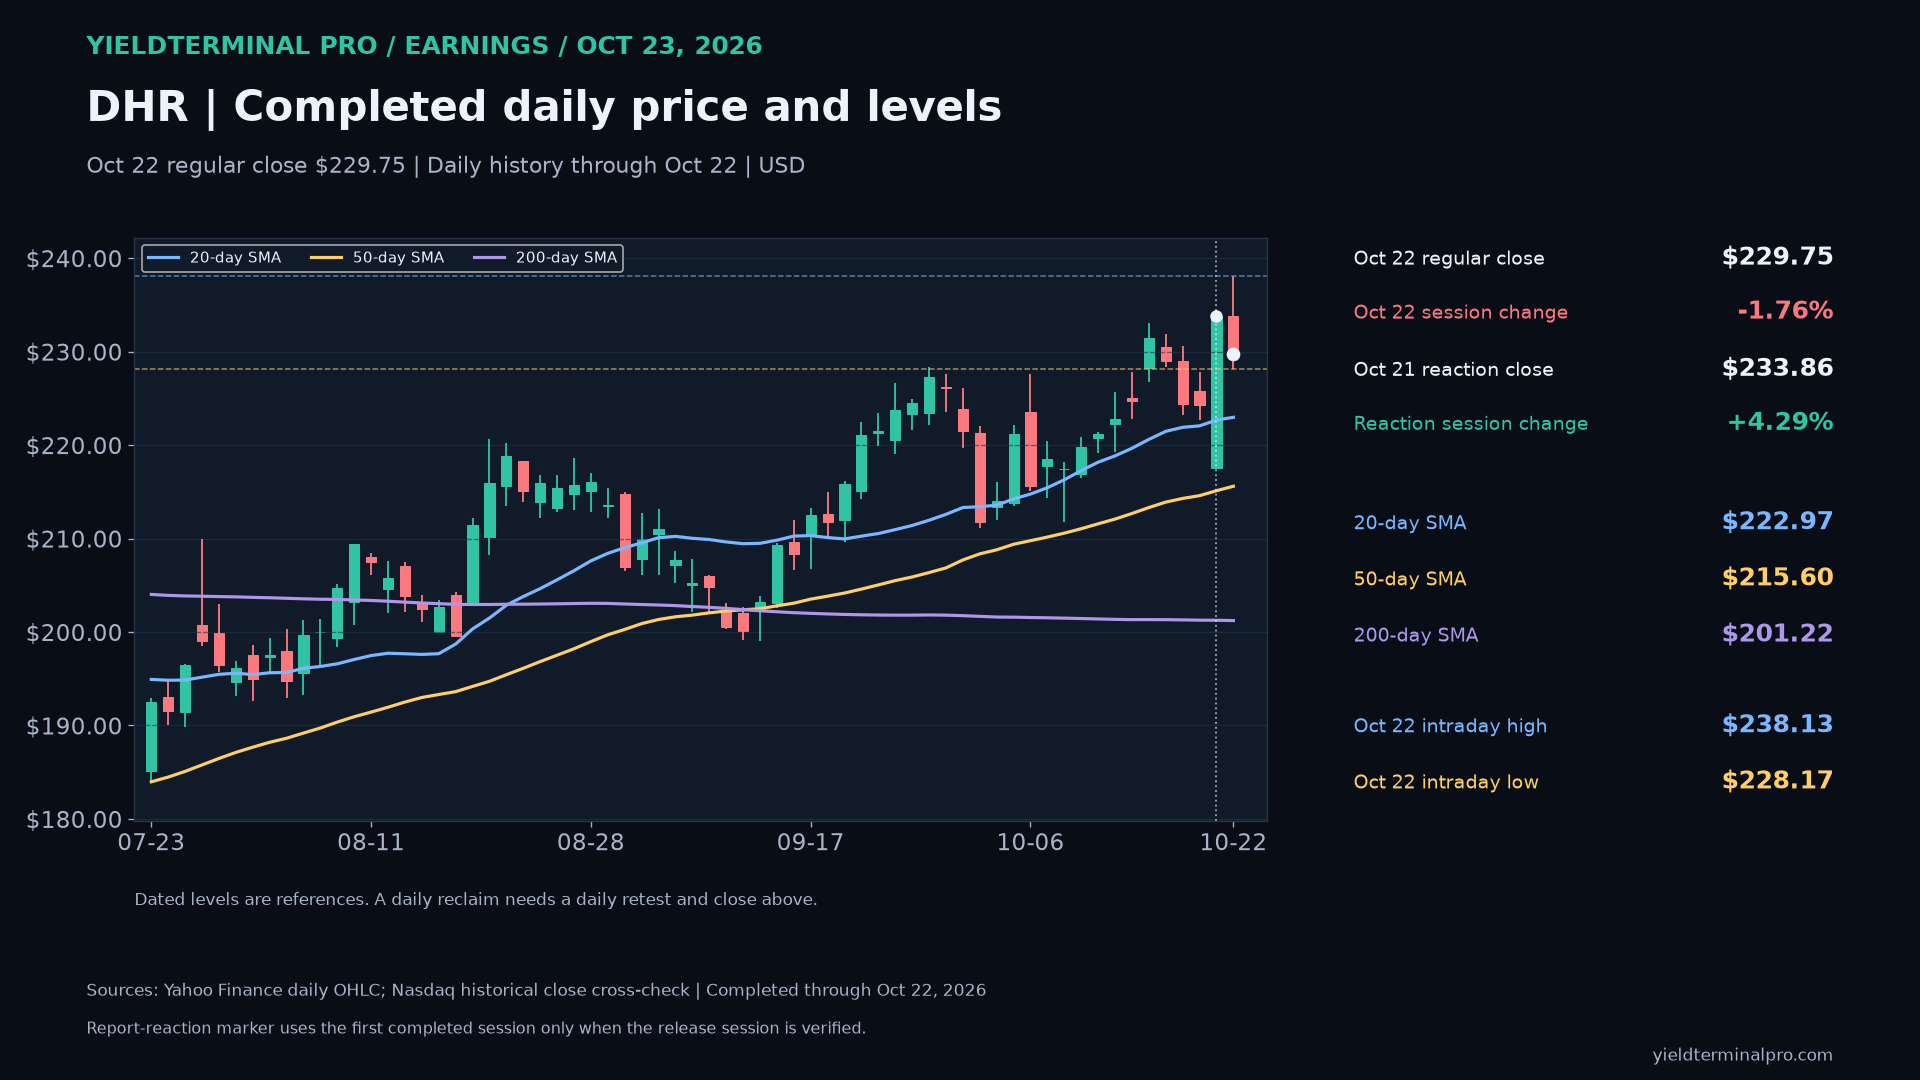
$DHRDanaher — October 23 earnings review 229.75October 22 completed regular-session closeDHR closed October 22 at $229.75, above its 50-day average ($215.60) and above its 200-day average ($201.22). The October 22 high ($238.13) and low ($228.17) are dated reference levels. This is completed daily history, not an October 23 quote.
- October 22 intraday high
- 238.13
- October 22 intraday low
- 228.17
- 50-day SMA through October 22
- 215.60
- 200-day SMA through October 22
- 201.22
Levels measured over Completed US regular-session daily history through October 22, 2026. Daily averages use completed closes; earnings result and price session are separate dated evidence.. A level measured over a different window can be a different number.
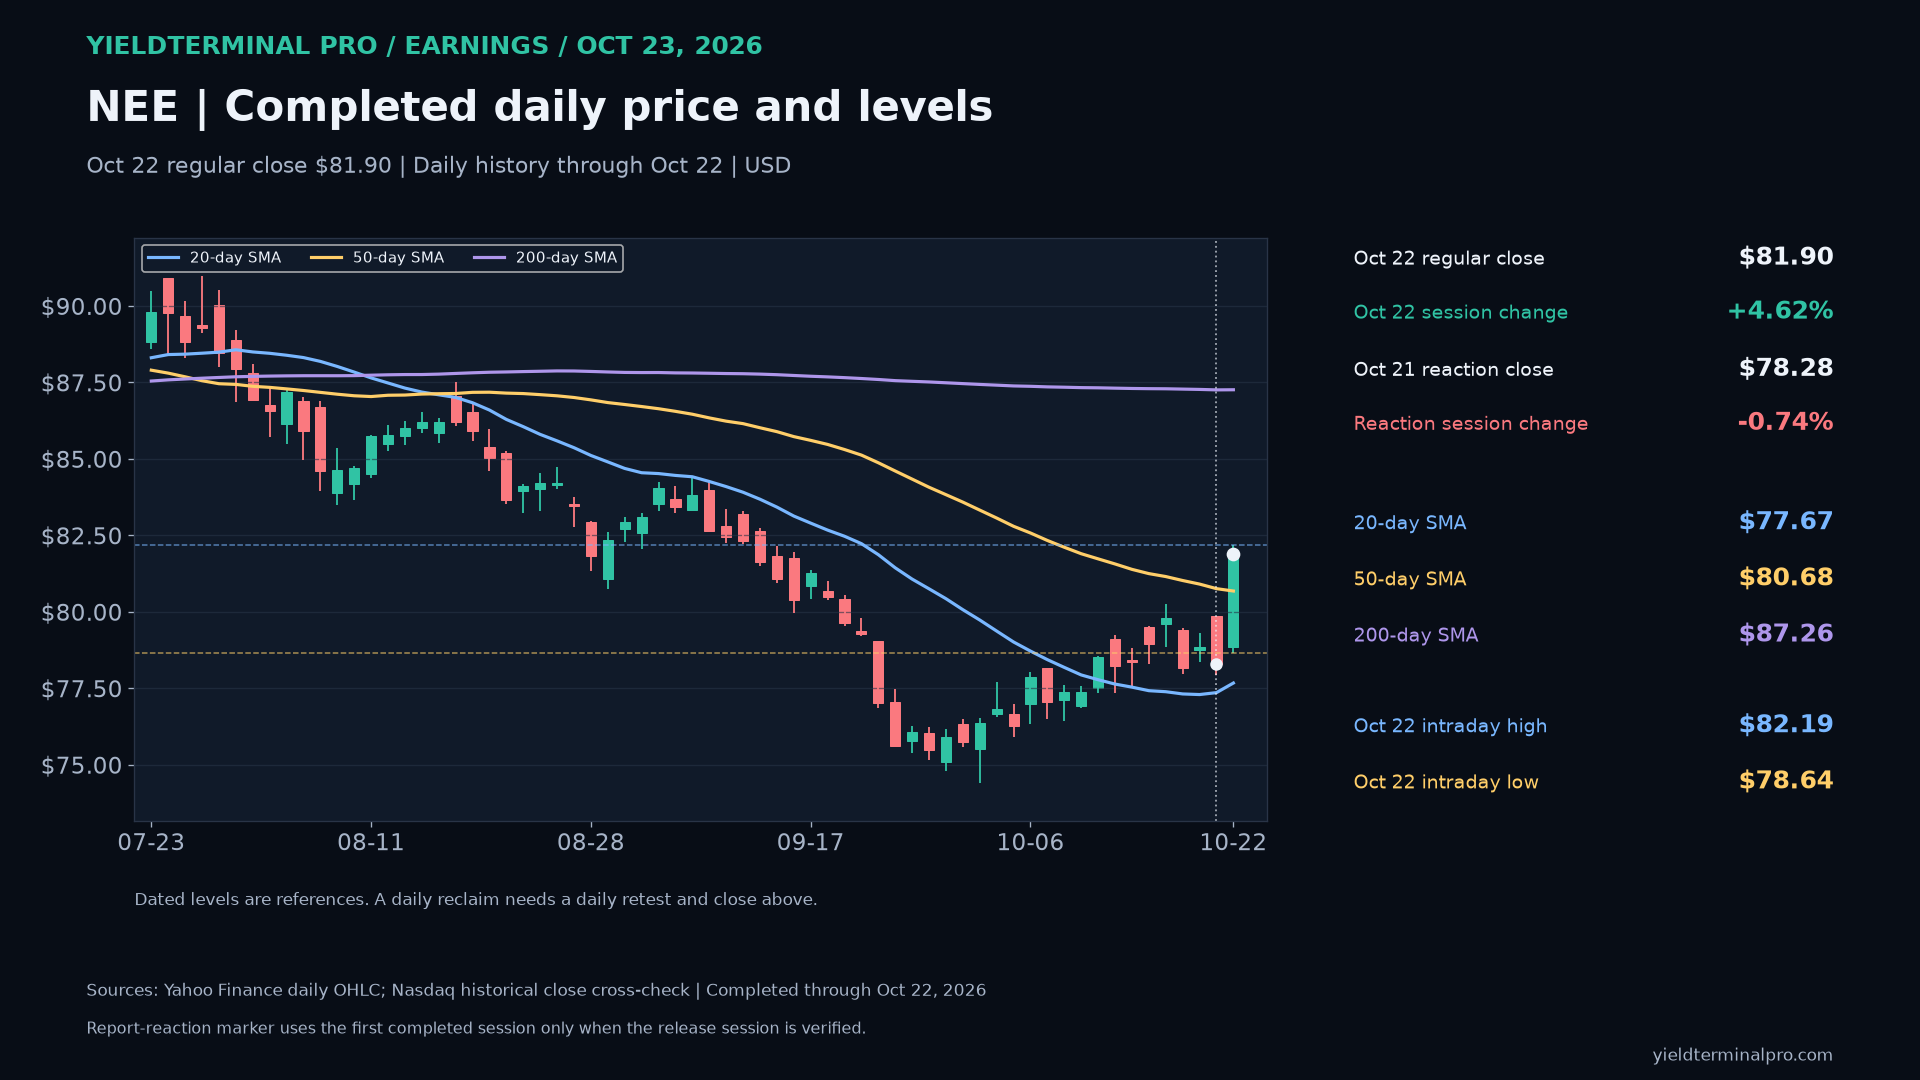
$NEENextEra Energy — October 23 earnings review 81.90October 22 completed regular-session closeNEE closed October 22 at $81.90, above its 50-day average ($80.68) and below its 200-day average ($87.26). The October 22 high ($82.19) and low ($78.64) are dated reference levels. This is completed daily history, not an October 23 quote.
- October 22 intraday high
- 82.19
- October 22 intraday low
- 78.64
- 50-day SMA through October 22
- 80.68
- 200-day SMA through October 22
- 87.26
Levels measured over Completed US regular-session daily history through October 22, 2026. Daily averages use completed closes; earnings result and price session are separate dated evidence.. A level measured over a different window can be a different number.
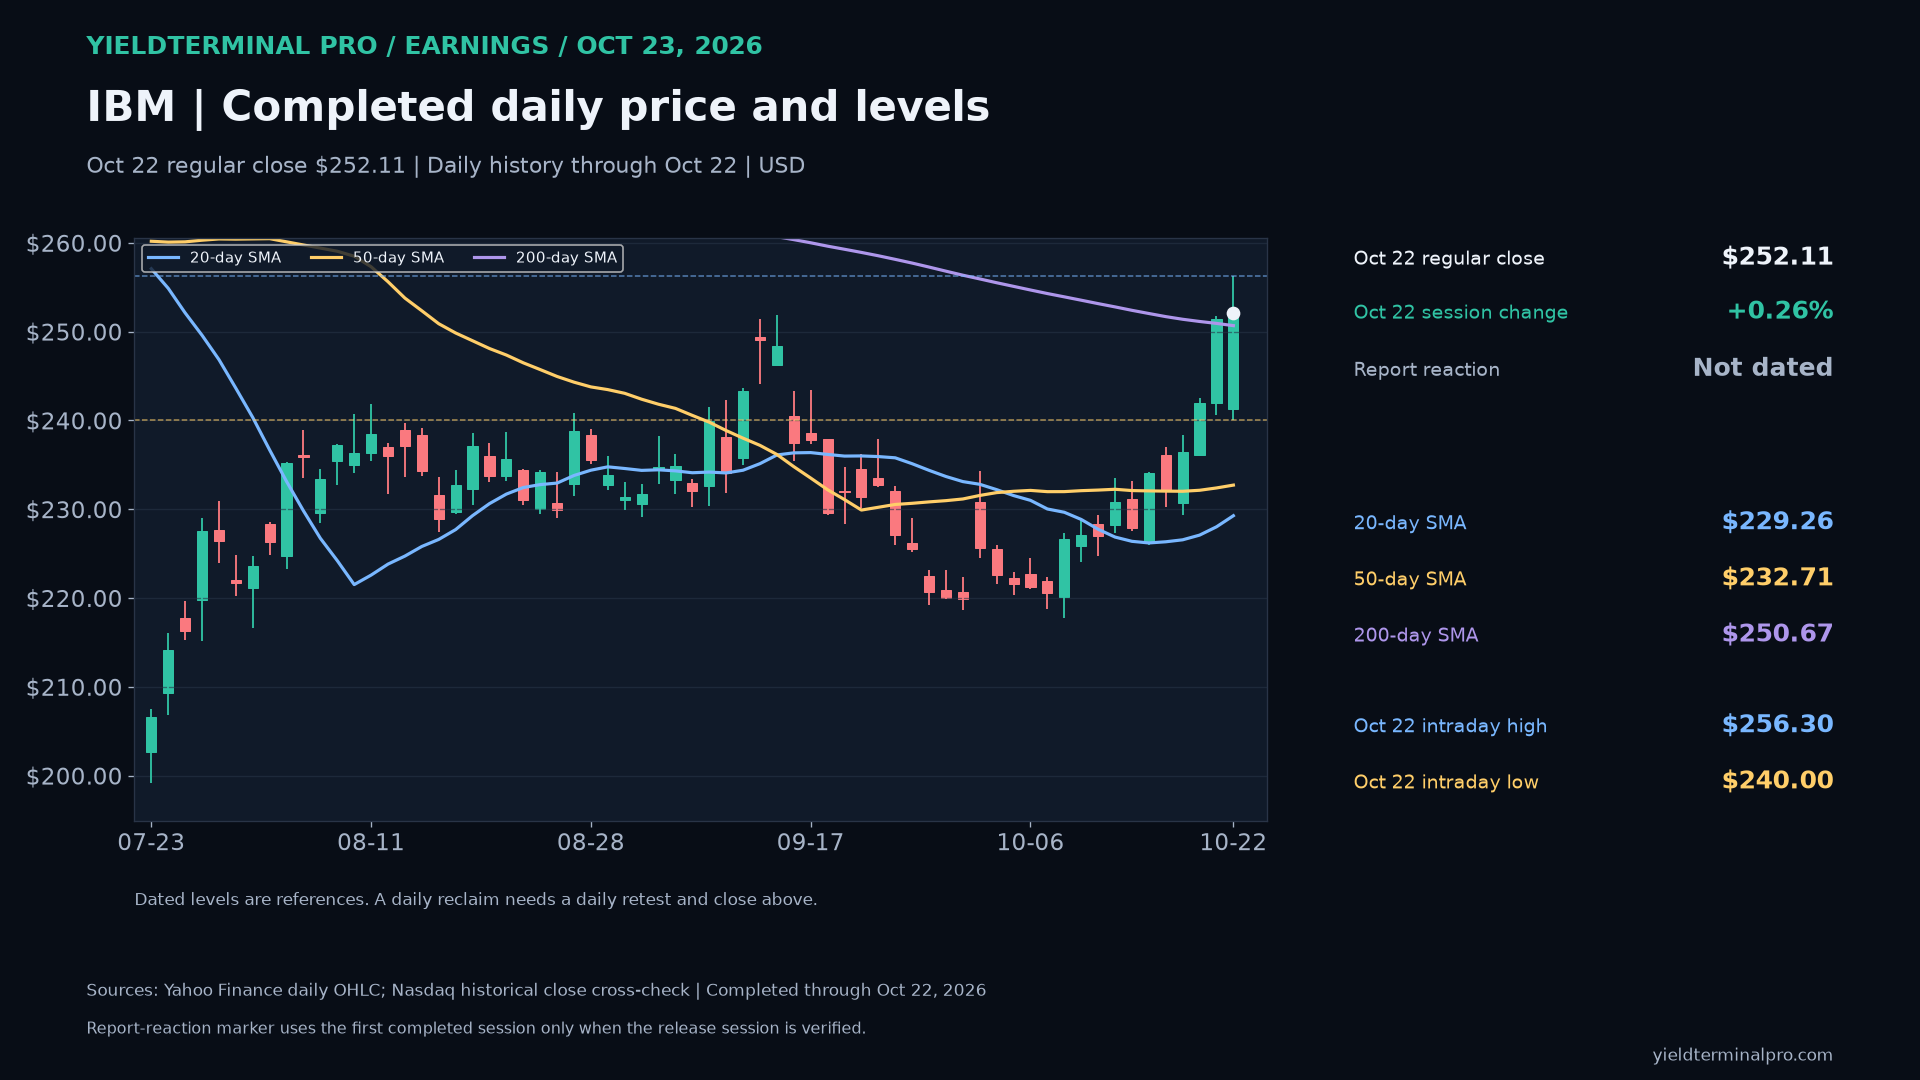
$IBMInternational Business Machines Corporation — October 23 earnings review 252.11October 22 completed regular-session closeIBM closed October 22 at $252.11, above its 50-day average ($232.71) and above its 200-day average ($250.67). The October 22 high ($256.30) and low ($240.00) are dated reference levels. This is completed daily history, not an October 23 quote.
- October 22 intraday high
- 256.30
- October 22 intraday low
- 240.00
- 50-day SMA through October 22
- 232.71
- 200-day SMA through October 22
- 250.67
Levels measured over Completed US regular-session daily history through October 22, 2026. Daily averages use completed closes; earnings result and price session are separate dated evidence.. A level measured over a different window can be a different number.
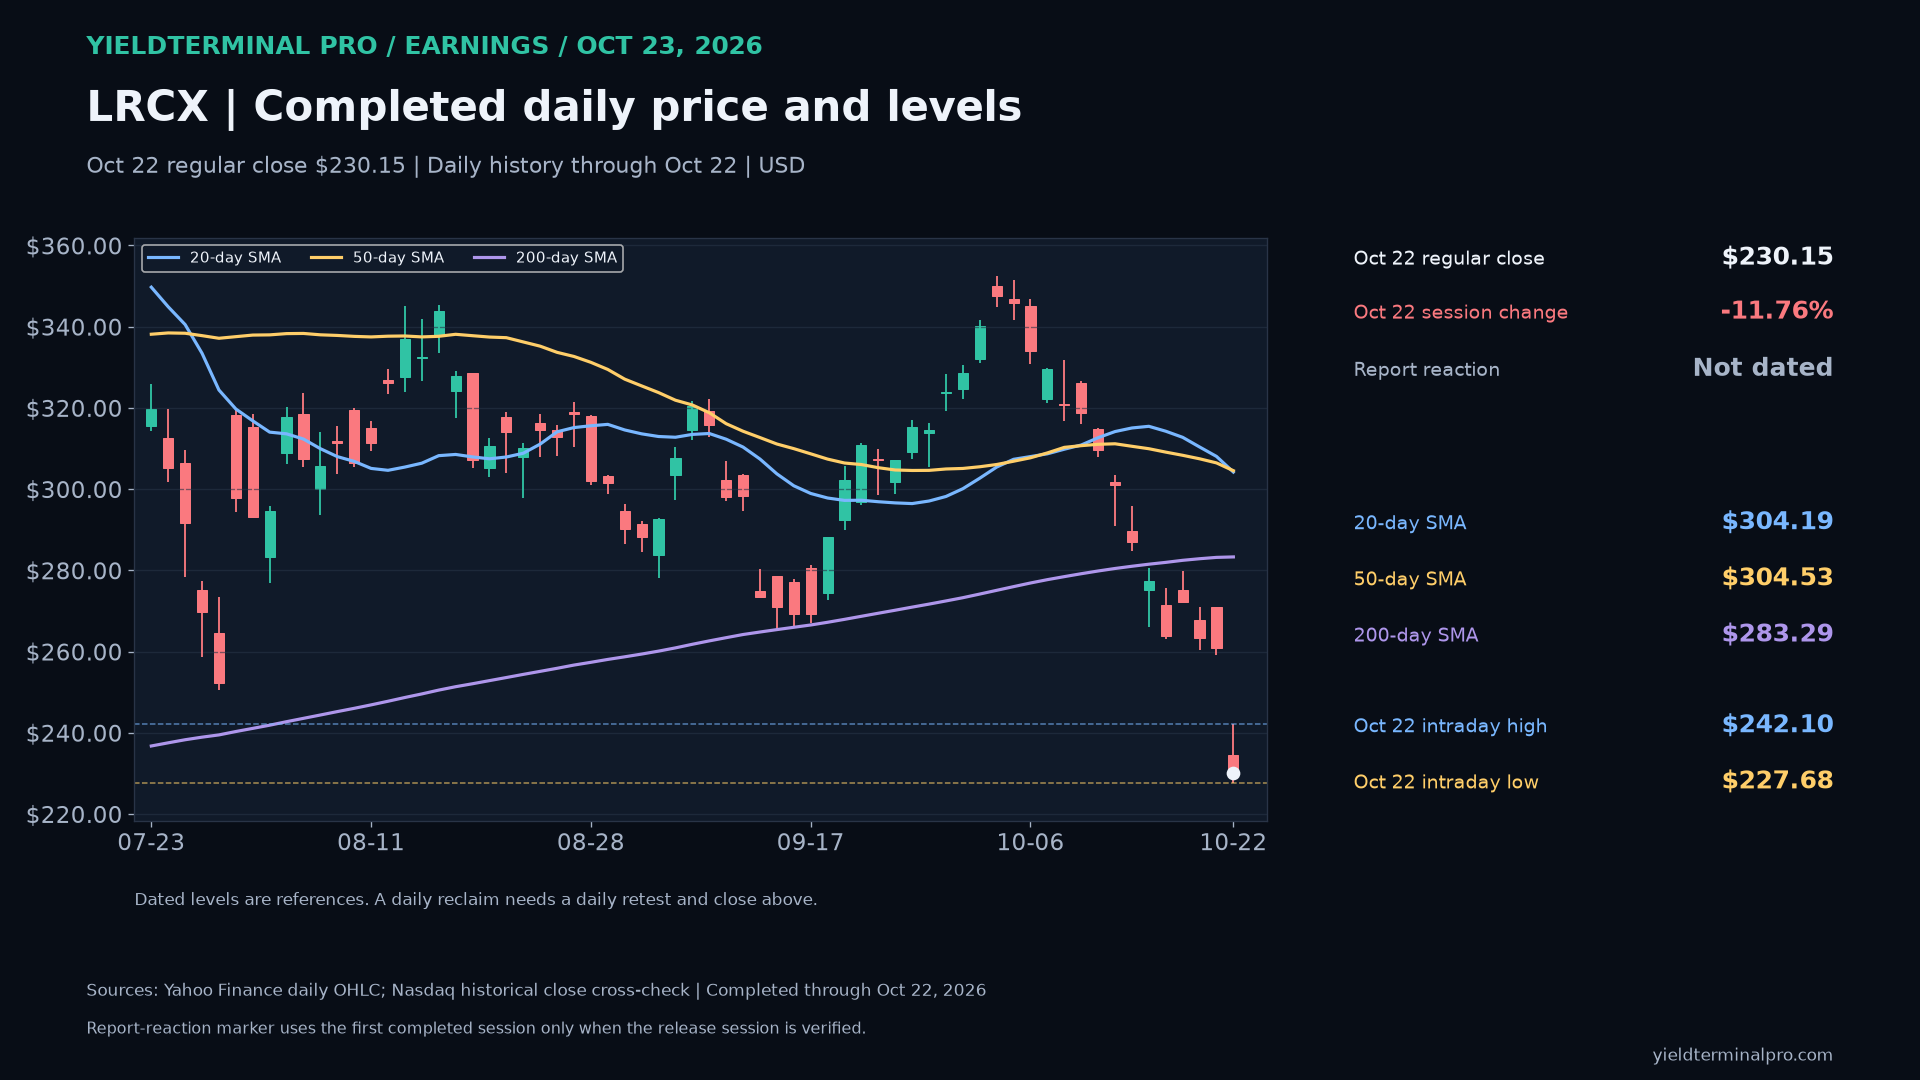
$LRCXLam Research Corporation — October 23 earnings review 230.15October 22 completed regular-session closeLRCX closed October 22 at $230.15, below its 50-day average ($304.53) and below its 200-day average ($283.29). The October 22 high ($242.10) and low ($227.68) are dated reference levels. This is completed daily history, not an October 23 quote.
- October 22 intraday high
- 242.10
- October 22 intraday low
- 227.68
- 50-day SMA through October 22
- 304.53
- 200-day SMA through October 22
- 283.29
Levels measured over Completed US regular-session daily history through October 22, 2026. Daily averages use completed closes; earnings result and price session are separate dated evidence.. A level measured over a different window can be a different number.
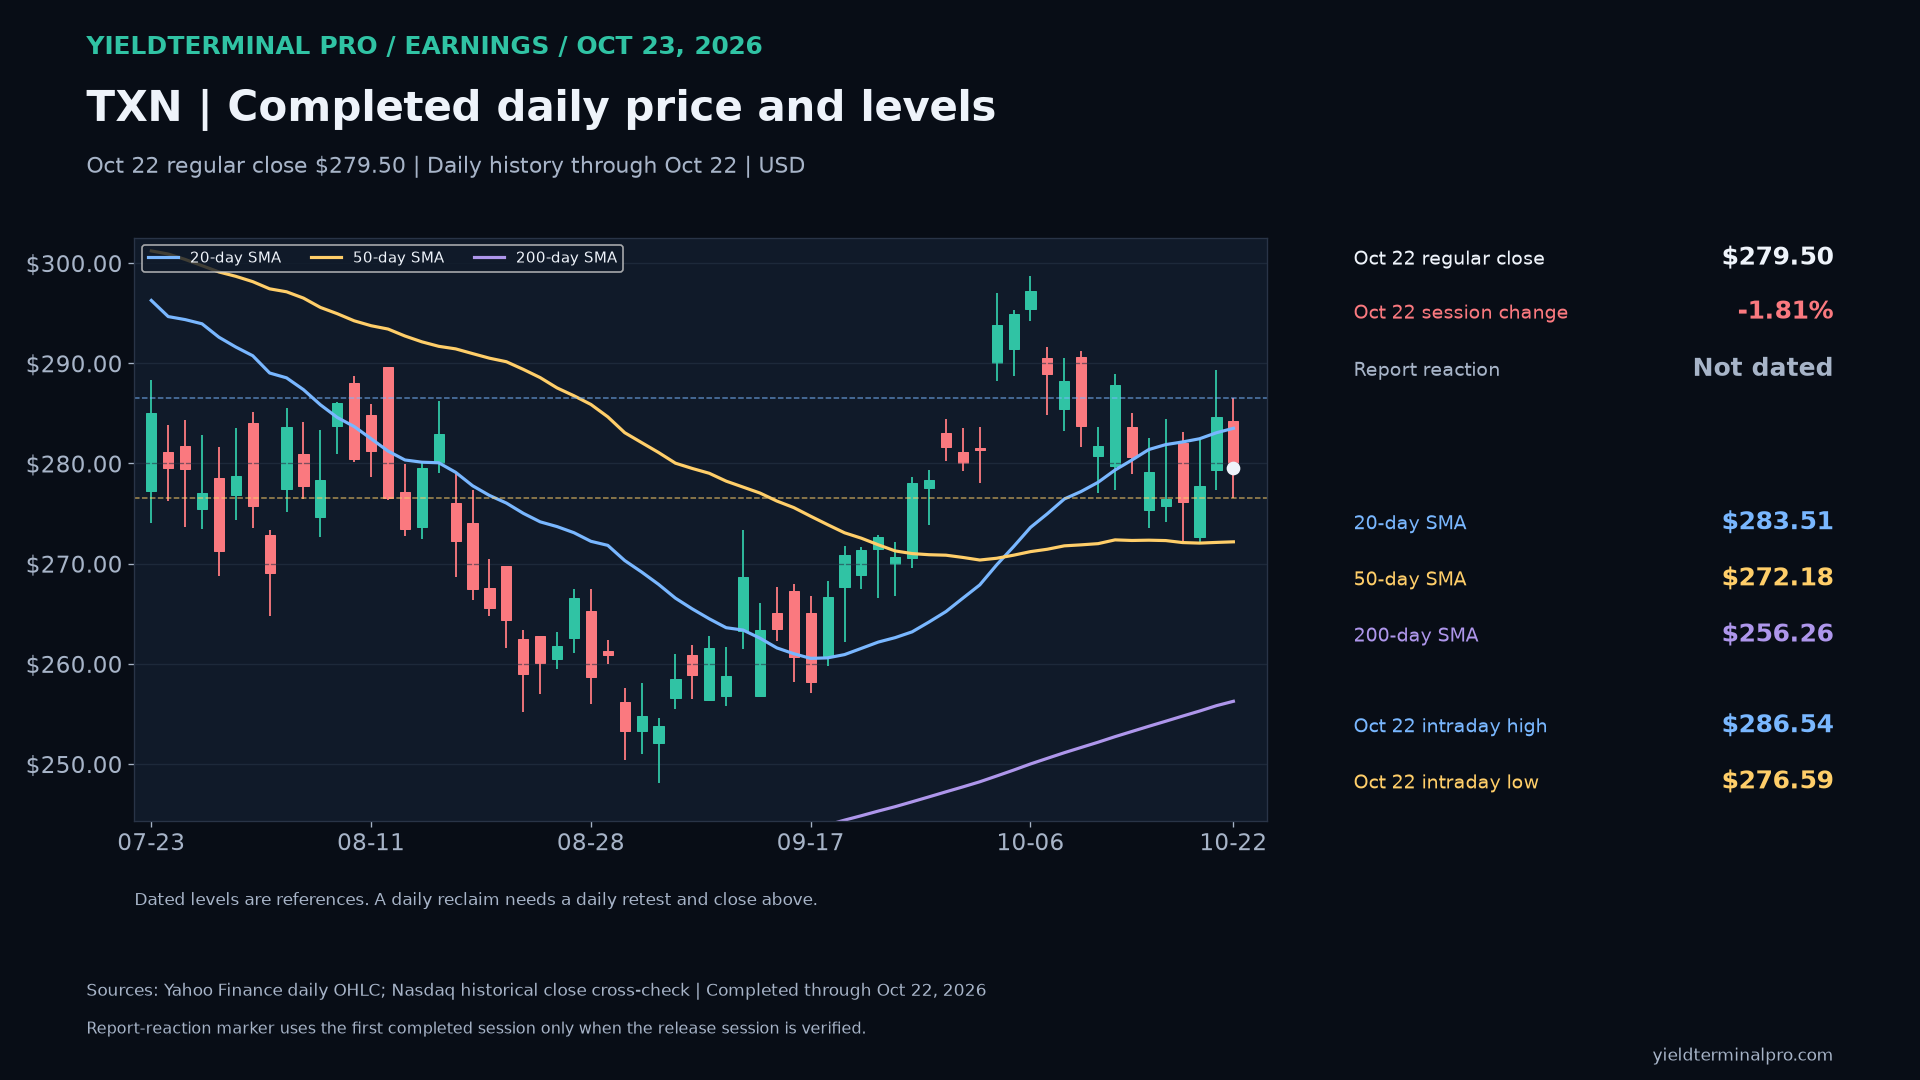
$TXNTexas Instruments Incorporated — October 23 earnings review 279.50October 22 completed regular-session closeTXN closed October 22 at $279.50, above its 50-day average ($272.18) and above its 200-day average ($256.26). The October 22 high ($286.54) and low ($276.59) are dated reference levels. This is completed daily history, not an October 23 quote.
- October 22 intraday high
- 286.54
- October 22 intraday low
- 276.59
- 50-day SMA through October 22
- 272.18
- 200-day SMA through October 22
- 256.26
Levels measured over Completed US regular-session daily history through October 22, 2026. Daily averages use completed closes; earnings result and price session are separate dated evidence.. A level measured over a different window can be a different number.
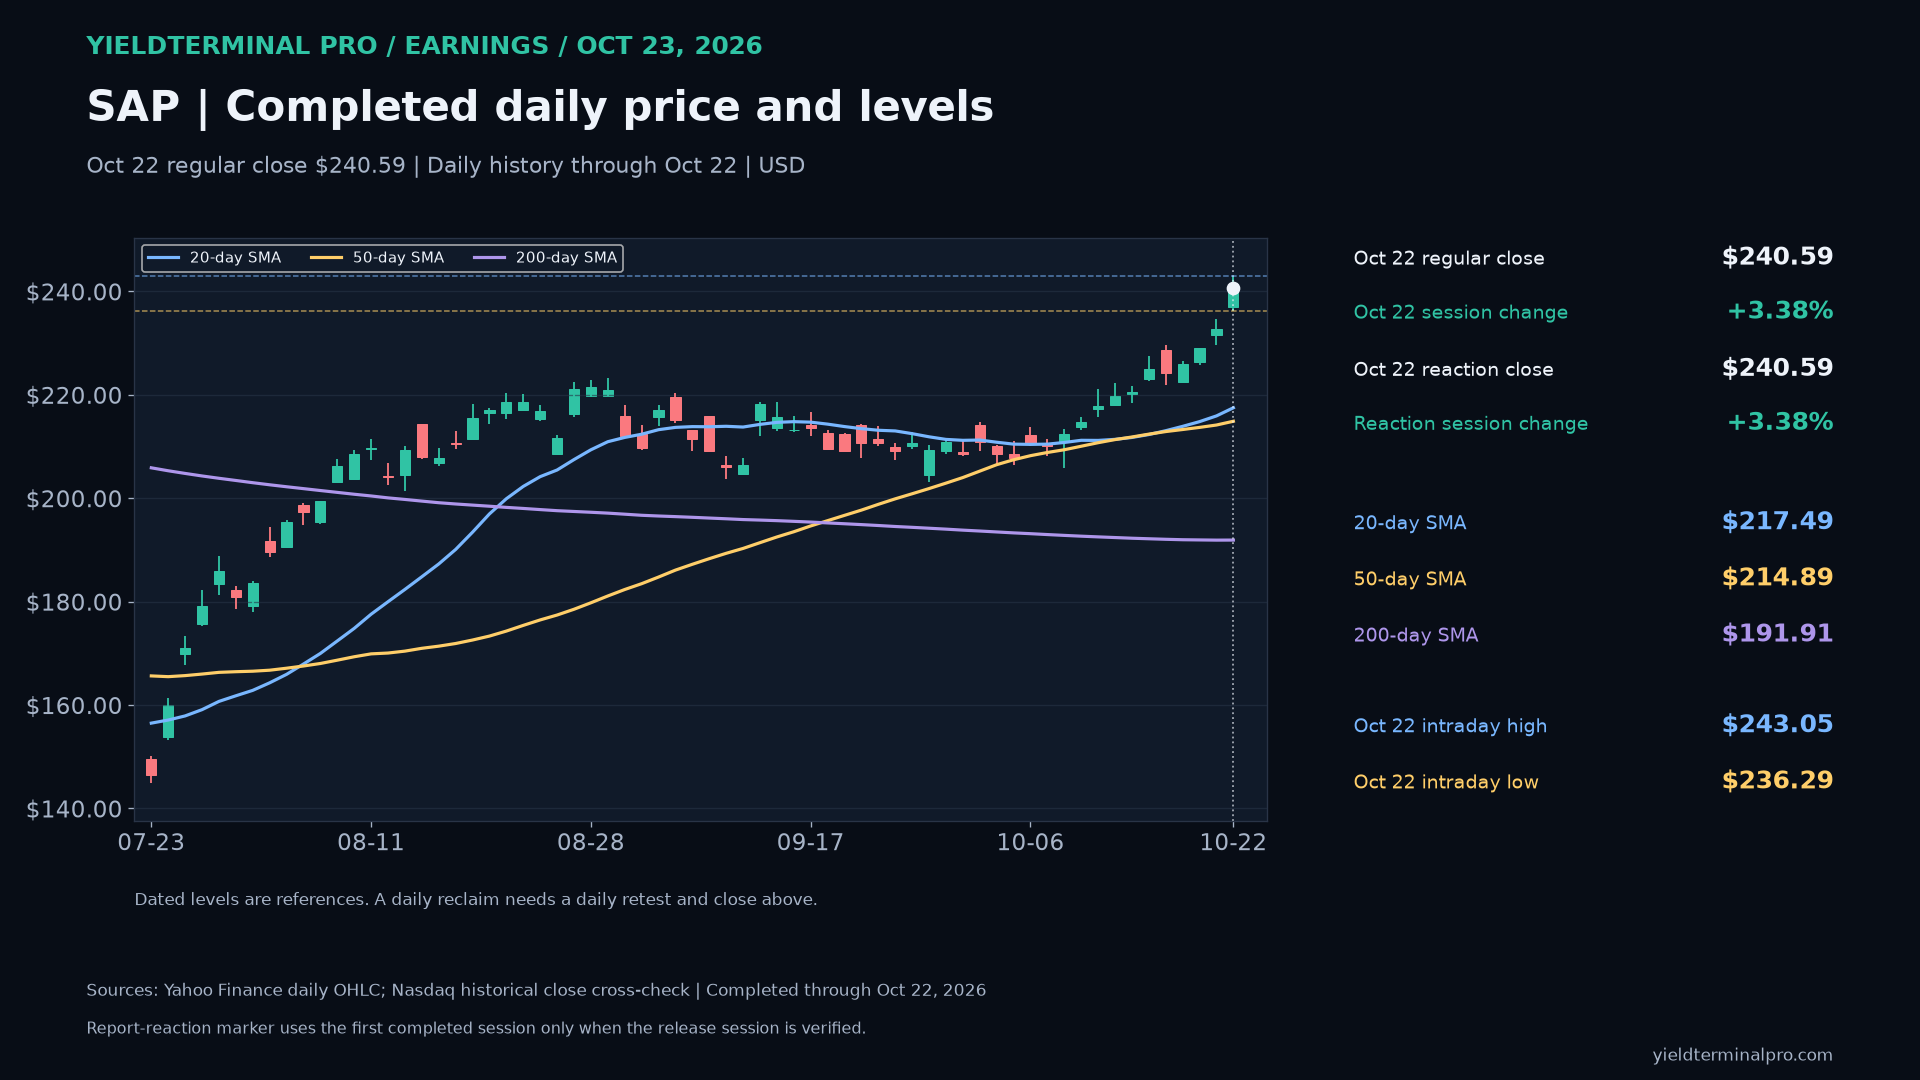
$SAPSAP SE — October 23 earnings review 240.59October 22 completed regular-session closeSAP closed October 22 at $240.59, above its 50-day average ($214.89) and above its 200-day average ($191.91). The October 22 high ($243.05) and low ($236.29) are dated reference levels. This is completed daily history, not an October 23 quote.
- October 22 intraday high
- 243.05
- October 22 intraday low
- 236.29
- 50-day SMA through October 22
- 214.89
- 200-day SMA through October 22
- 191.91
Levels measured over Completed US regular-session daily history through October 22, 2026. Daily averages use completed closes; earnings result and price session are separate dated evidence.. A level measured over a different window can be a different number.
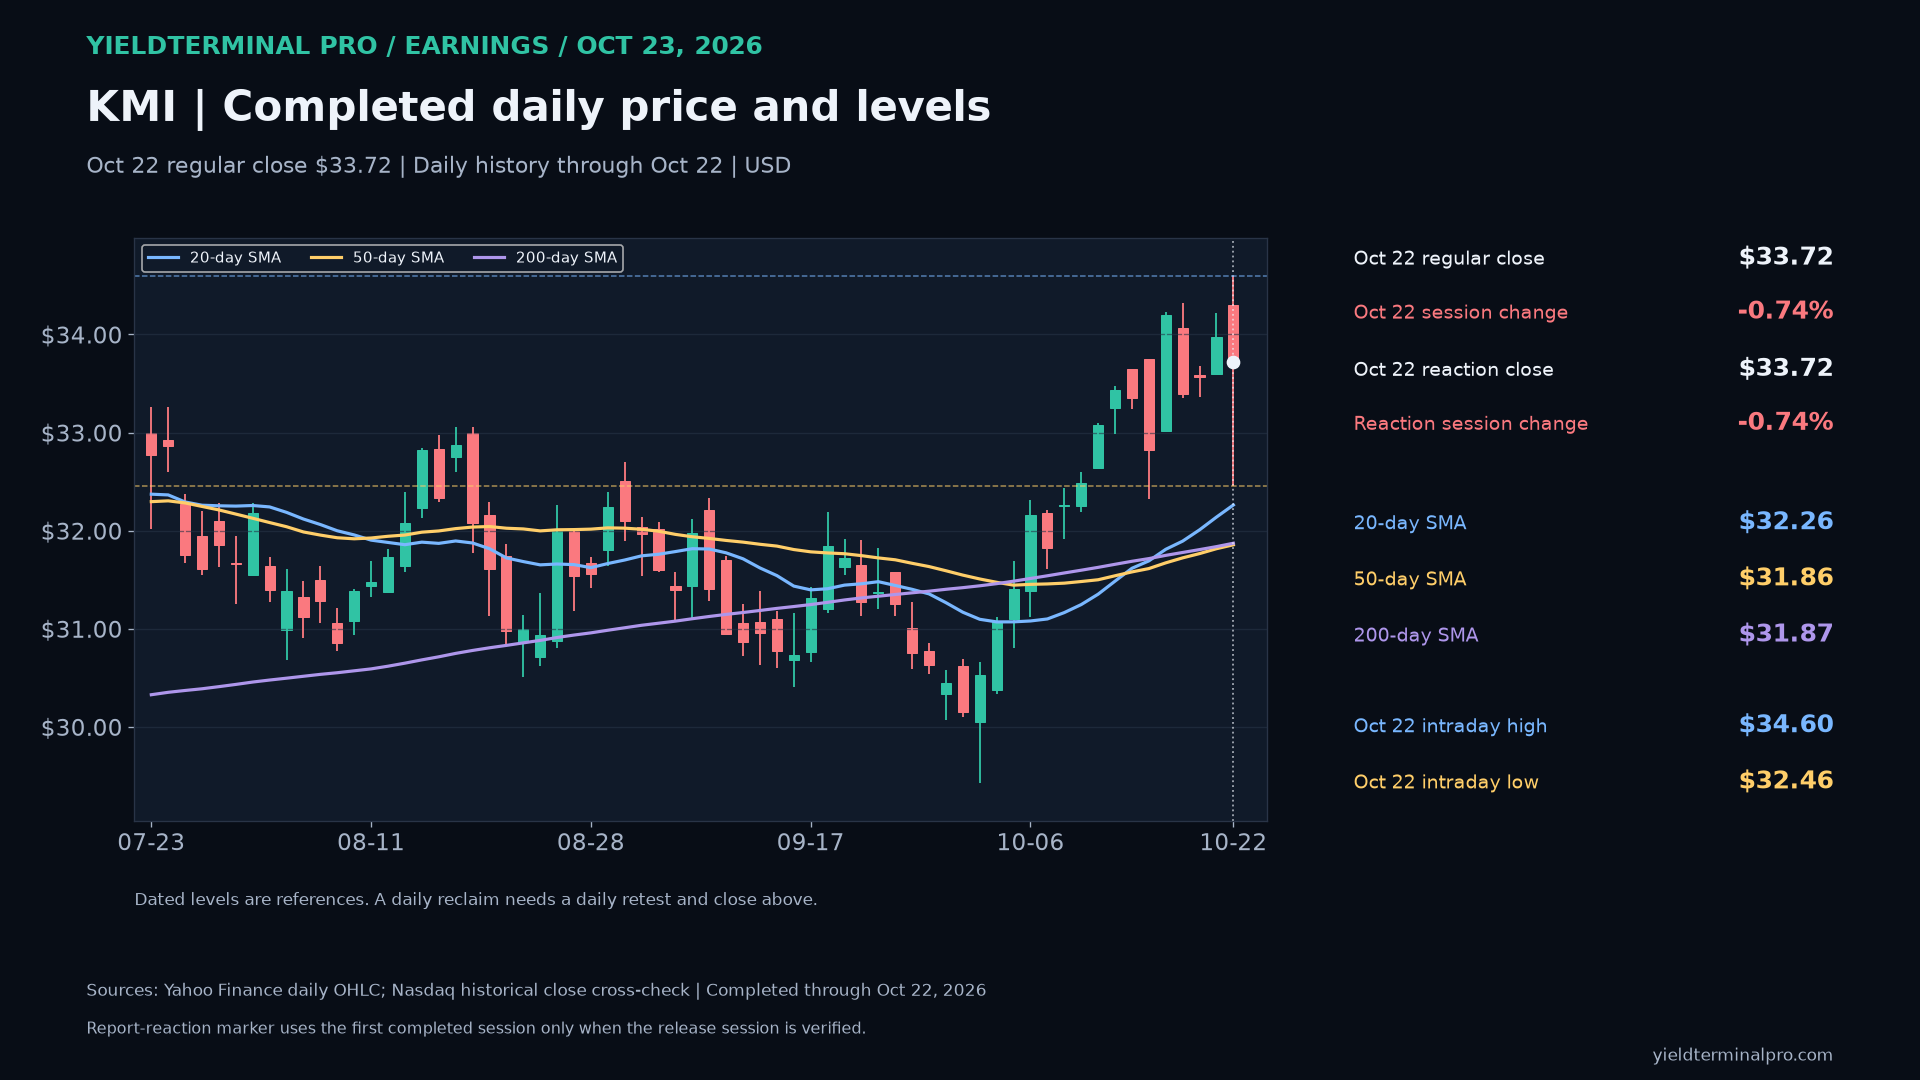
$KMIKinder Morgan — October 23 earnings review 33.72October 22 completed regular-session closeKMI closed October 22 at $33.72, above its 50-day average ($31.86) and above its 200-day average ($31.87). The October 22 high ($34.60) and low ($32.46) are dated reference levels. This is completed daily history, not an October 23 quote.
- October 22 intraday high
- 34.60
- October 22 intraday low
- 32.46
- 50-day SMA through October 22
- 31.86
- 200-day SMA through October 22
- 31.87
Levels measured over Completed US regular-session daily history through October 22, 2026. Daily averages use completed closes; earnings result and price session are separate dated evidence.. A level measured over a different window can be a different number.
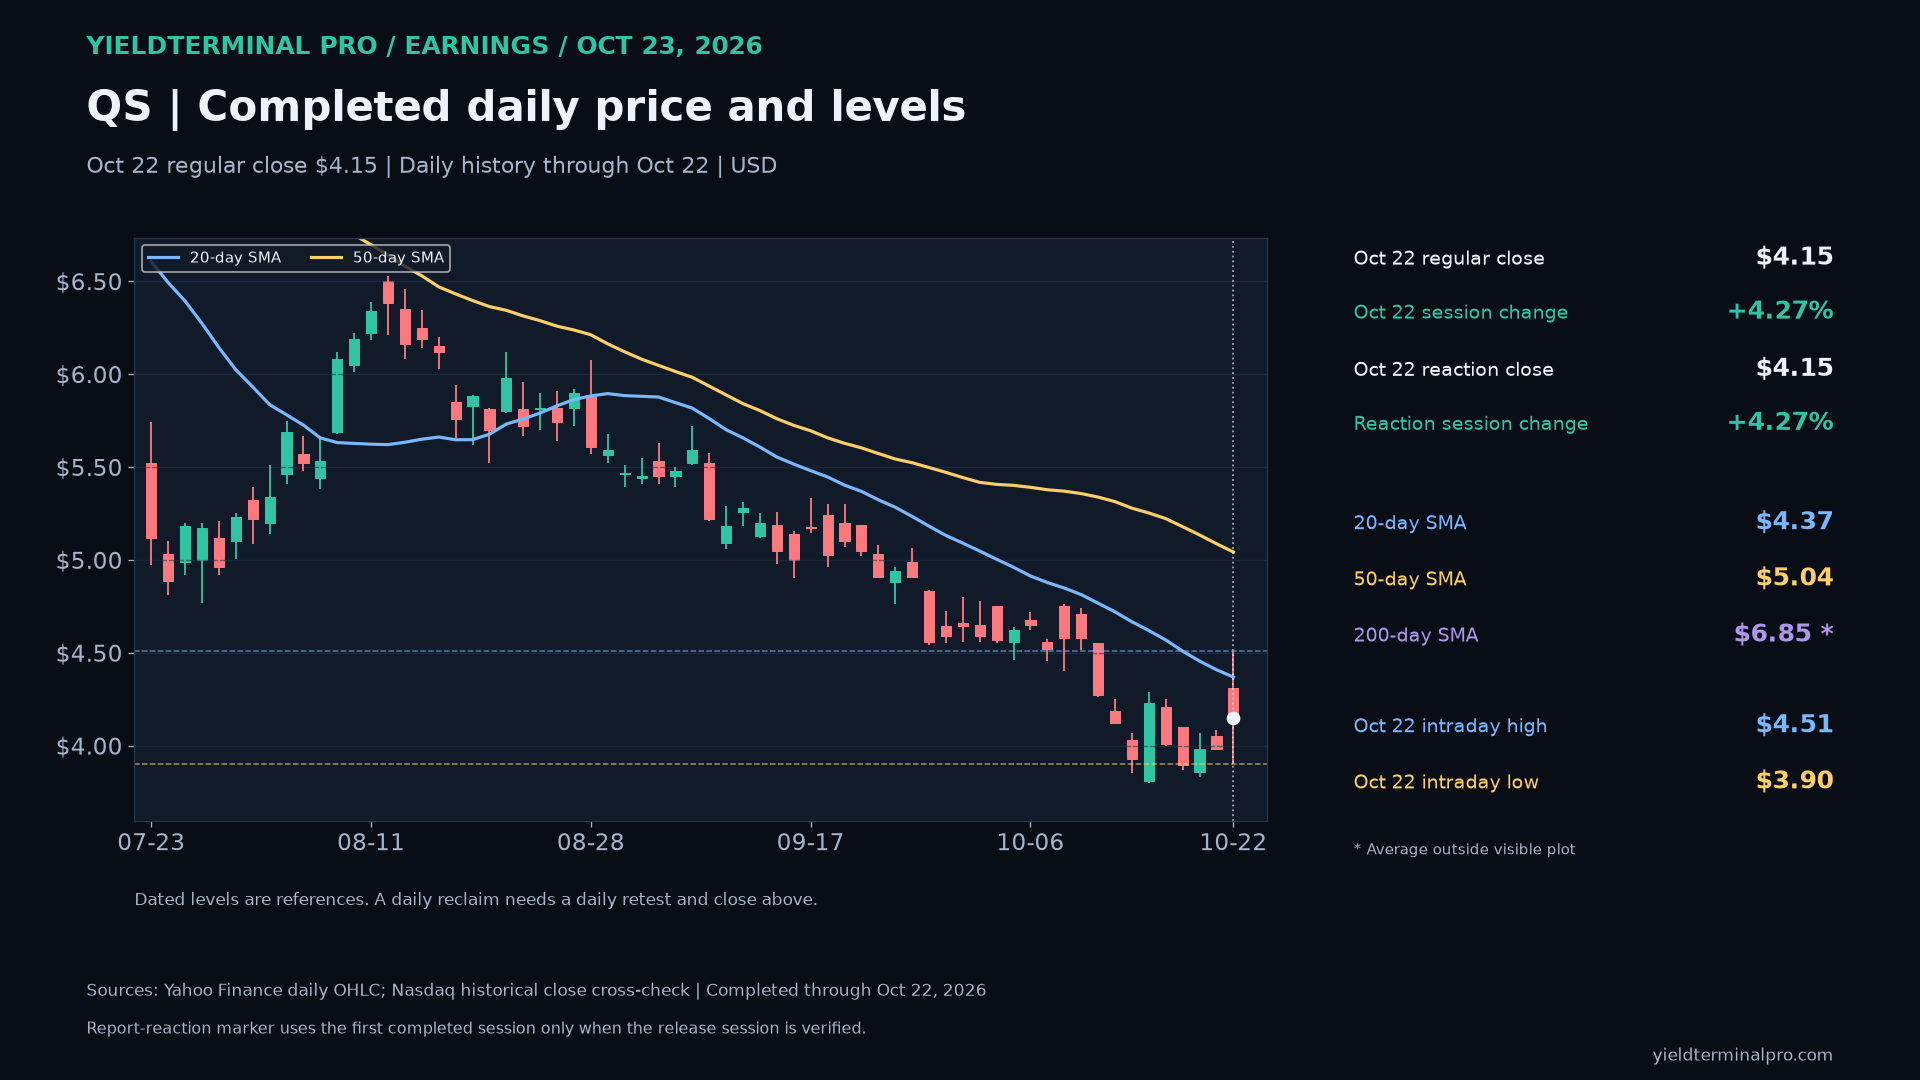
$QSQuantumScape — October 23 earnings review 4.15October 22 completed regular-session closeQS closed October 22 at $4.15, below its 50-day average ($5.04) and below its 200-day average ($6.85). The October 22 high ($4.51) and low ($3.90) are dated reference levels. This is completed daily history, not an October 23 quote. The 200-day average lies outside the visible plot.
- October 22 intraday high
- 4.51
- October 22 intraday low
- 3.90
- 50-day SMA through October 22
- 5.04
- 200-day SMA through October 22
- 6.85
Levels measured over Completed US regular-session daily history through October 22, 2026. Daily averages use completed closes; earnings result and price session are separate dated evidence.. A level measured over a different window can be a different number.
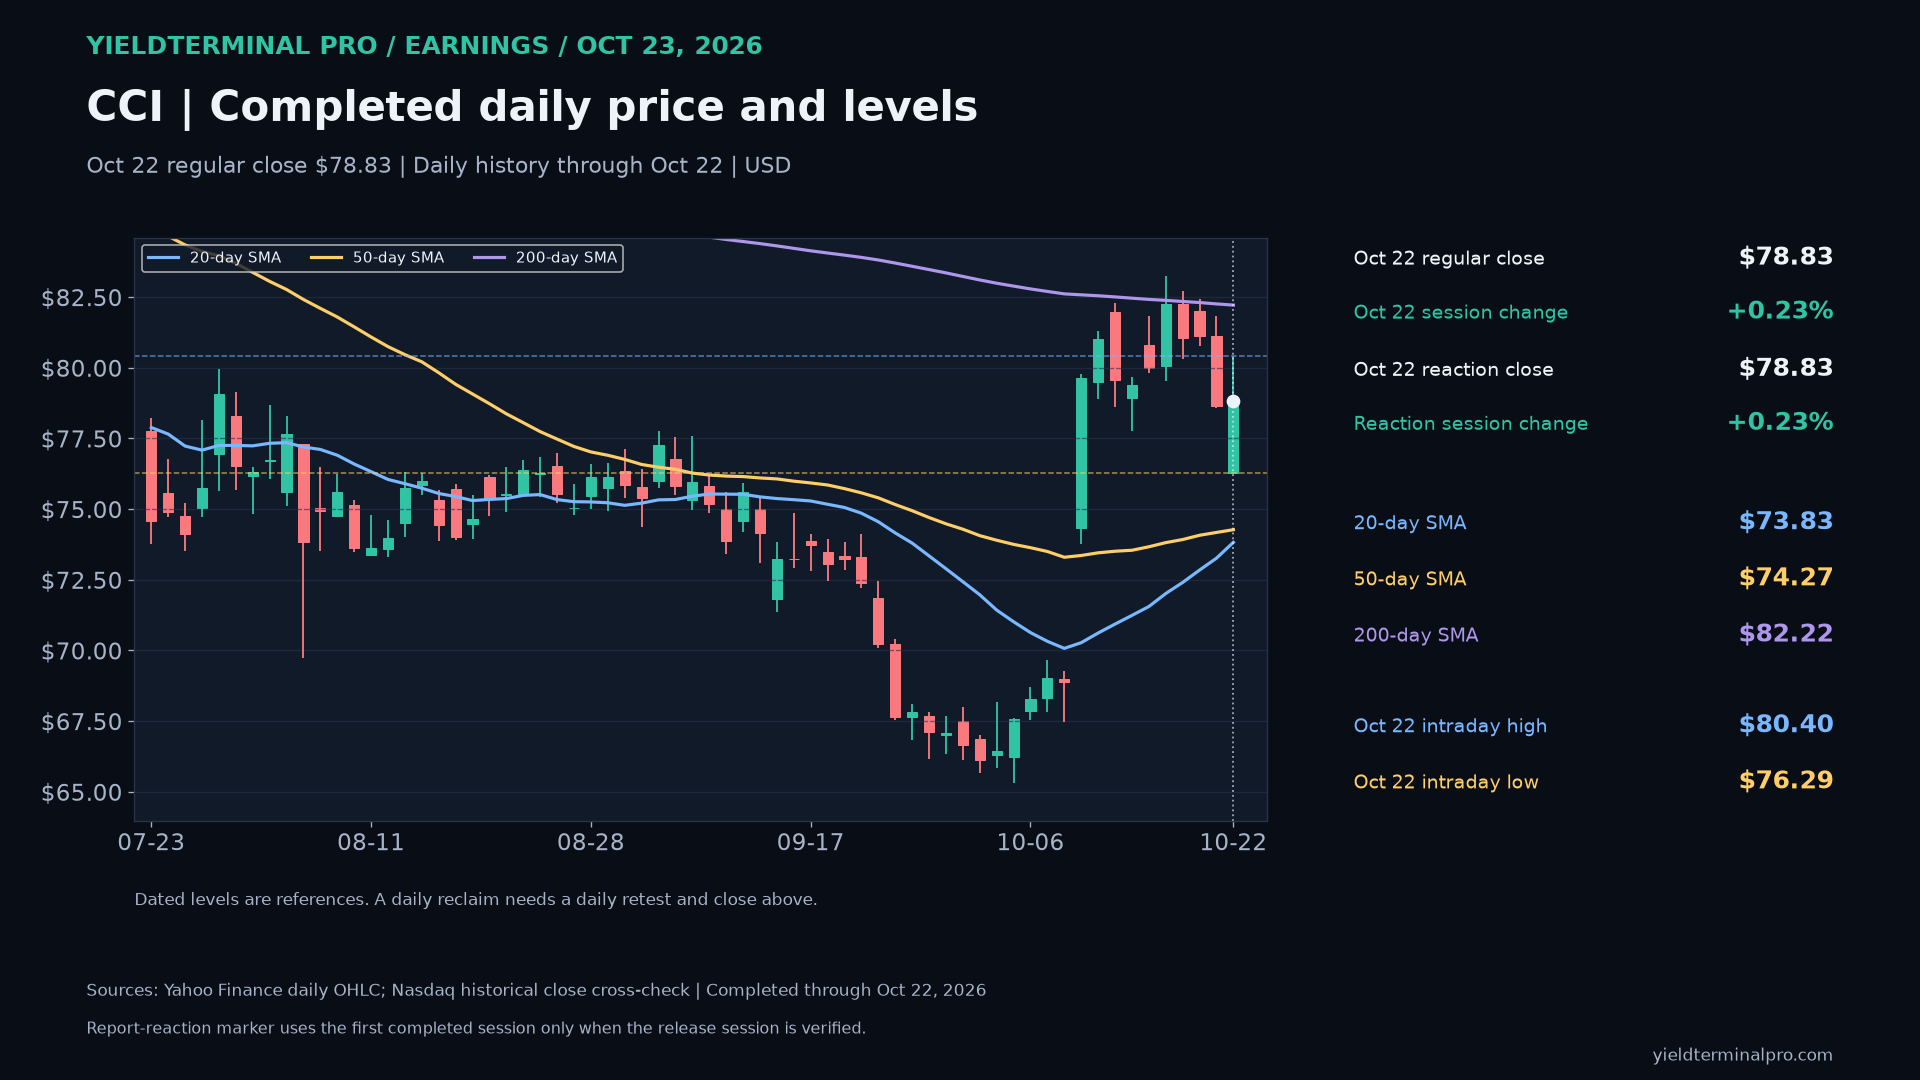
$CCICrown Castle — October 23 earnings review 78.83October 22 completed regular-session closeCCI closed October 22 at $78.83, above its 50-day average ($74.27) and below its 200-day average ($82.22). The October 22 high ($80.40) and low ($76.29) are dated reference levels. This is completed daily history, not an October 23 quote.
- October 22 intraday high
- 80.40
- October 22 intraday low
- 76.29
- 50-day SMA through October 22
- 74.27
- 200-day SMA through October 22
- 82.22
Levels measured over Completed US regular-session daily history through October 22, 2026. Daily averages use completed closes; earnings result and price session are separate dated evidence.. A level measured over a different window can be a different number.
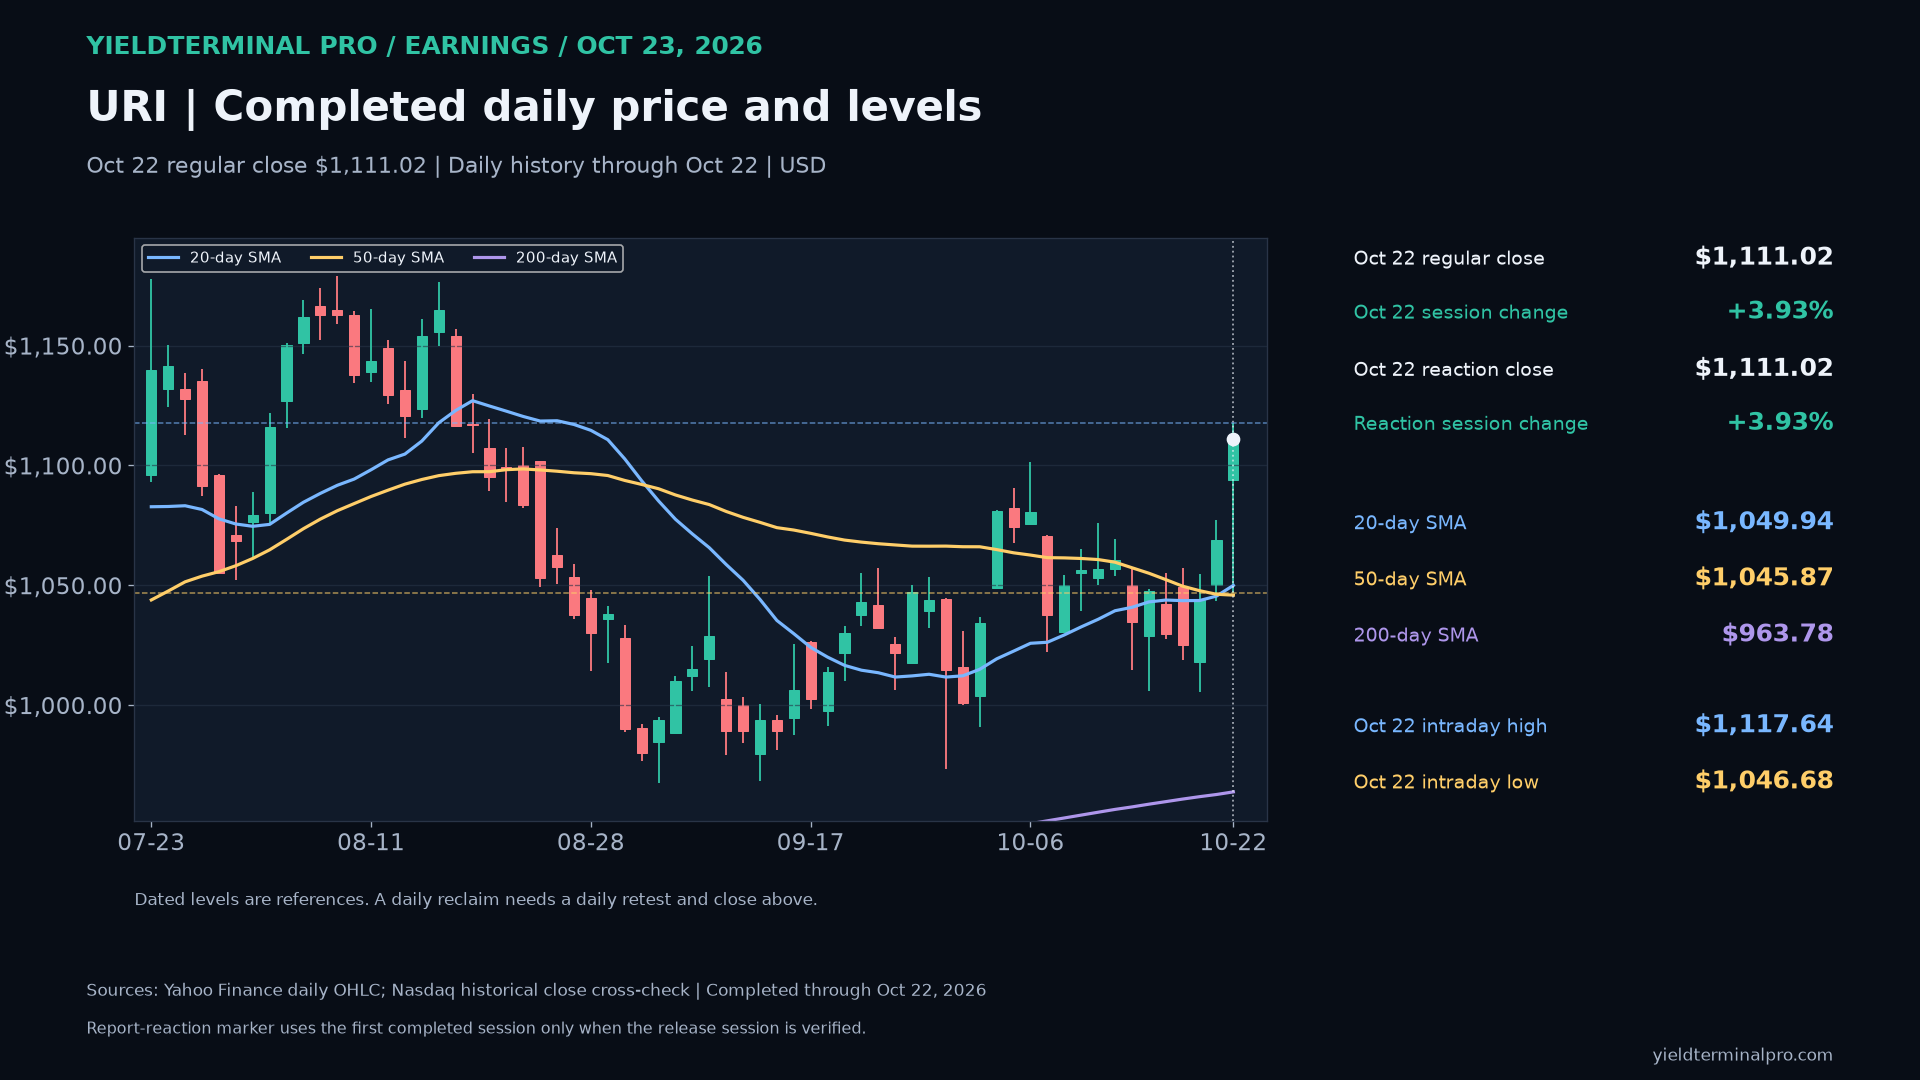
$URIUnited Rentals — October 23 earnings review 1,111.02October 22 completed regular-session closeURI closed October 22 at $1,111.02, above its 50-day average ($1,045.87) and above its 200-day average ($963.78). The October 22 high ($1,117.64) and low ($1,046.68) are dated reference levels. This is completed daily history, not an October 23 quote.
- October 22 intraday high
- 1,117.64
- October 22 intraday low
- 1,046.68
- 50-day SMA through October 22
- 1,045.87
- 200-day SMA through October 22
- 963.78
Levels measured over Completed US regular-session daily history through October 22, 2026. Daily averages use completed closes; earnings result and price session are separate dated evidence.. A level measured over a different window can be a different number.
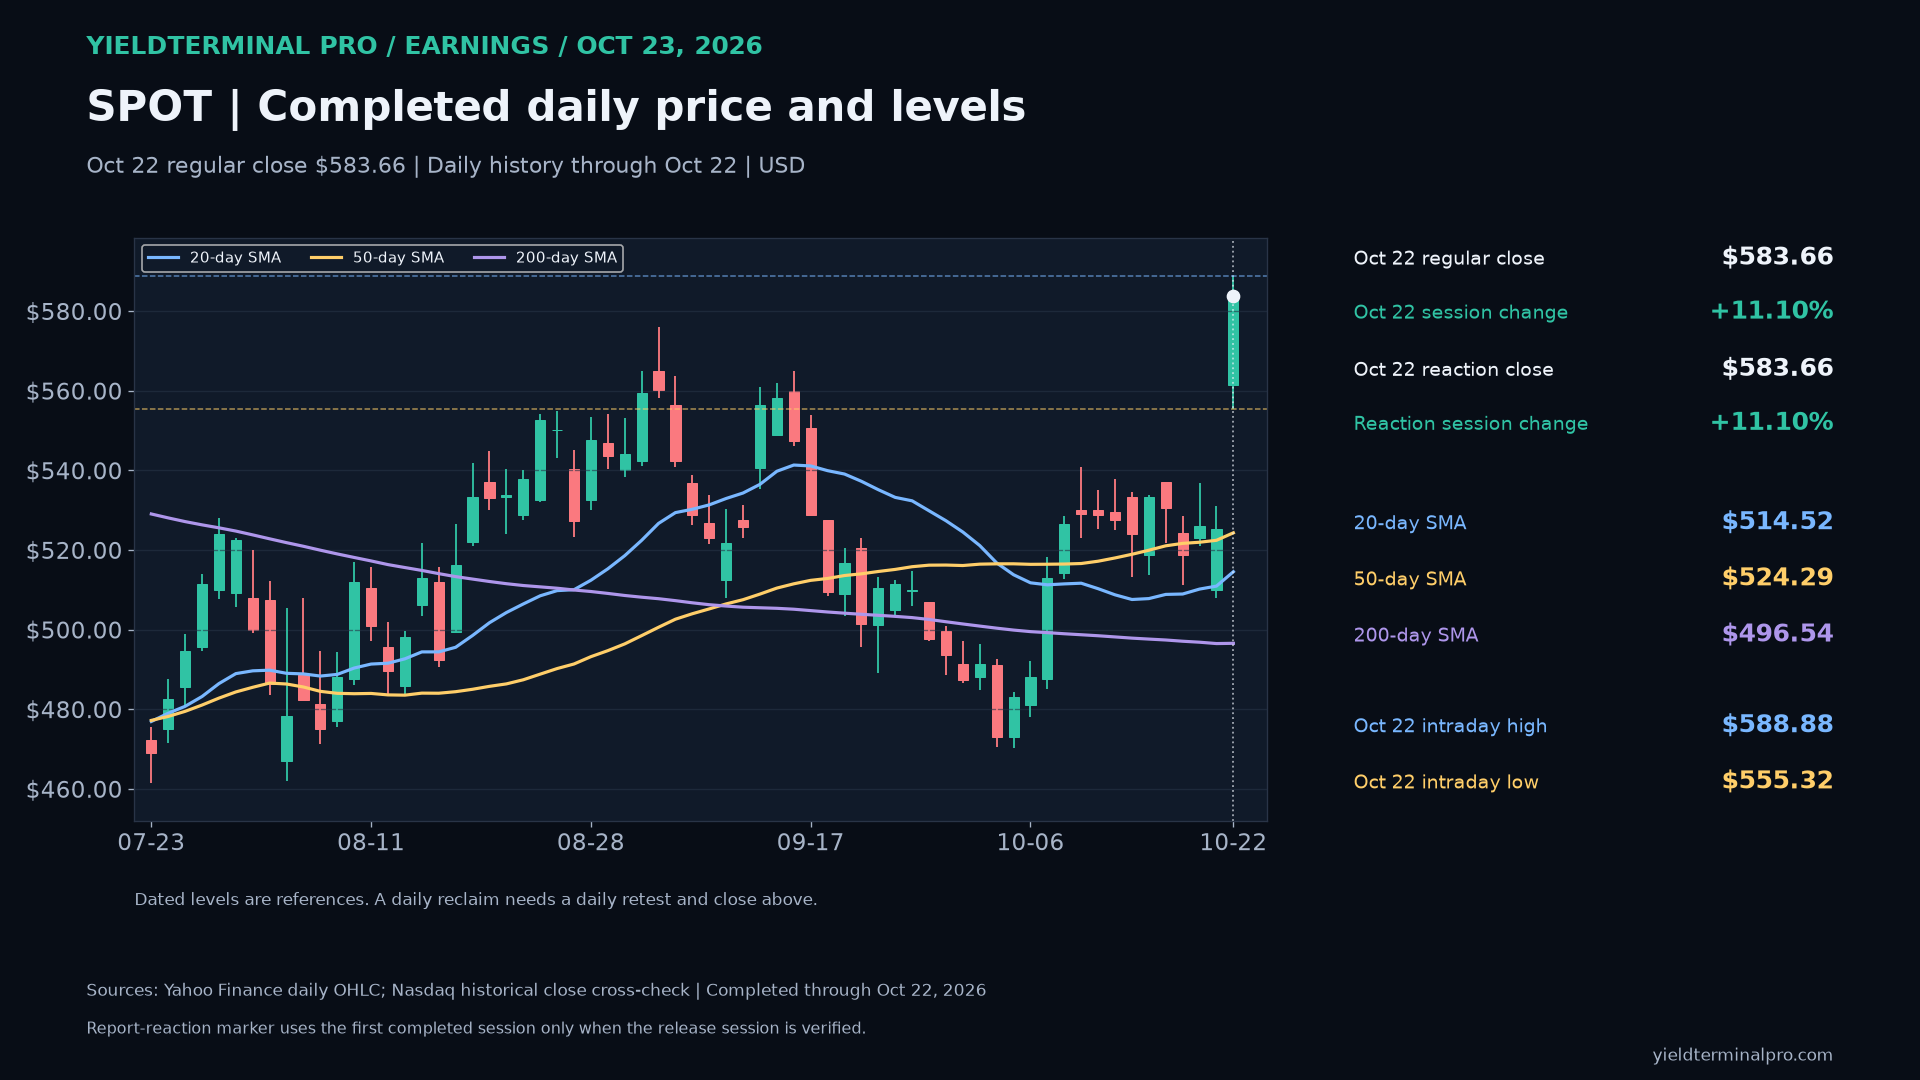
$SPOTSpotify Technology S.A. — October 23 earnings review 583.66October 22 completed regular-session closeSPOT closed October 22 at $583.66, above its 50-day average ($524.29) and above its 200-day average ($496.54). The October 22 high ($588.88) and low ($555.32) are dated reference levels. This is completed daily history, not an October 23 quote.
- October 22 intraday high
- 588.88
- October 22 intraday low
- 555.32
- 50-day SMA through October 22
- 524.29
- 200-day SMA through October 22
- 496.54
Levels measured over Completed US regular-session daily history through October 22, 2026. Daily averages use completed closes; earnings result and price session are separate dated evidence.. A level measured over a different window can be a different number.
$PGThe Procter & Gamble Company — October 23 earnings review 165.59October 22 completed regular-session closePG closed October 22 at $165.59, above its 50-day average ($148.03) and above its 200-day average ($148.40). The October 22 high ($166.85) and low ($161.36) are dated reference levels. This is completed daily history, not an October 23 quote.
- October 22 intraday high
- 166.85
- October 22 intraday low
- 161.36
- 50-day SMA through October 22
- 148.03
- 200-day SMA through October 22
- 148.40
Levels measured over Completed US regular-session daily history through October 22, 2026. Daily averages use completed closes; earnings result and price session are separate dated evidence.. A level measured over a different window can be a different number.
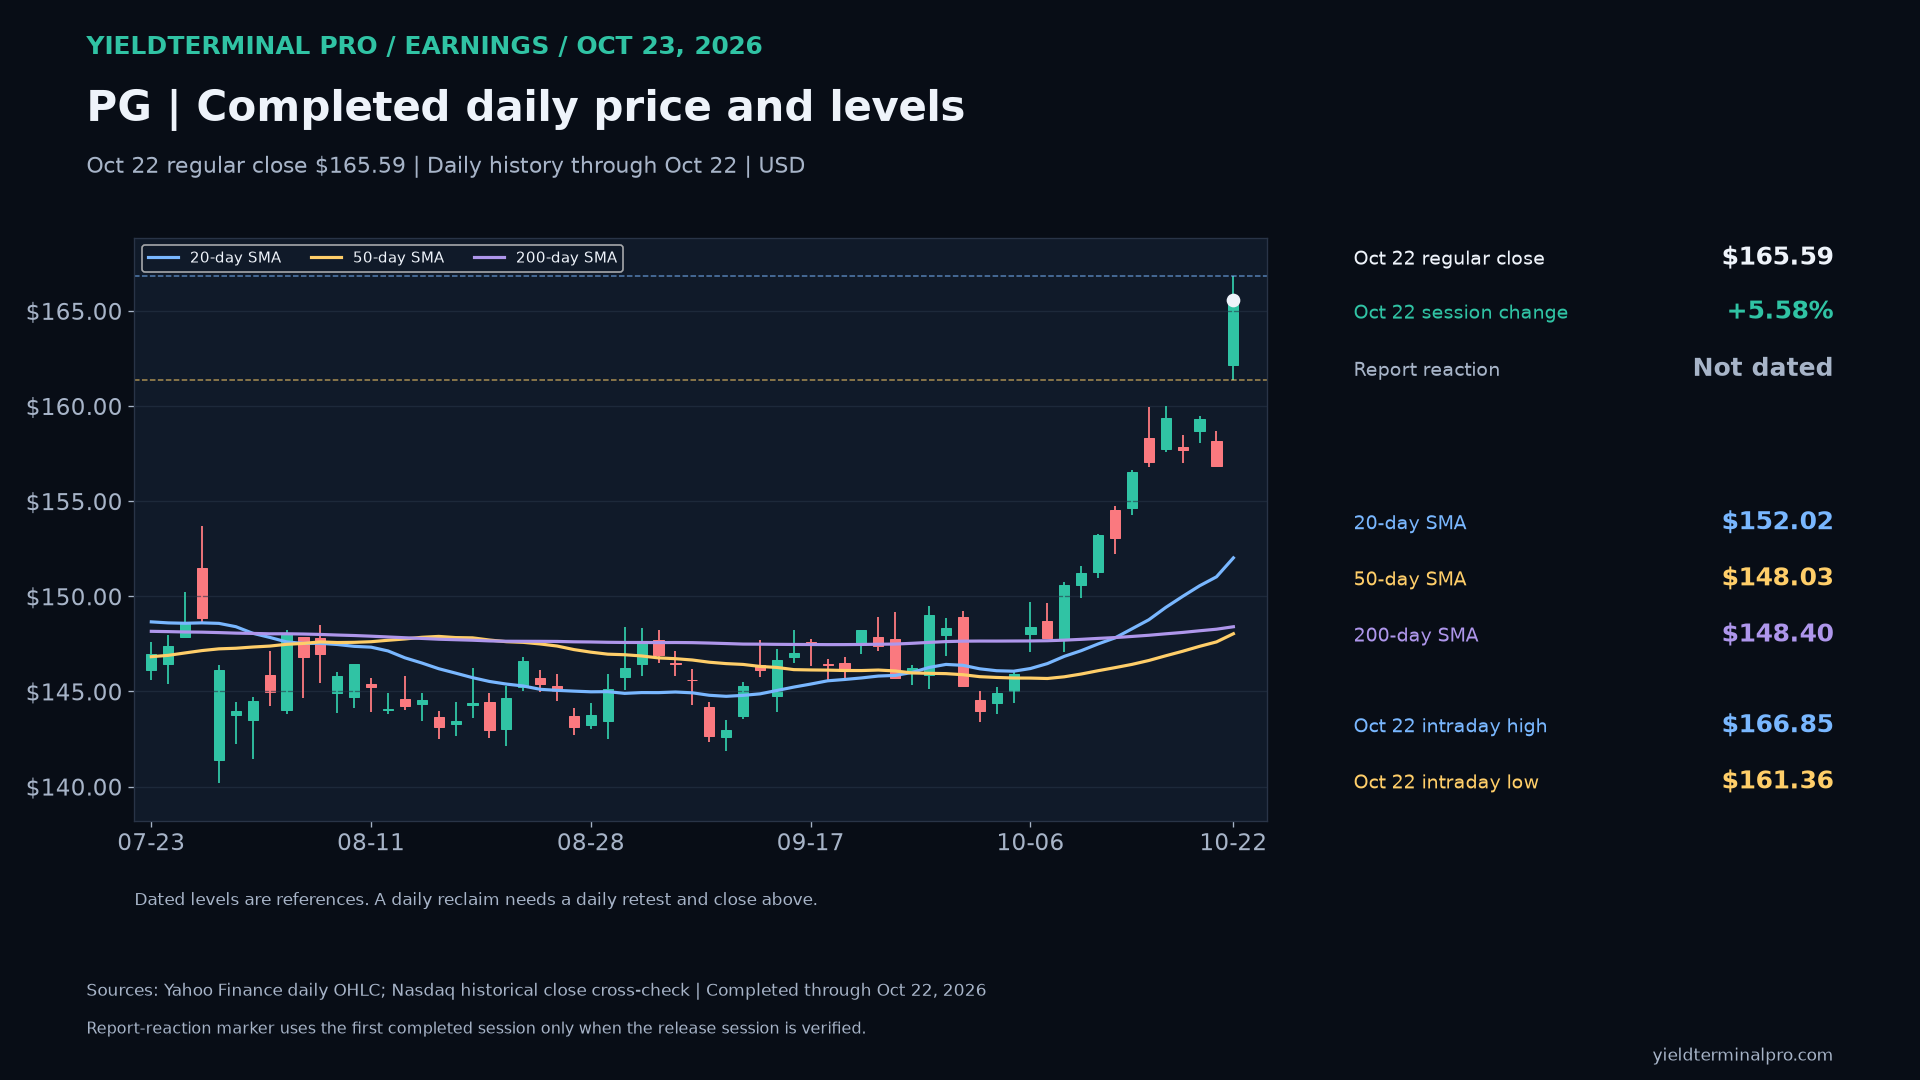
$LMTLockheed Martin Corporation — October 23 earnings review 589.91October 22 completed regular-session closeLMT closed October 22 at $589.91, above its 50-day average ($540.01) and above its 200-day average ($565.75). The October 22 high ($608.00) and low ($577.24) are dated reference levels. This is completed daily history, not an October 23 quote.
- October 22 intraday high
- 608.00
- October 22 intraday low
- 577.24
- 50-day SMA through October 22
- 540.01
- 200-day SMA through October 22
- 565.75
Levels measured over Completed US regular-session daily history through October 22, 2026. Daily averages use completed closes; earnings result and price session are separate dated evidence.. A level measured over a different window can be a different number.
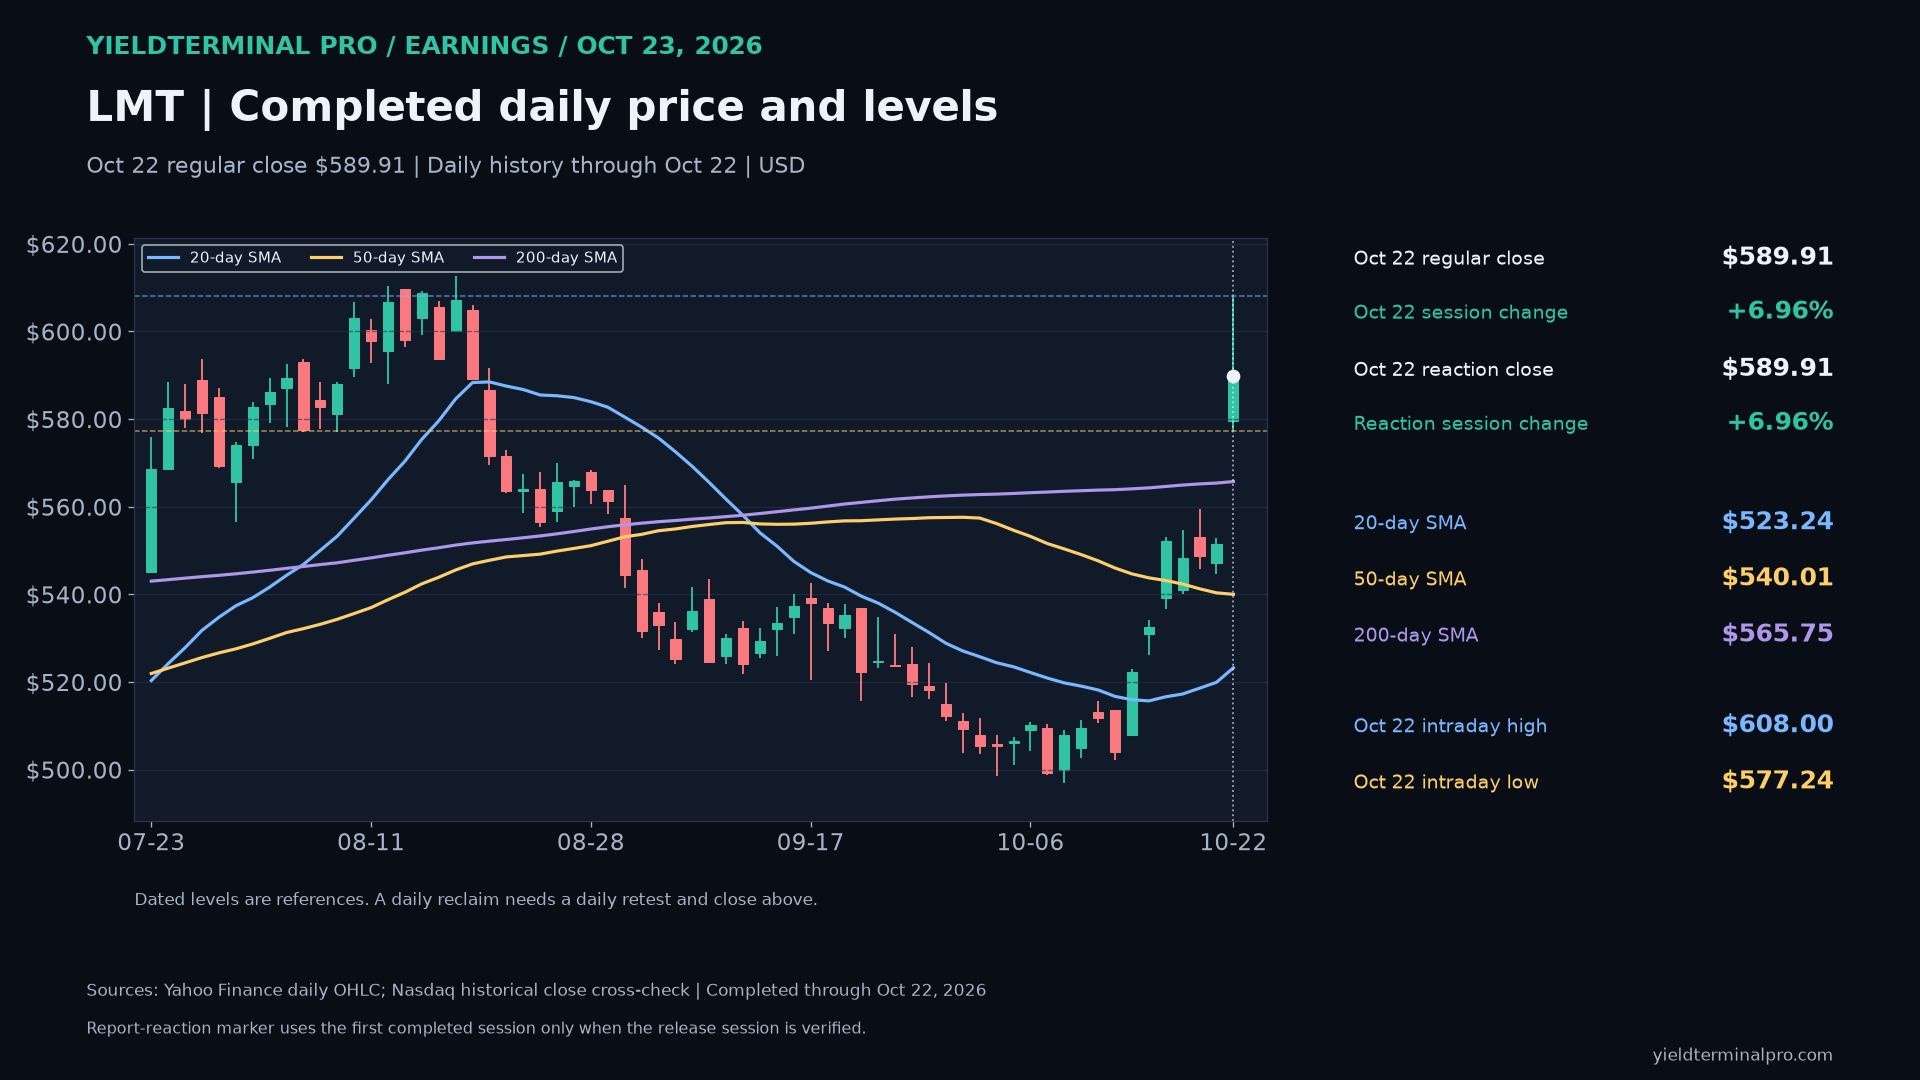
$AALAmerican Airlines — October 23 earnings review 12.60October 22 completed regular-session closeAAL closed October 22 at $12.60, below its 50-day average ($13.17) and below its 200-day average ($13.62). The October 22 high ($12.71) and low ($11.70) are dated reference levels. This is completed daily history, not an October 23 quote.
- October 22 intraday high
- 12.71
- October 22 intraday low
- 11.70
- 50-day SMA through October 22
- 13.17
- 200-day SMA through October 22
- 13.62
Levels measured over Completed US regular-session daily history through October 22, 2026. Daily averages use completed closes; earnings result and price session are separate dated evidence.. A level measured over a different window can be a different number.
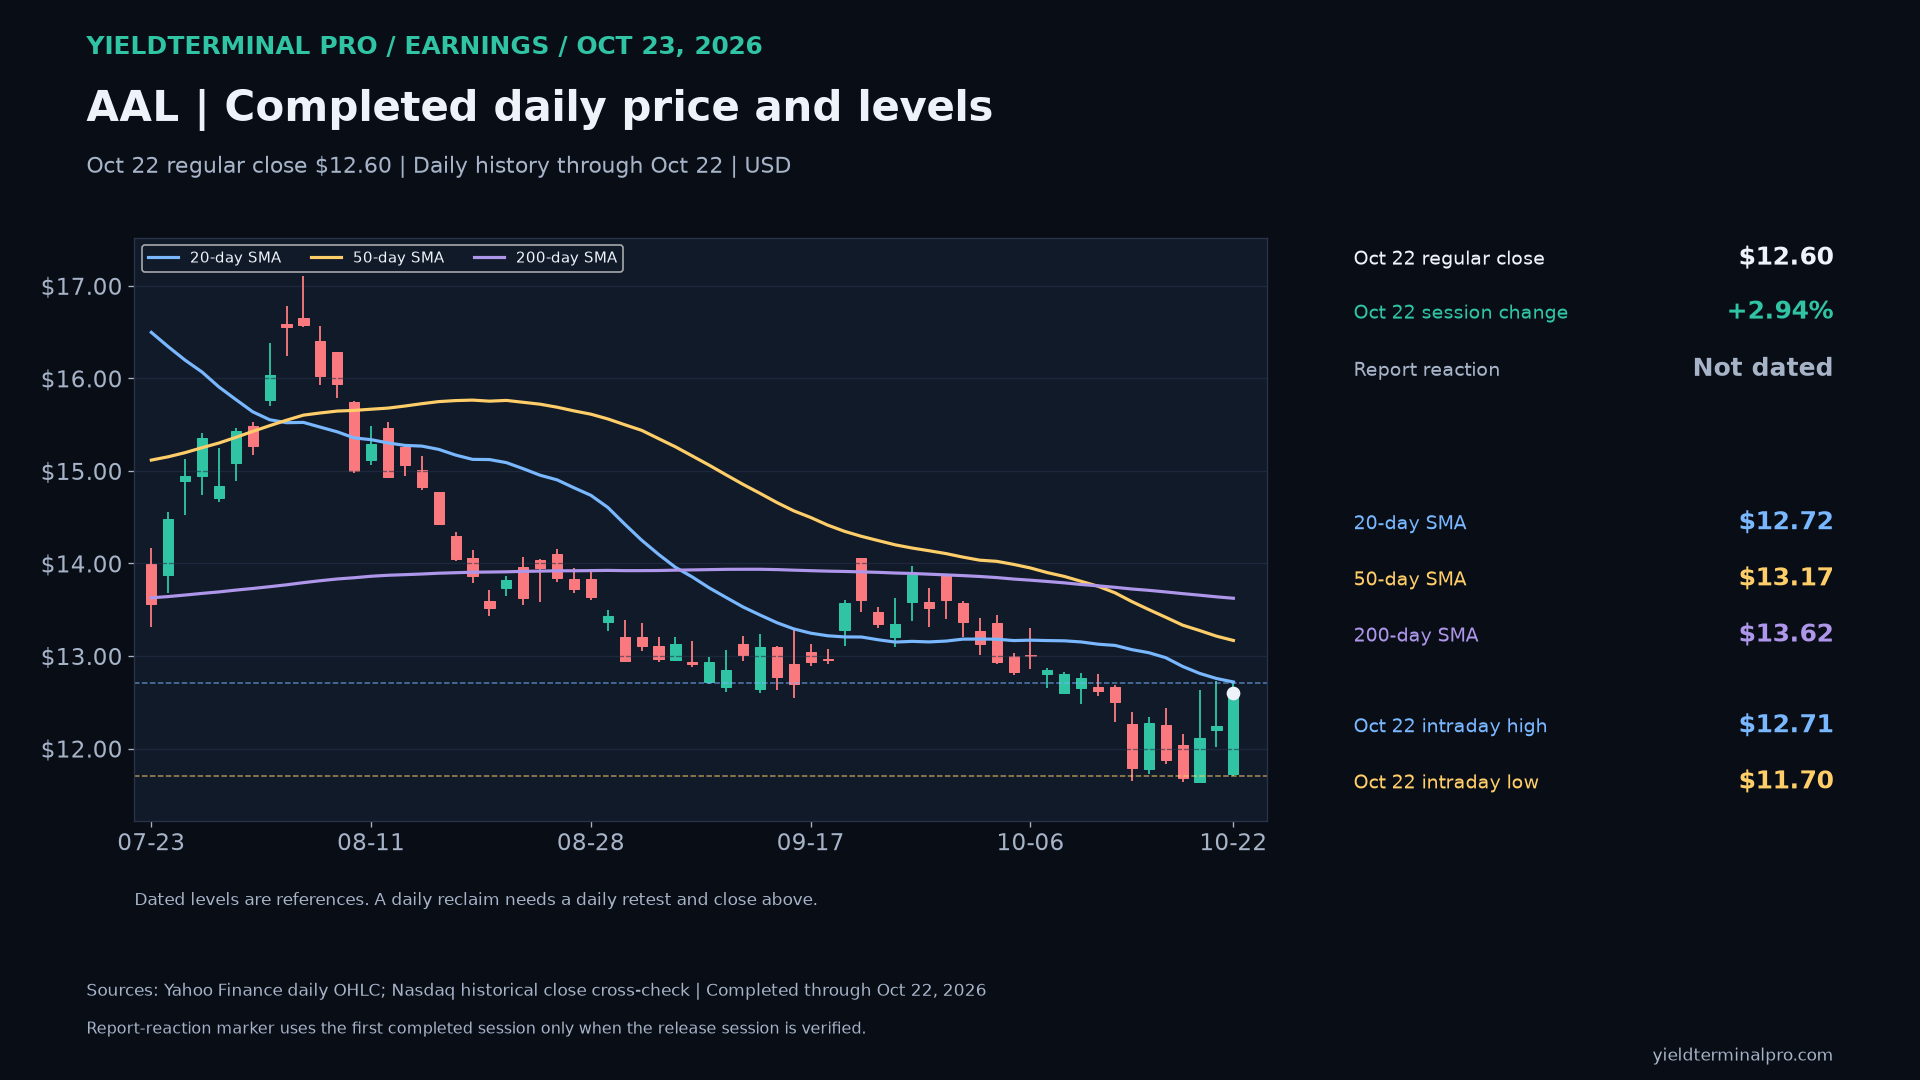
$NOKNokia — October 23 earnings review 7.88October 22 completed regular-session closeNOK closed October 22 at $7.88, below its 50-day average ($10.17) and below its 200-day average ($10.24). The October 22 high ($8.62) and low ($7.78) are dated reference levels. This is completed daily history, not an October 23 quote.
- October 22 intraday high
- 8.62
- October 22 intraday low
- 7.78
- 50-day SMA through October 22
- 10.17
- 200-day SMA through October 22
- 10.24
Levels measured over Completed US regular-session daily history through October 22, 2026. Daily averages use completed closes; earnings result and price session are separate dated evidence.. A level measured over a different window can be a different number.
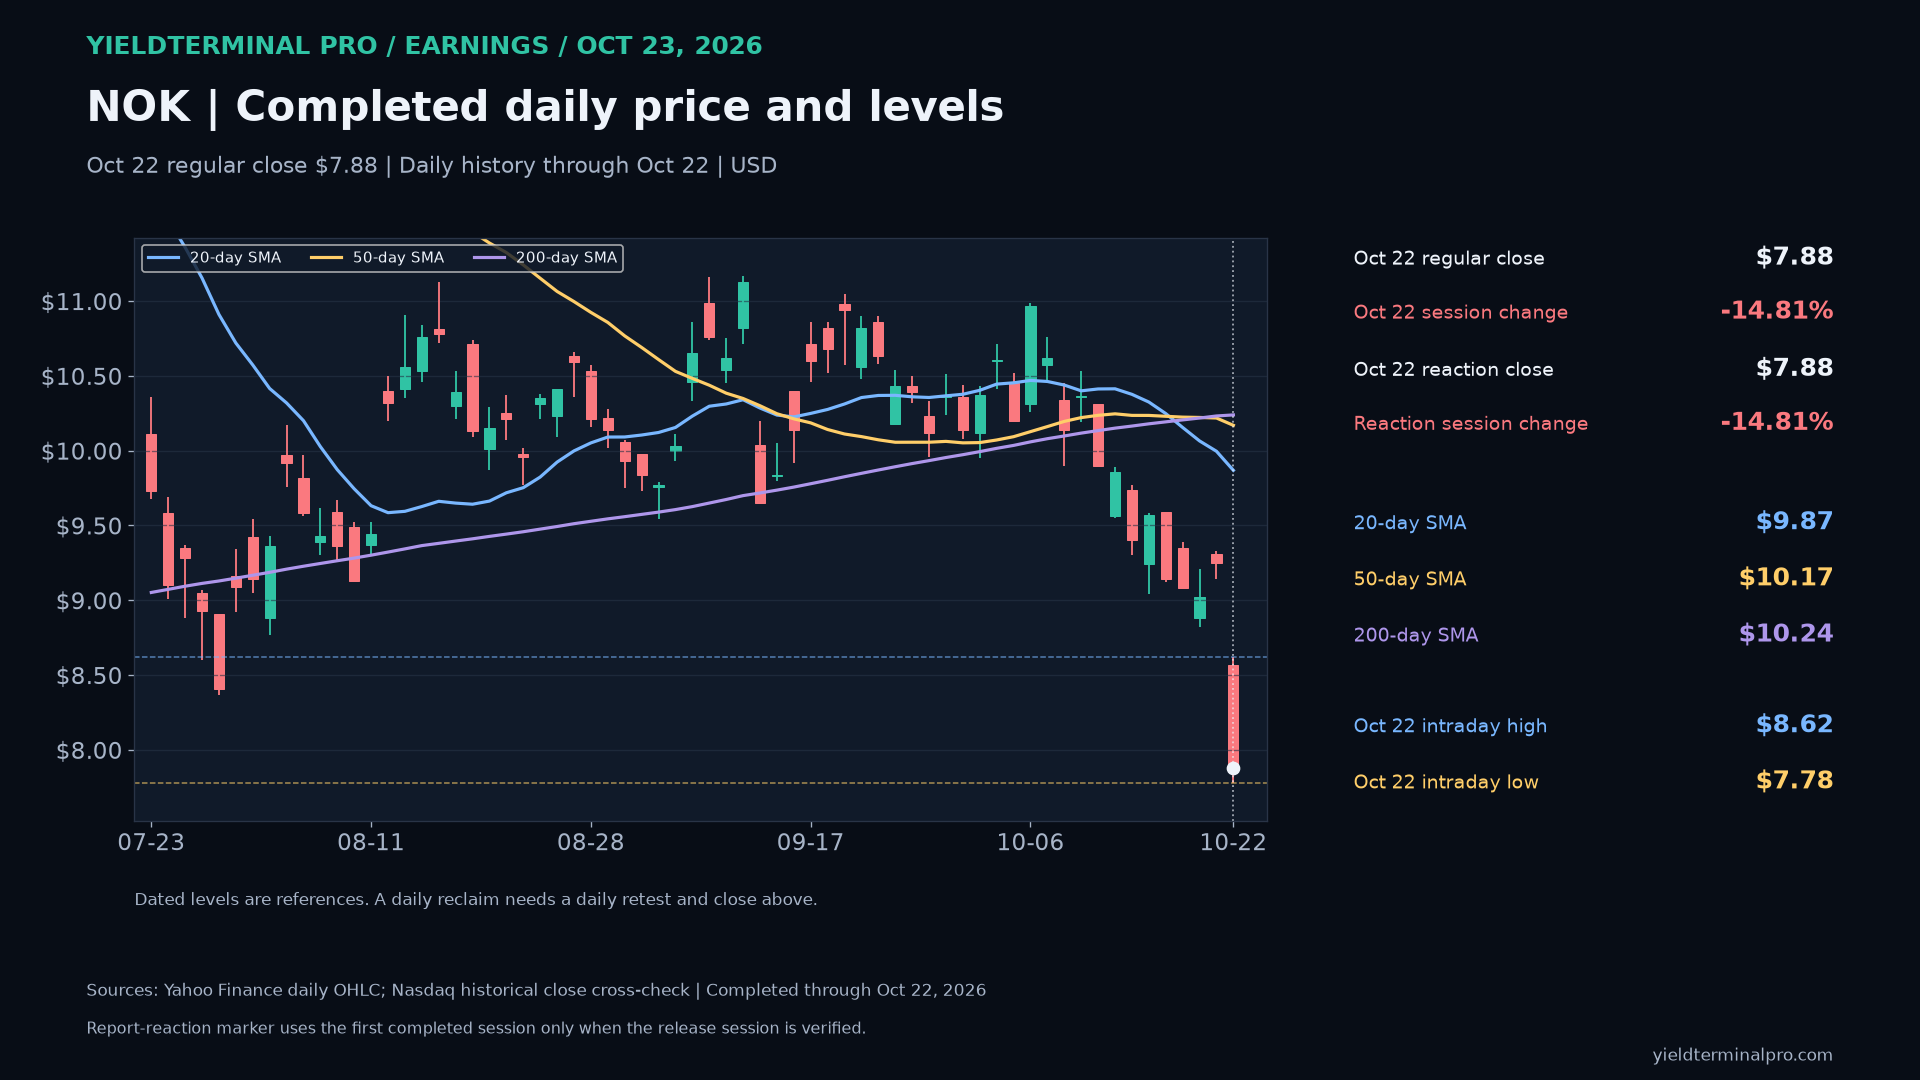
$BXBlackstone — October 23 earnings review 118.75October 22 completed regular-session closeBX closed October 22 at $118.75, below its 50-day average ($125.66) and below its 200-day average ($125.28). The October 22 high ($118.93) and low ($105.50) are dated reference levels. This is completed daily history, not an October 23 quote.
- October 22 intraday high
- 118.93
- October 22 intraday low
- 105.50
- 50-day SMA through October 22
- 125.66
- 200-day SMA through October 22
- 125.28
Levels measured over Completed US regular-session daily history through October 22, 2026. Daily averages use completed closes; earnings result and price session are separate dated evidence.. A level measured over a different window can be a different number.
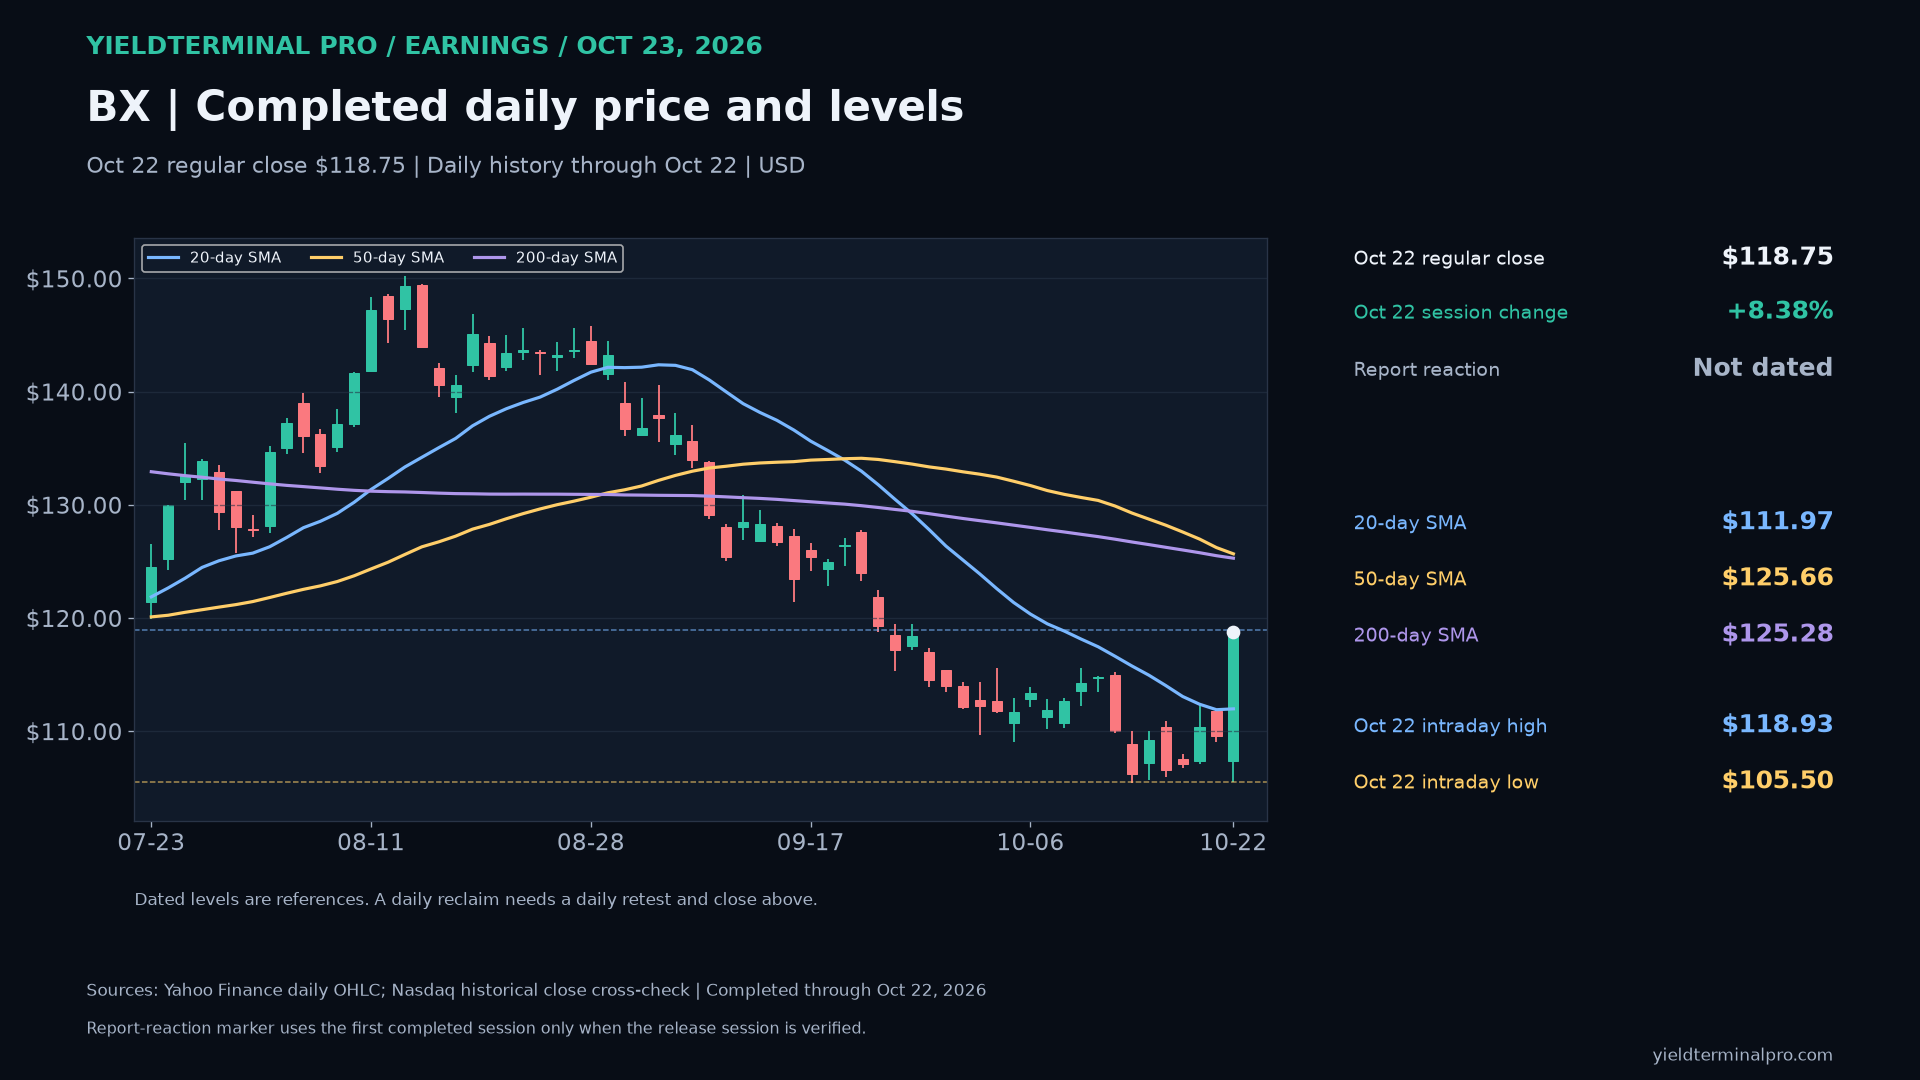
$VLOValero Energy — October 23 earnings review 426.28October 22 completed regular-session closeVLO closed October 22 at $426.28, above its 50-day average ($390.88) and above its 200-day average ($279.22). The October 22 high ($439.55) and low ($416.41) are dated reference levels. This is completed daily history, not an October 23 quote.
- October 22 intraday high
- 439.55
- October 22 intraday low
- 416.41
- 50-day SMA through October 22
- 390.88
- 200-day SMA through October 22
- 279.22
Levels measured over Completed US regular-session daily history through October 22, 2026. Daily averages use completed closes; earnings result and price session are separate dated evidence.. A level measured over a different window can be a different number.
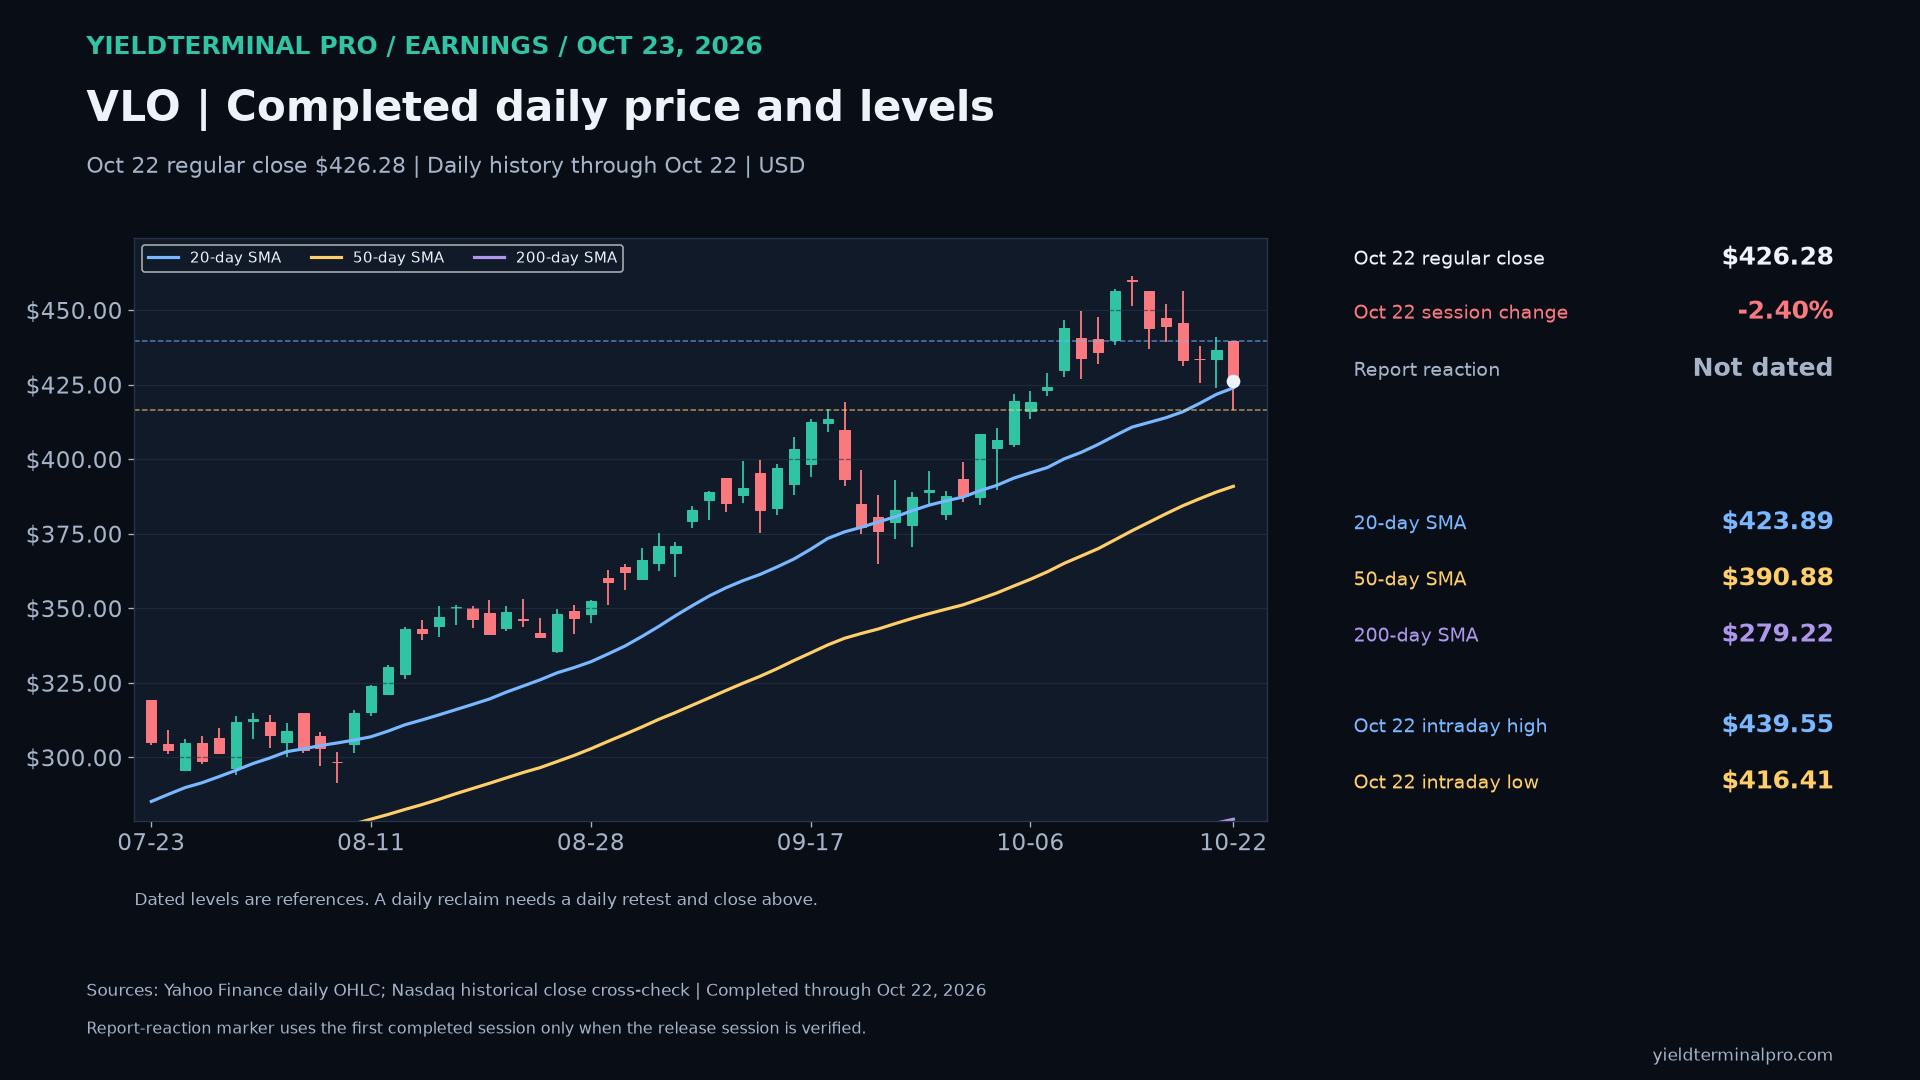
$HBANHuntington Bancshares — October 23 earnings review 15.66October 22 completed regular-session closeHBAN closed October 22 at $15.66, below its 50-day average ($16.18) and below its 200-day average ($16.76). The October 22 high ($15.89) and low ($15.45) are dated reference levels. This is completed daily history, not an October 23 quote.
- October 22 intraday high
- 15.89
- October 22 intraday low
- 15.45
- 50-day SMA through October 22
- 16.18
- 200-day SMA through October 22
- 16.76
Levels measured over Completed US regular-session daily history through October 22, 2026. Daily averages use completed closes; earnings result and price session are separate dated evidence.. A level measured over a different window can be a different number.
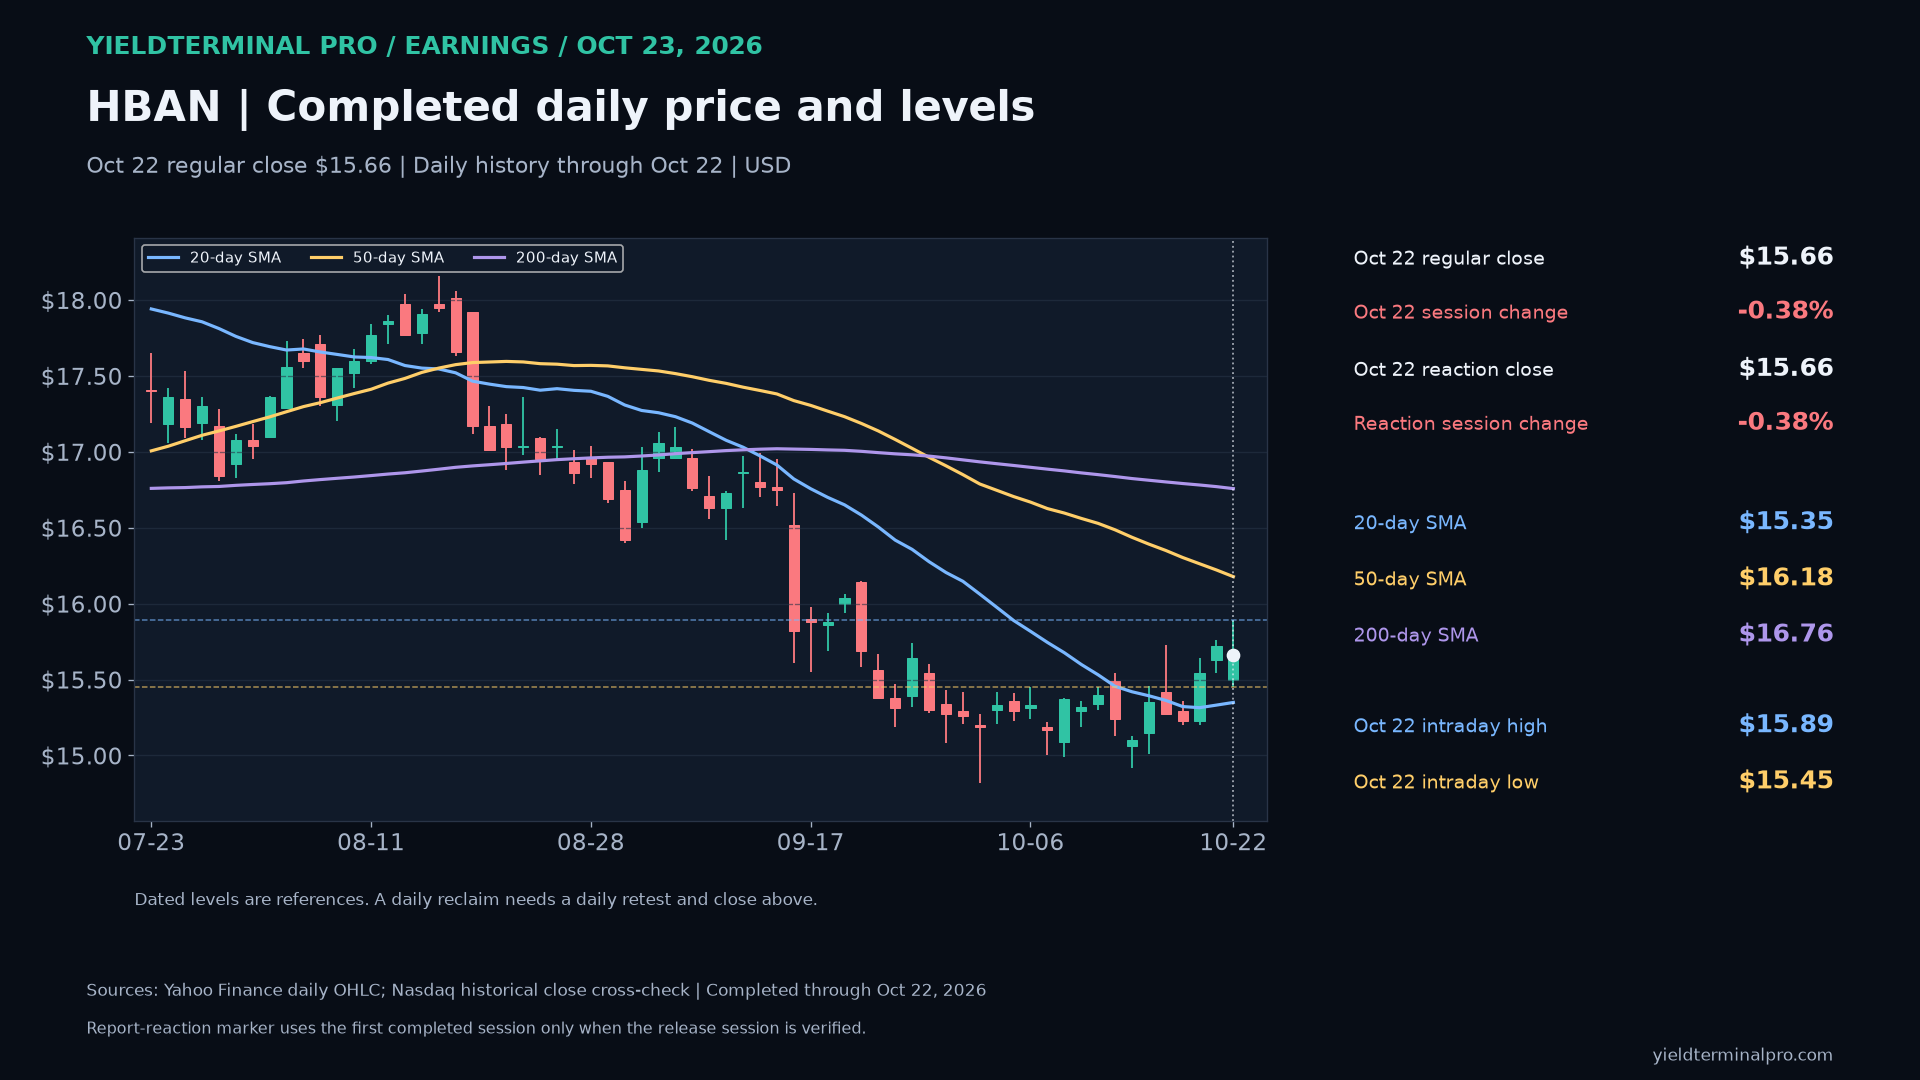
$HONHoneywell Technologies — October 23 earnings review 218.31October 22 completed regular-session closeHON closed October 22 at $218.31, above its 50-day average ($212.56) and below its 200-day average ($230.67). The October 22 high ($218.55) and low ($205.20) are dated reference levels. This is completed daily history, not an October 23 quote.
- October 22 intraday high
- 218.55
- October 22 intraday low
- 205.20
- 50-day SMA through October 22
- 212.56
- 200-day SMA through October 22
- 230.67
Levels measured over Completed US regular-session daily history through October 22, 2026. Daily averages use completed closes; earnings result and price session are separate dated evidence.. A level measured over a different window can be a different number.
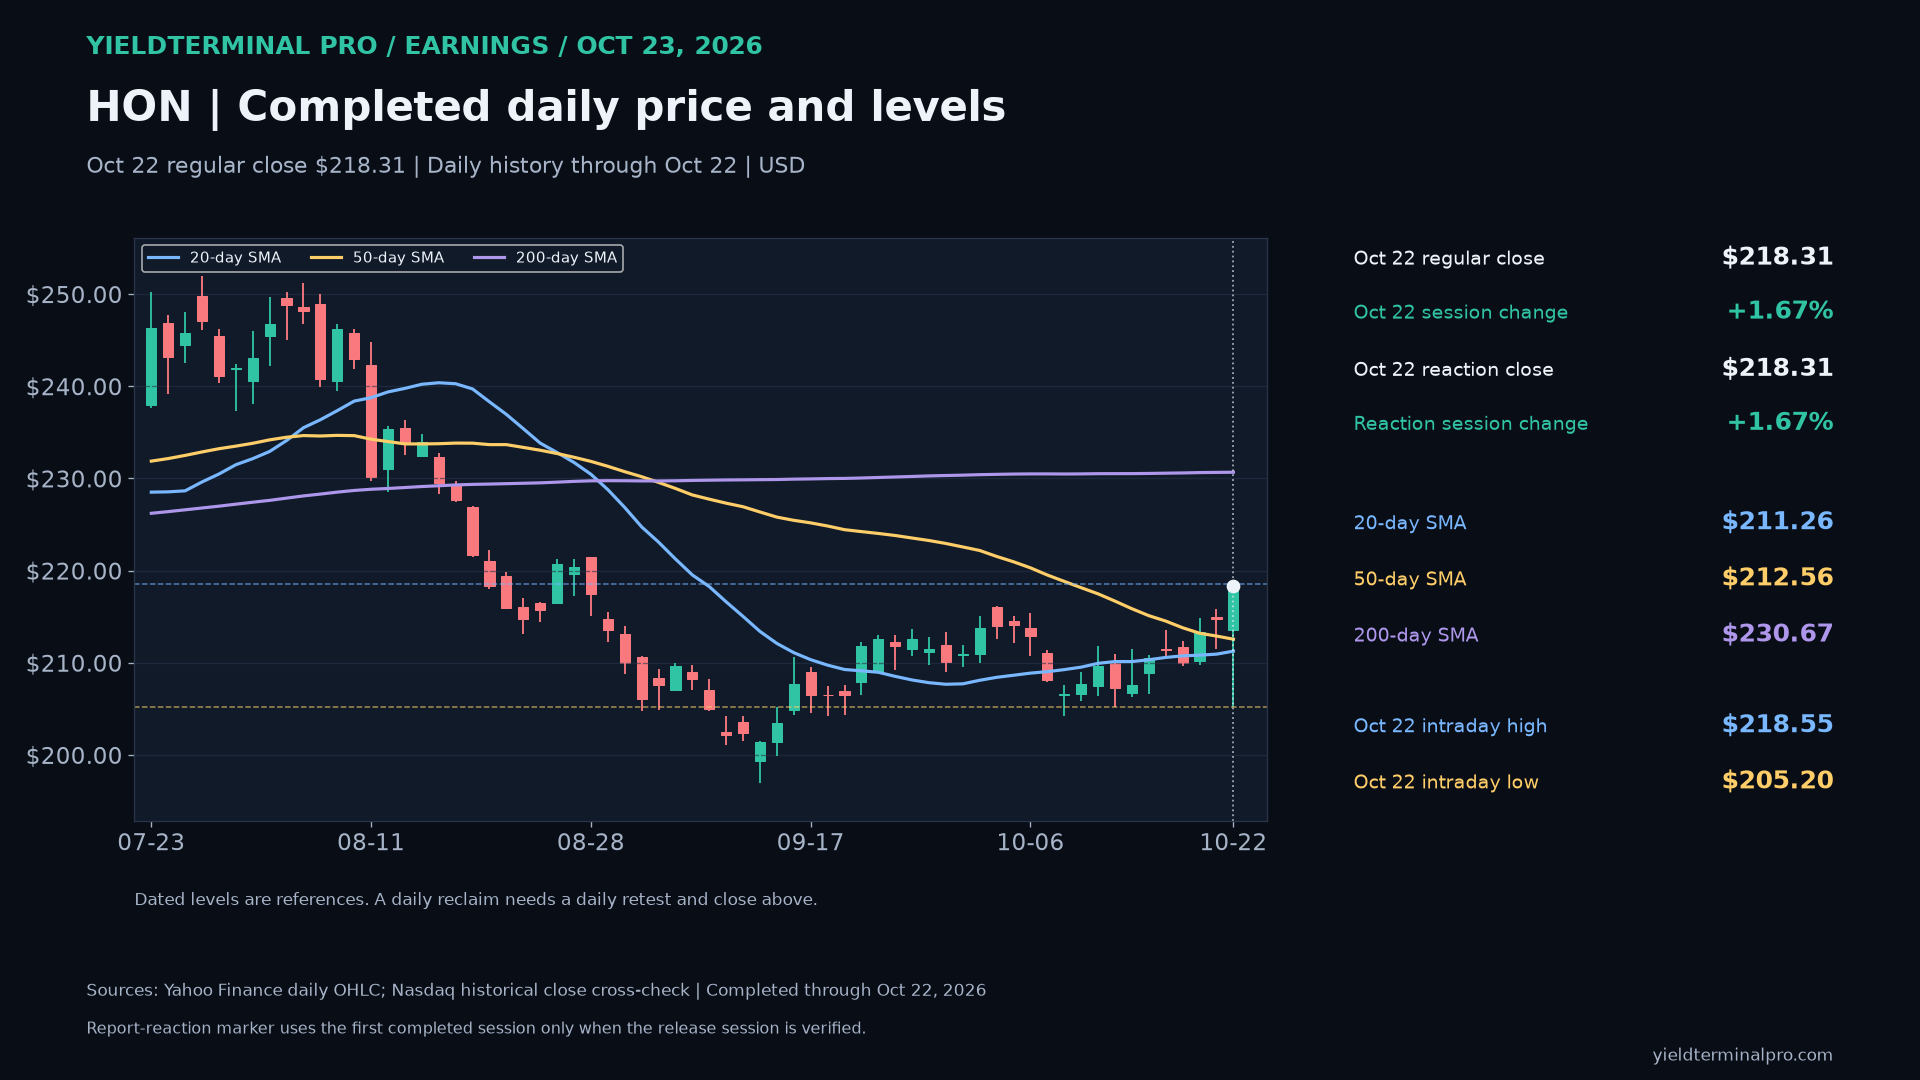
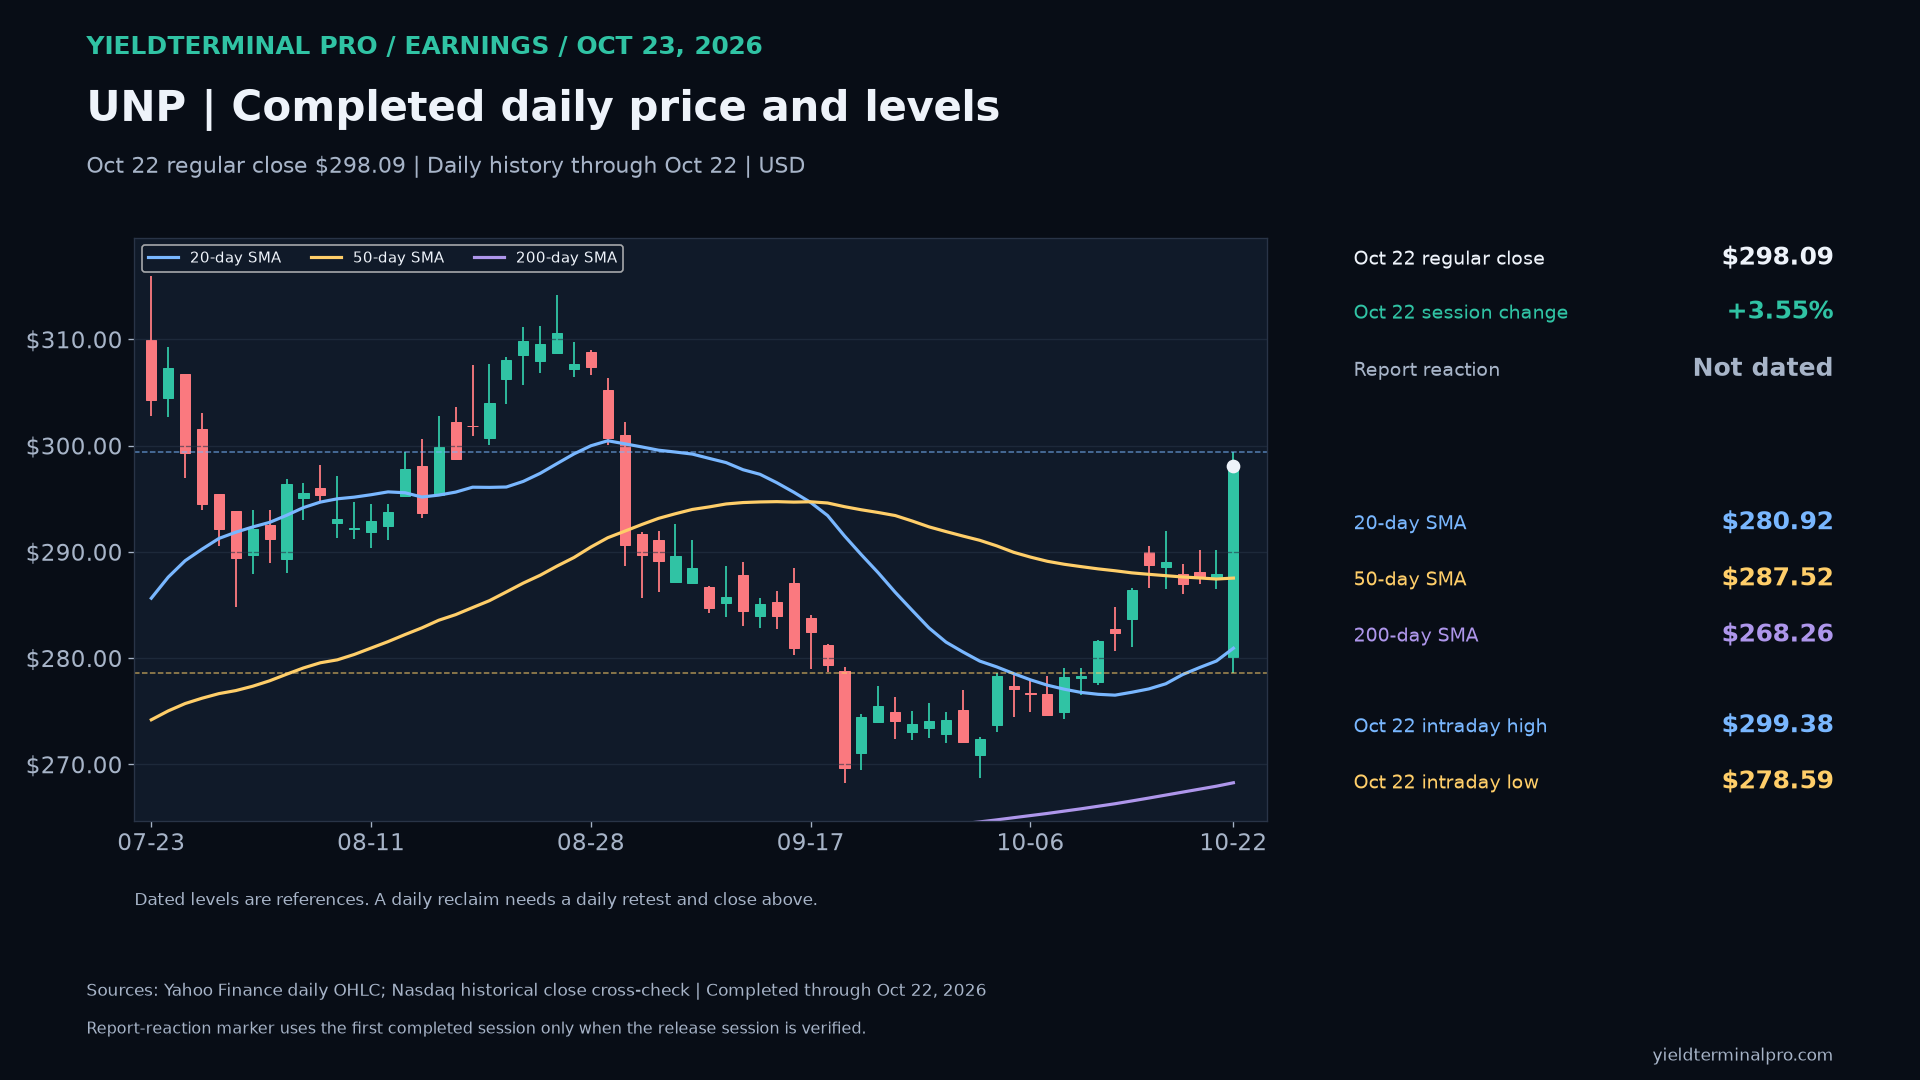
$UNPUnion Pacific Corporation — October 23 earnings review 298.09October 22 completed regular-session closeUNP closed October 22 at $298.09, above its 50-day average ($287.52) and above its 200-day average ($268.26). The Oct 22 high ($299.38) and low ($278.59) are dated reference levels. This is completed daily history.
- October 22 intraday high
- 299.38
- October 22 intraday low
- 278.59
- 50-day SMA through October 22
- 287.52
- 200-day SMA through October 22
- 268.26
Levels measured over Completed US regular-session daily history through October 22, 2026. Daily averages use completed closes; earnings result and price session are separate dated evidence.. A level measured over a different window can be a different number.
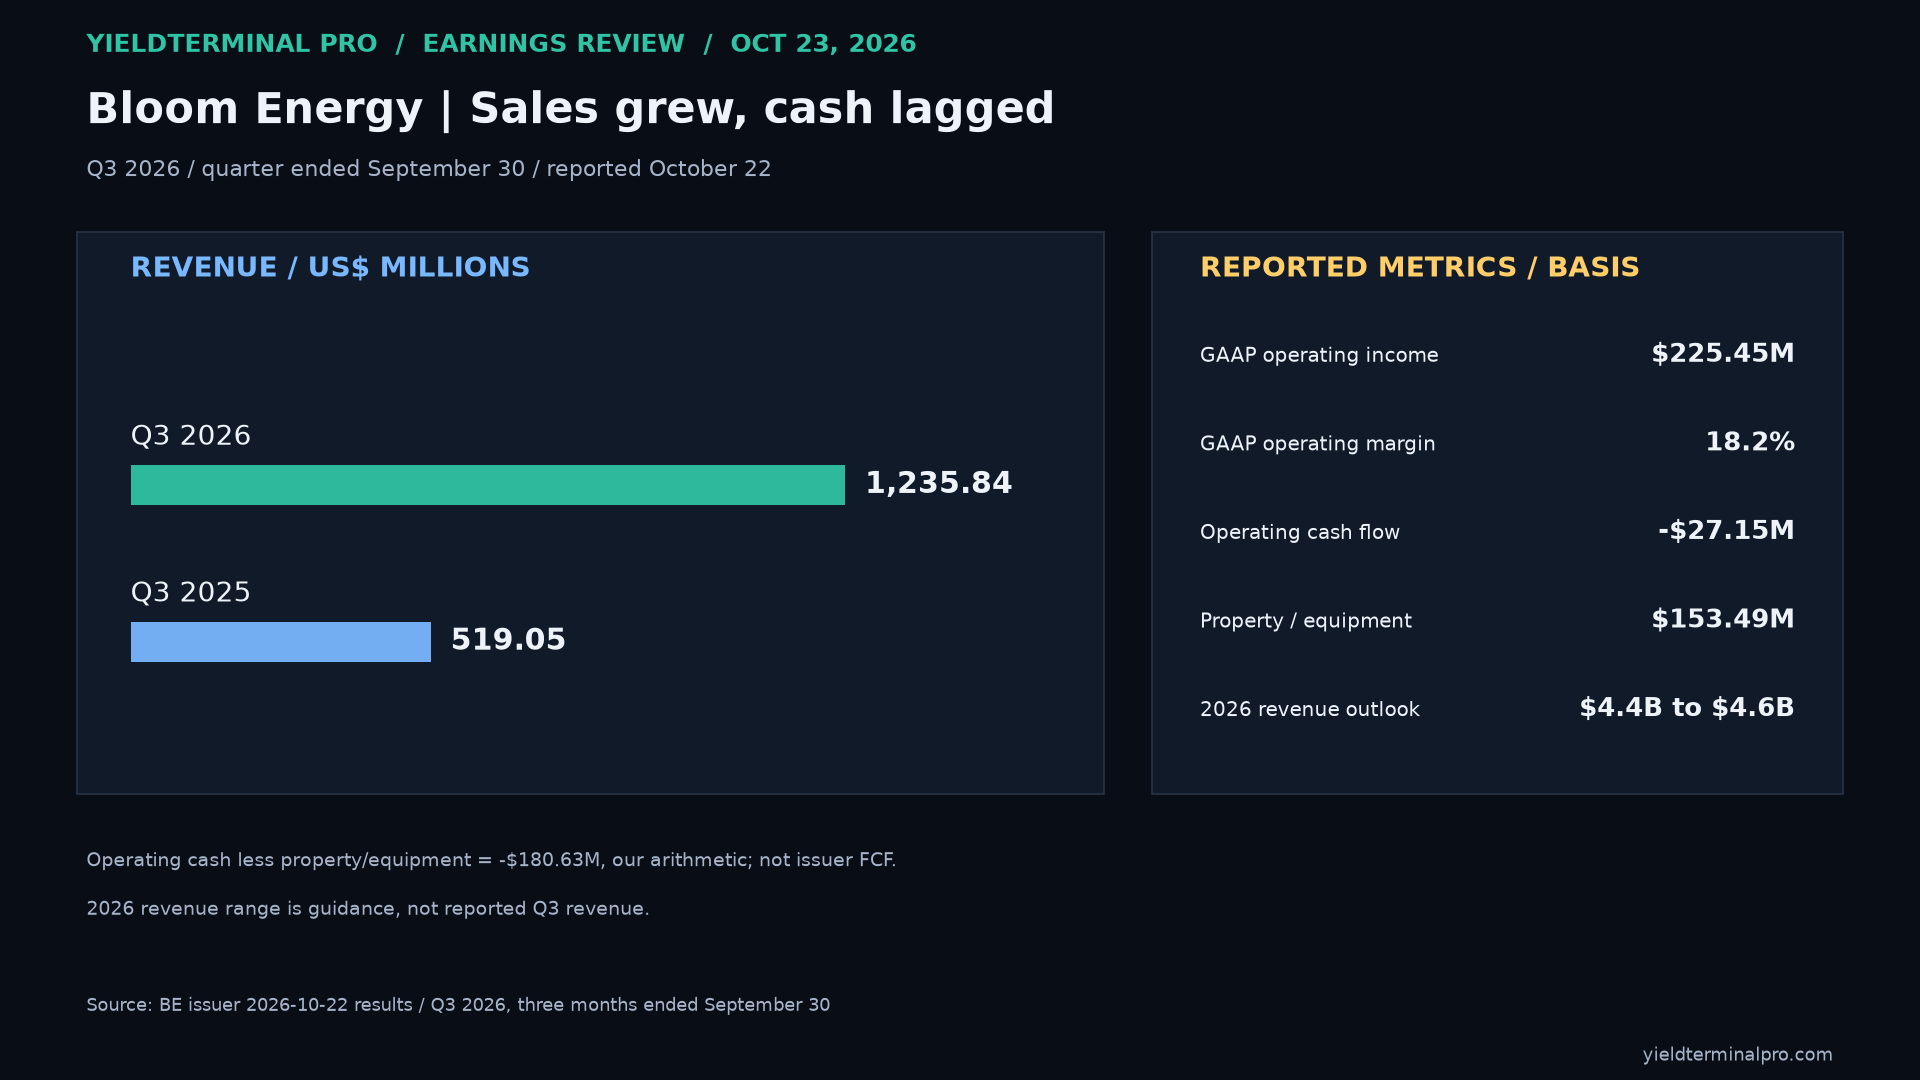
$BEBloom Energy — Q3 2026, three months ended September 30 issuer results Q3 revenue rose to $1.236 billion from $0.519 billion; operating cash flow was negative $27.15 million.
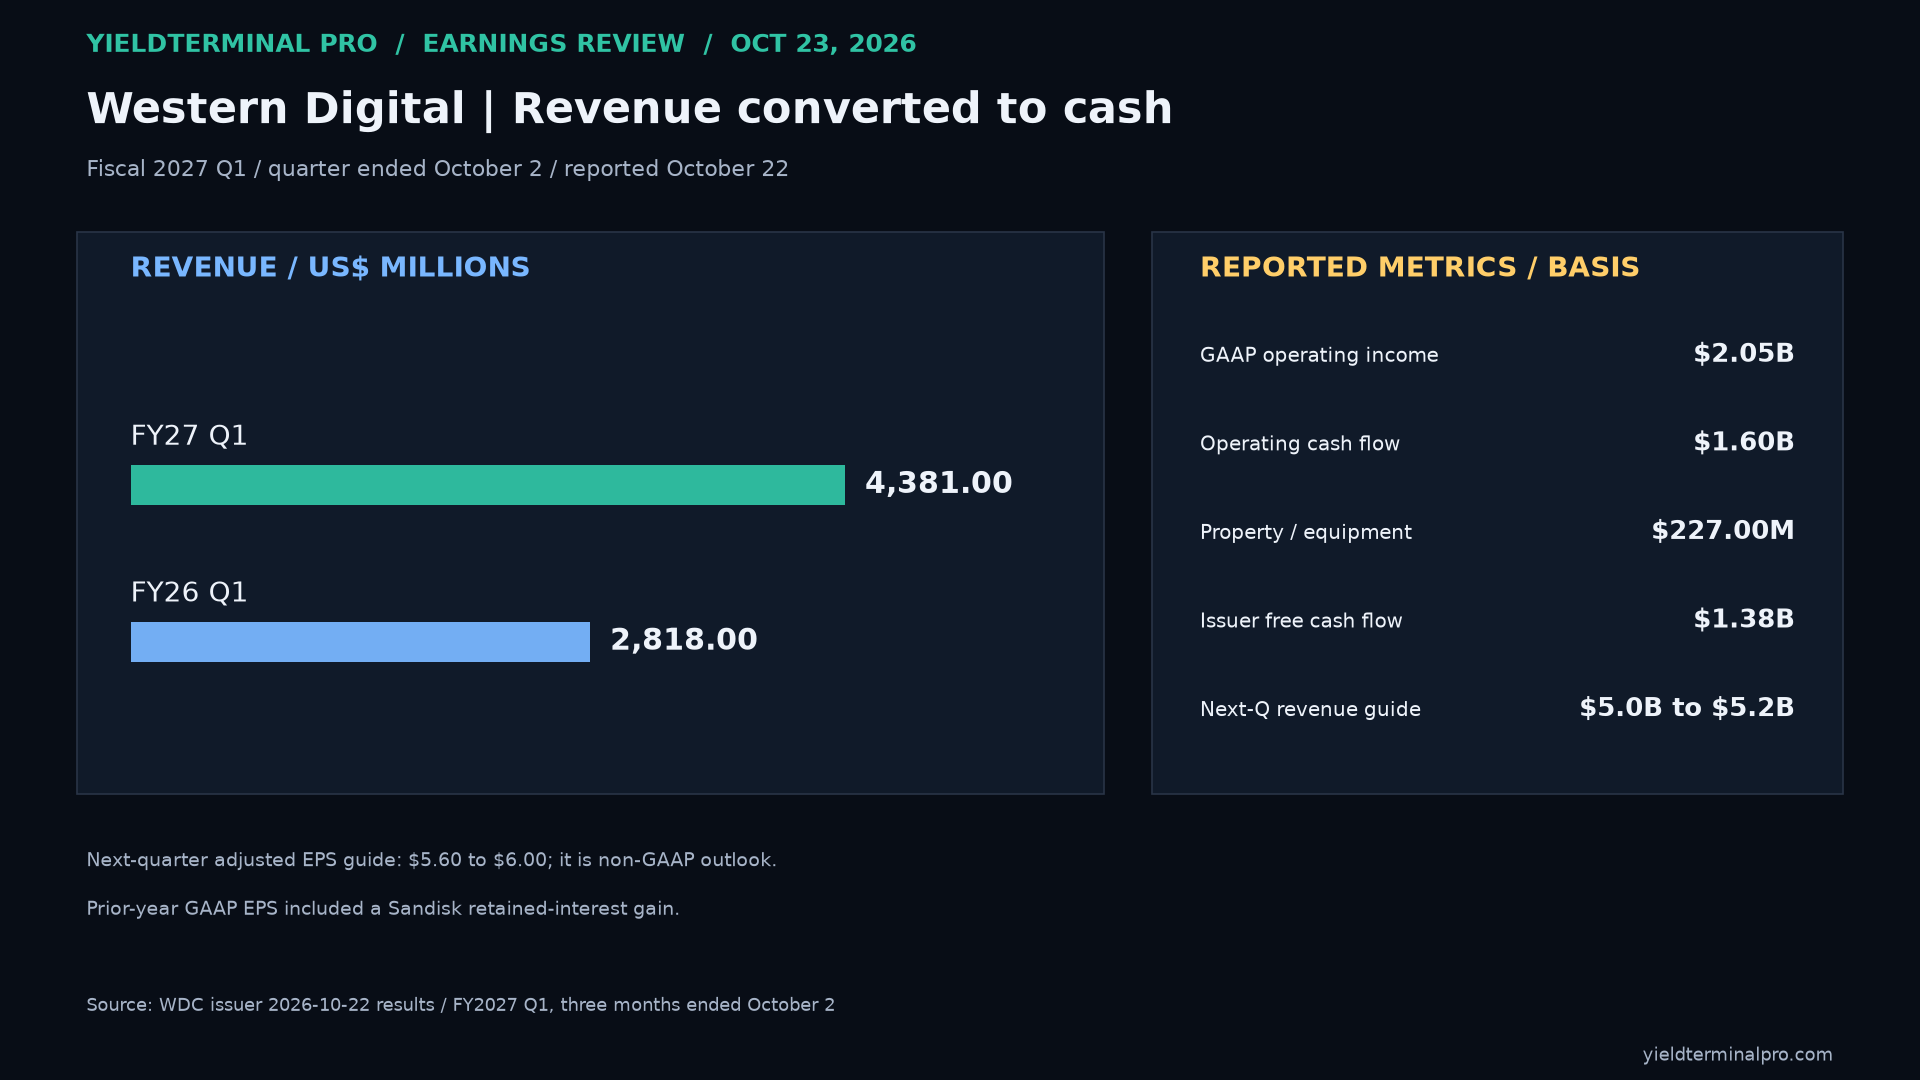
$WDCWestern Digital Corporation — FY2027 Q1, three months ended October 2 issuer results Fiscal 2027 Q1 revenue rose to $4.381 billion from $2.818 billion; issuer-defined free cash flow was $1.377 billion.
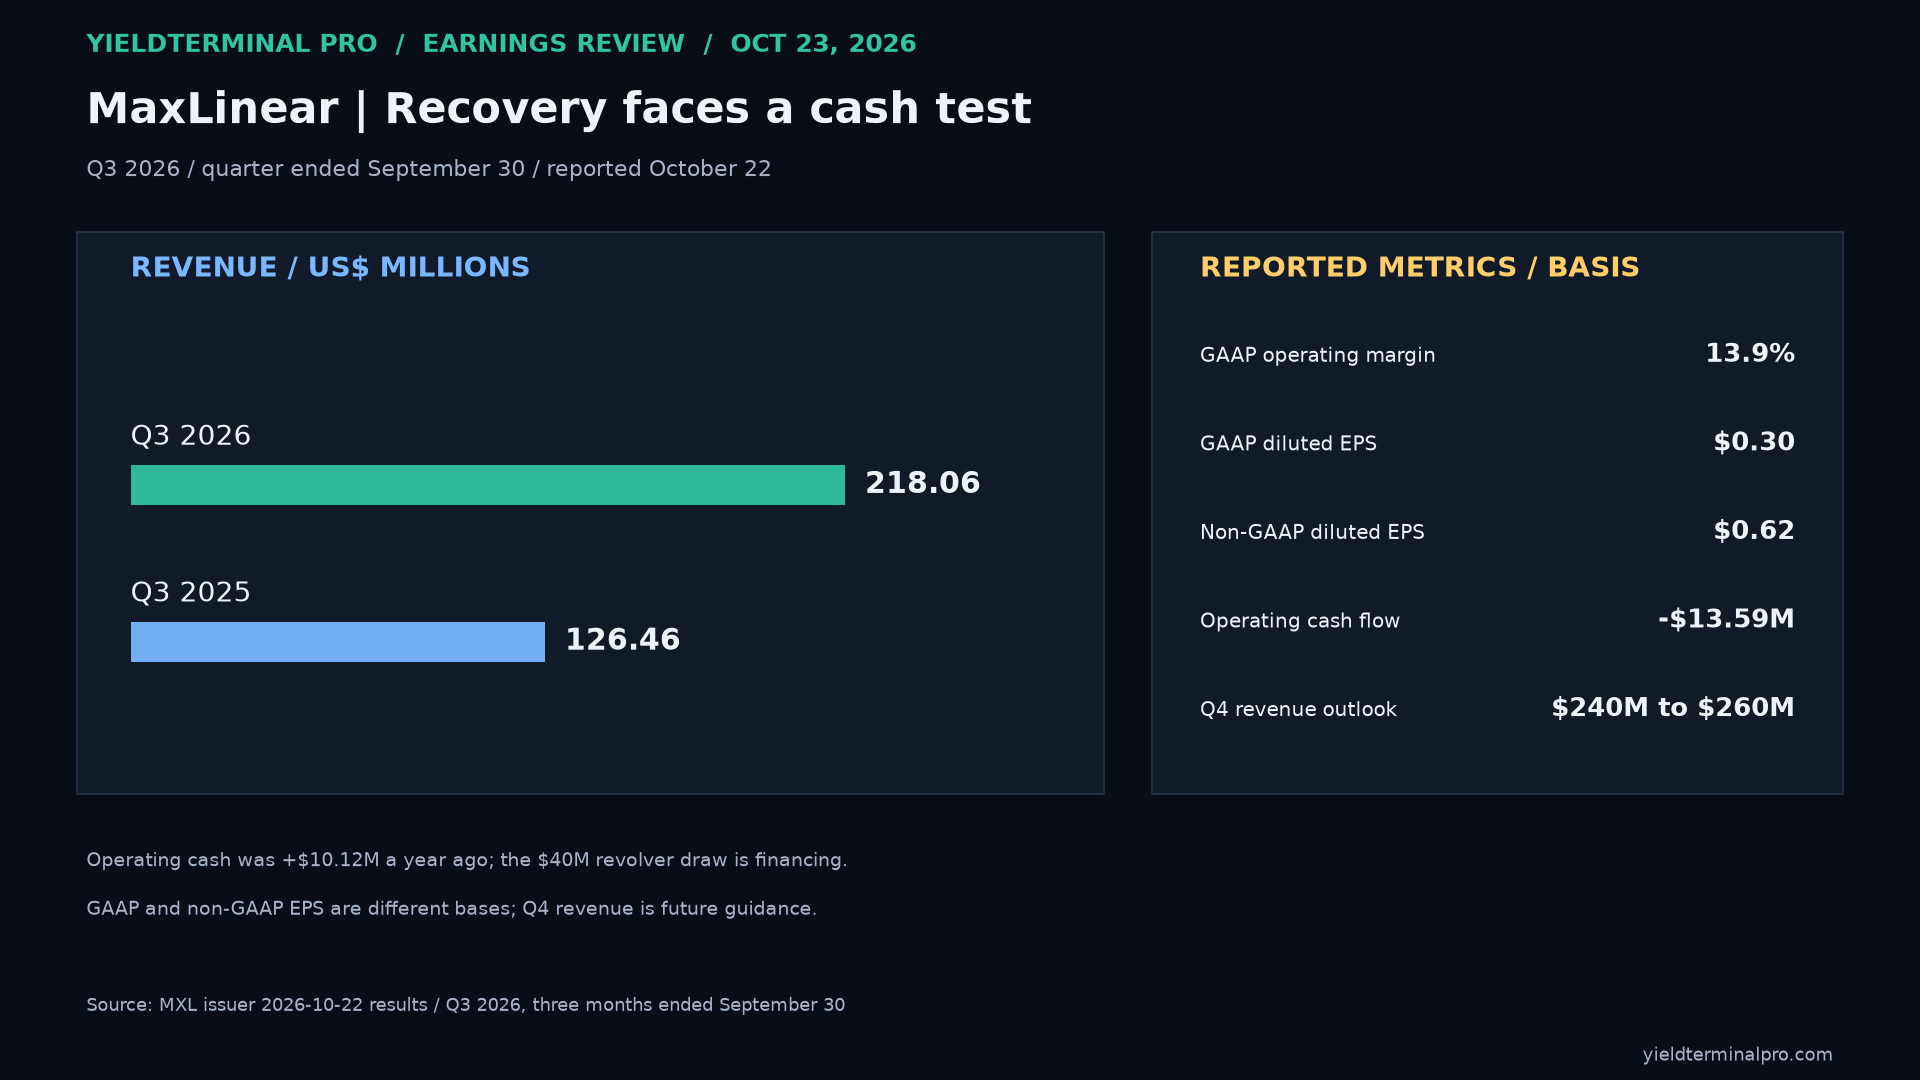
$MXLMaxLinear — Q3 2026, three months ended September 30 issuer results Q3 revenue rose to $218.06 million from $126.46 million, while operating cash flow was negative $13.59 million.
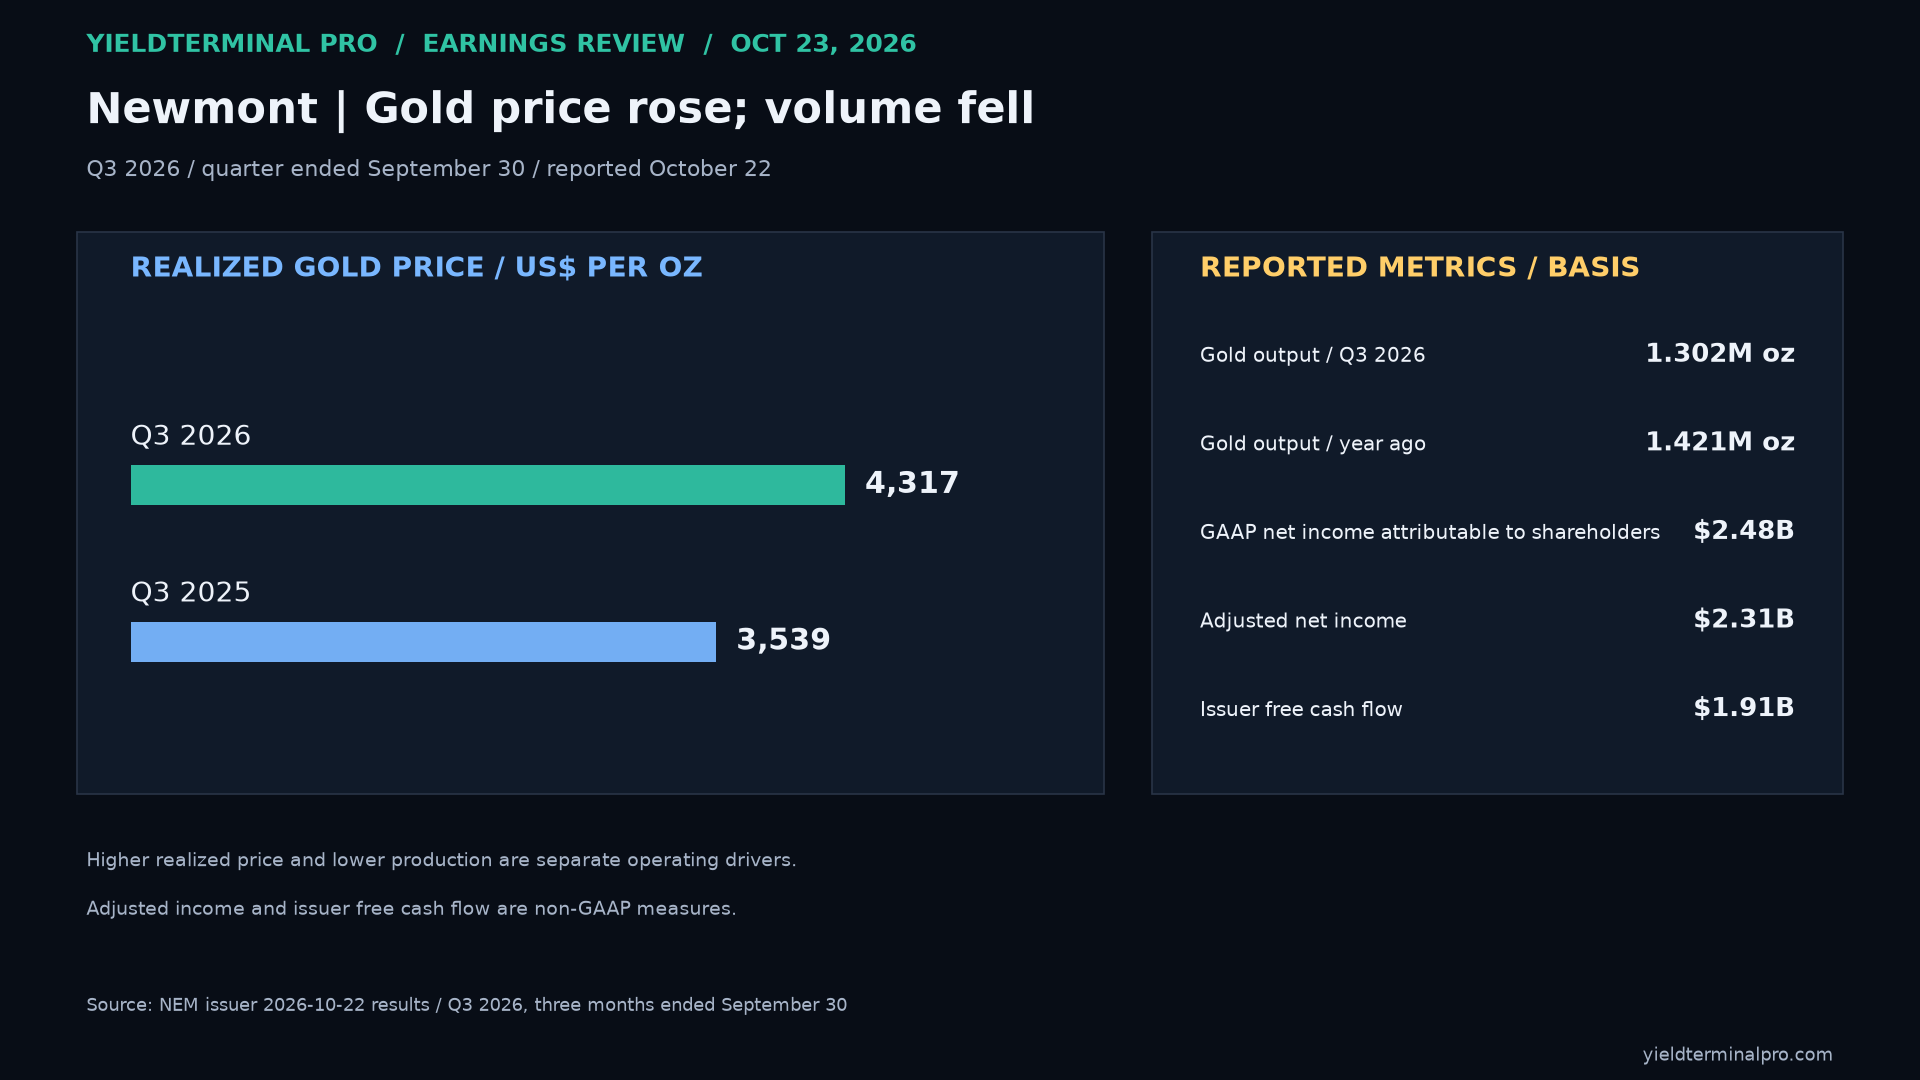
$NEMNewmont Corporation — Q3 2026, three months ended September 30 issuer results Q3 realized gold price rose to $4,317 per ounce from $3,539; production fell to 1.302 million ounces from 1.421 million.
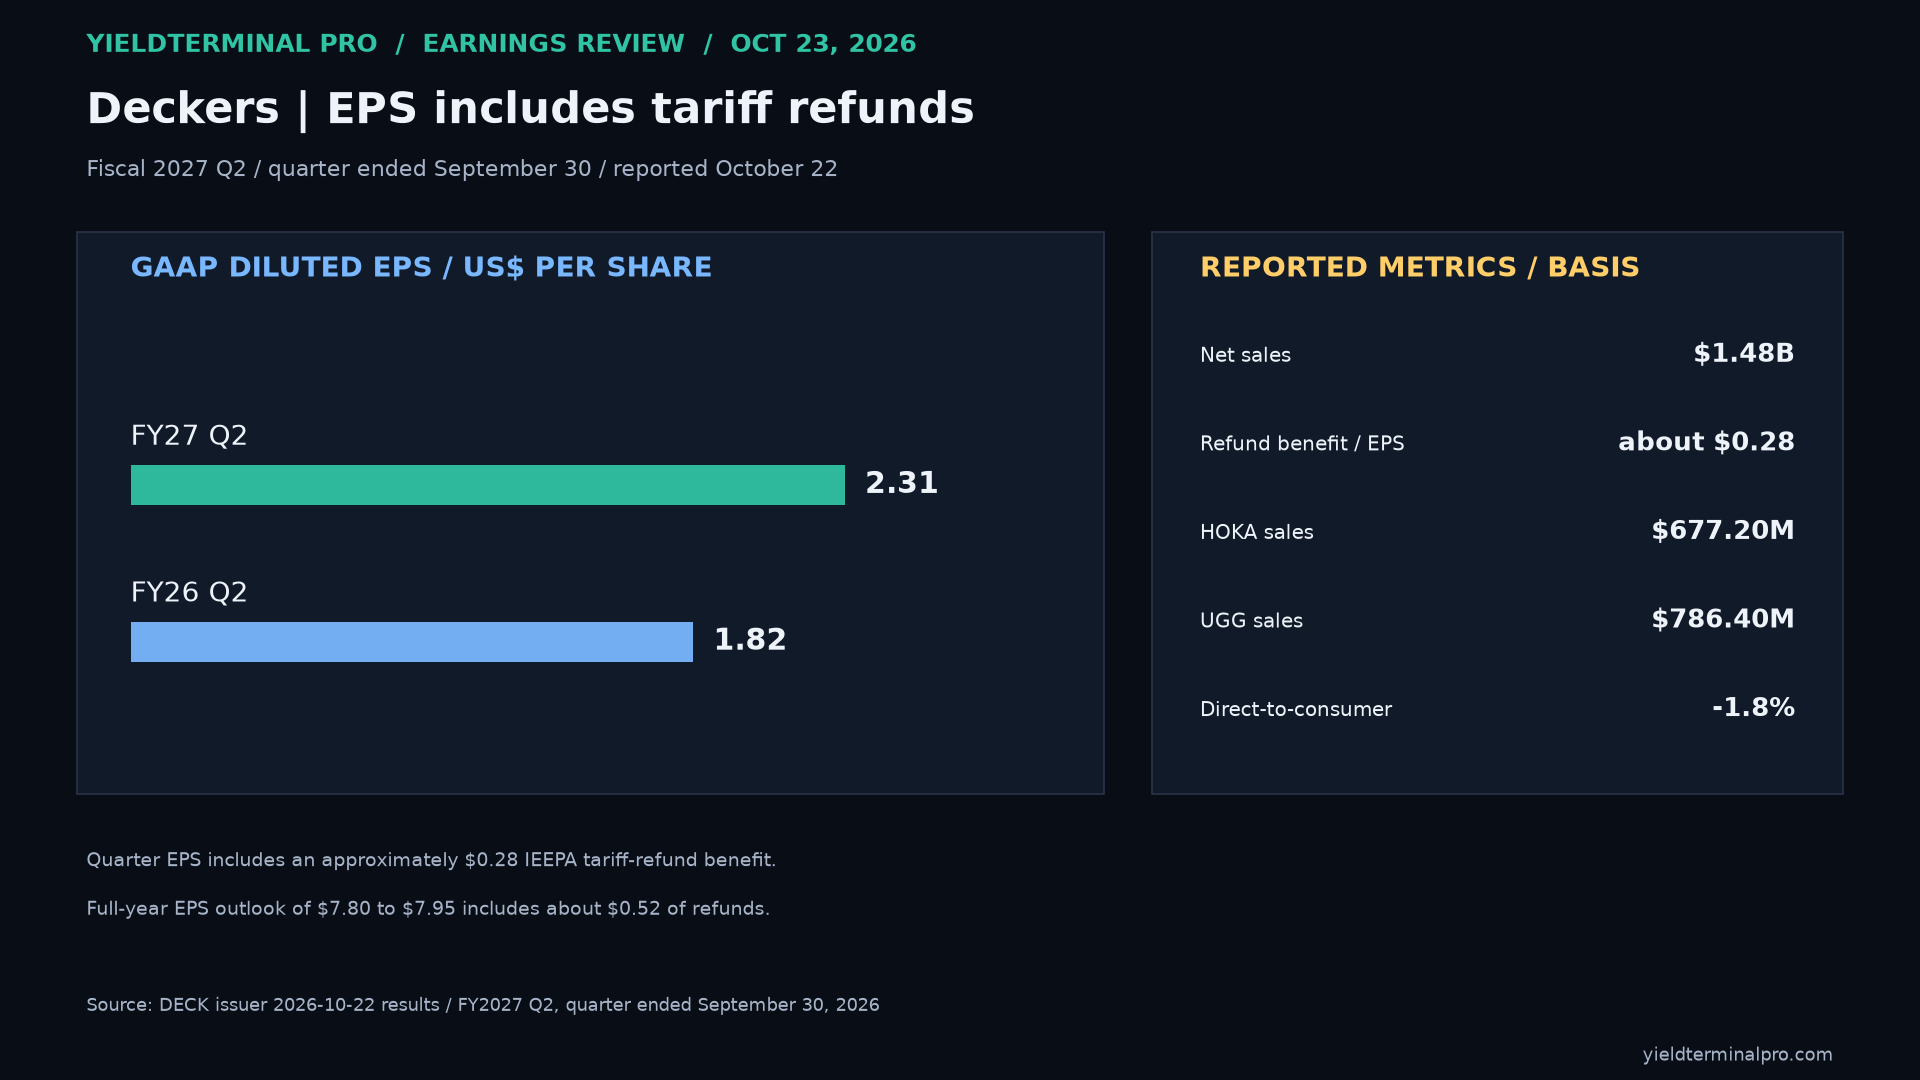
$DECKDeckers Outdoor Corporation — FY2027 Q2, quarter ended September 30, 2026 issuer results Fiscal 2027 Q2 GAAP EPS was $2.31, including about $0.28 from tariff refunds; net sales rose 3.5%.
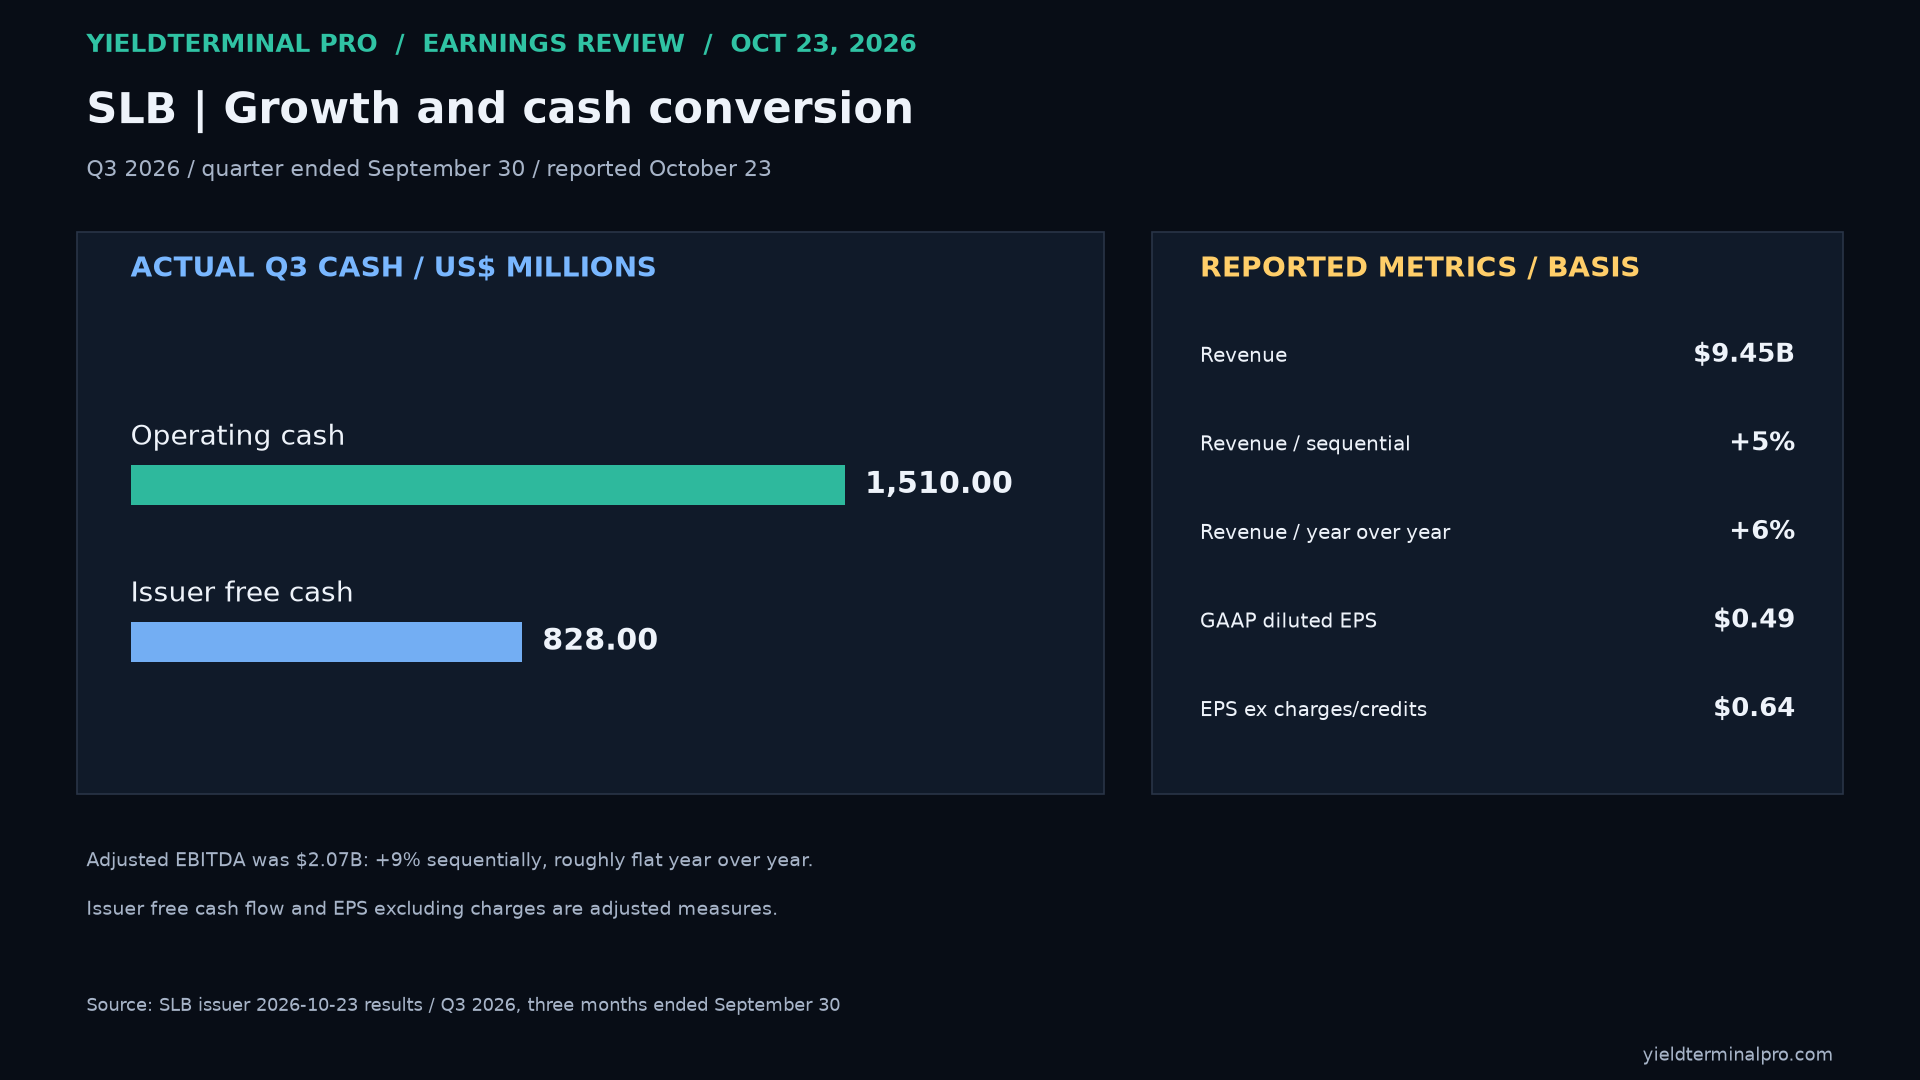
$SLBSLB — Q3 2026, three months ended September 30 issuer results Q3 revenue was $9.45 billion; GAAP EPS was $0.49 and EPS excluding charges and credits was $0.64.
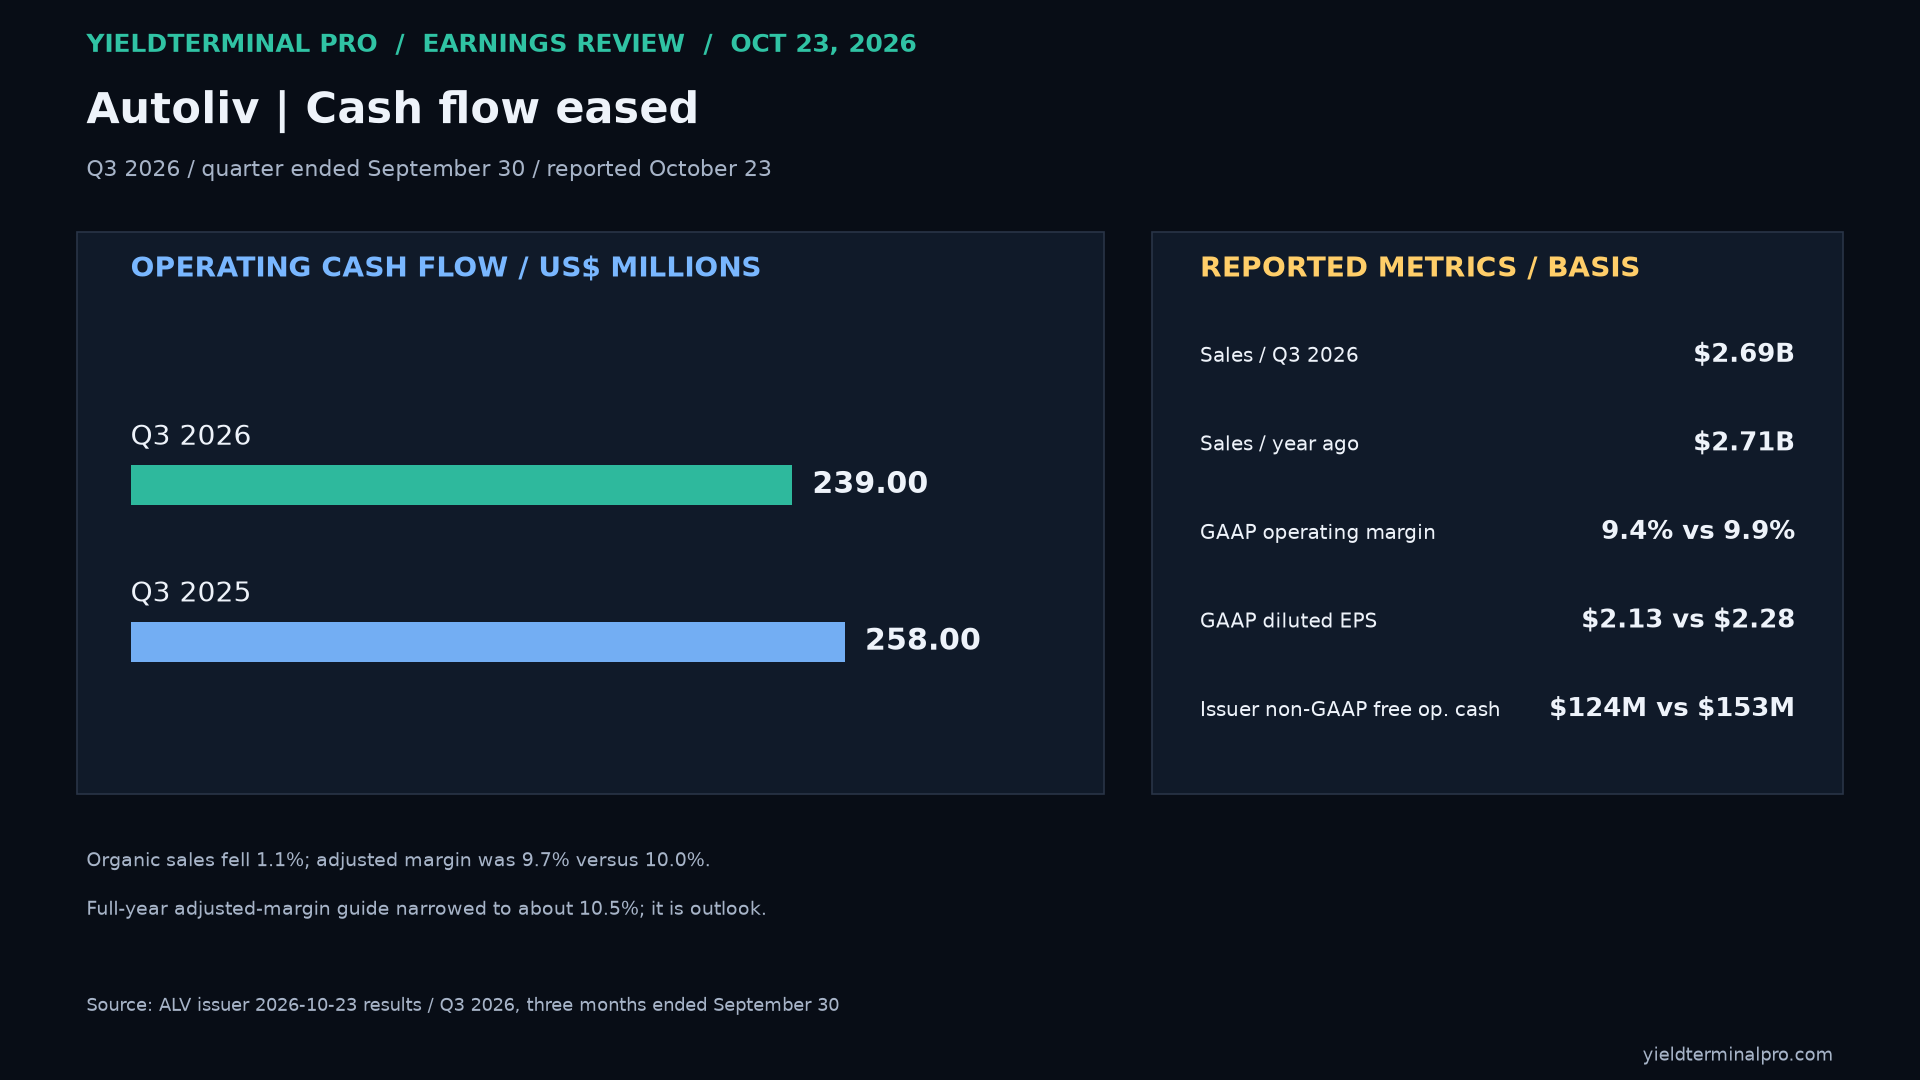
$ALVAutoliv — Q3 2026, three months ended September 30 issuer results Q3 net sales were $2.693 billion versus $2.706 billion; GAAP operating margin narrowed to 9.4% from 9.9%.
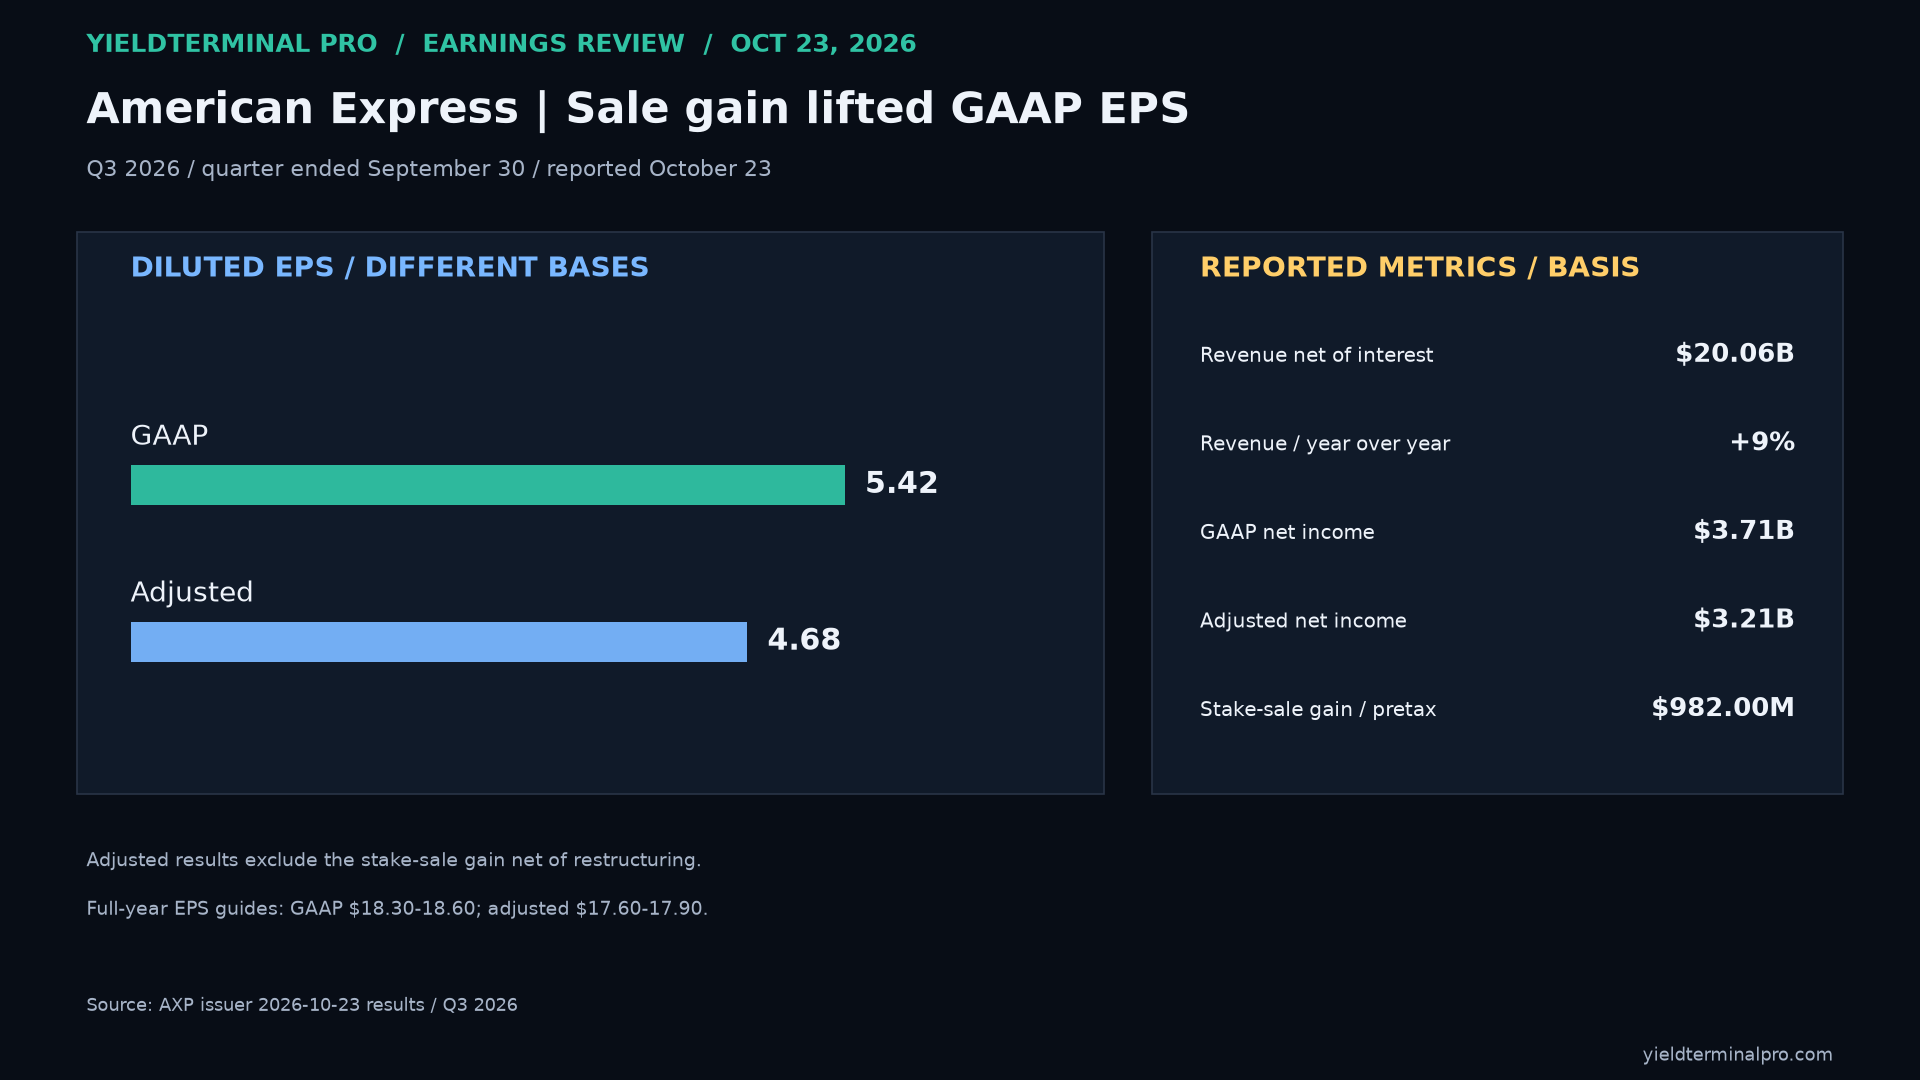
$AXPAmerican Express Company — Q3 2026 issuer results Q3 GAAP EPS was $5.42, including a stake-sale gain; adjusted EPS was $4.68. Revenues net of interest expense reached $20.062 billion.
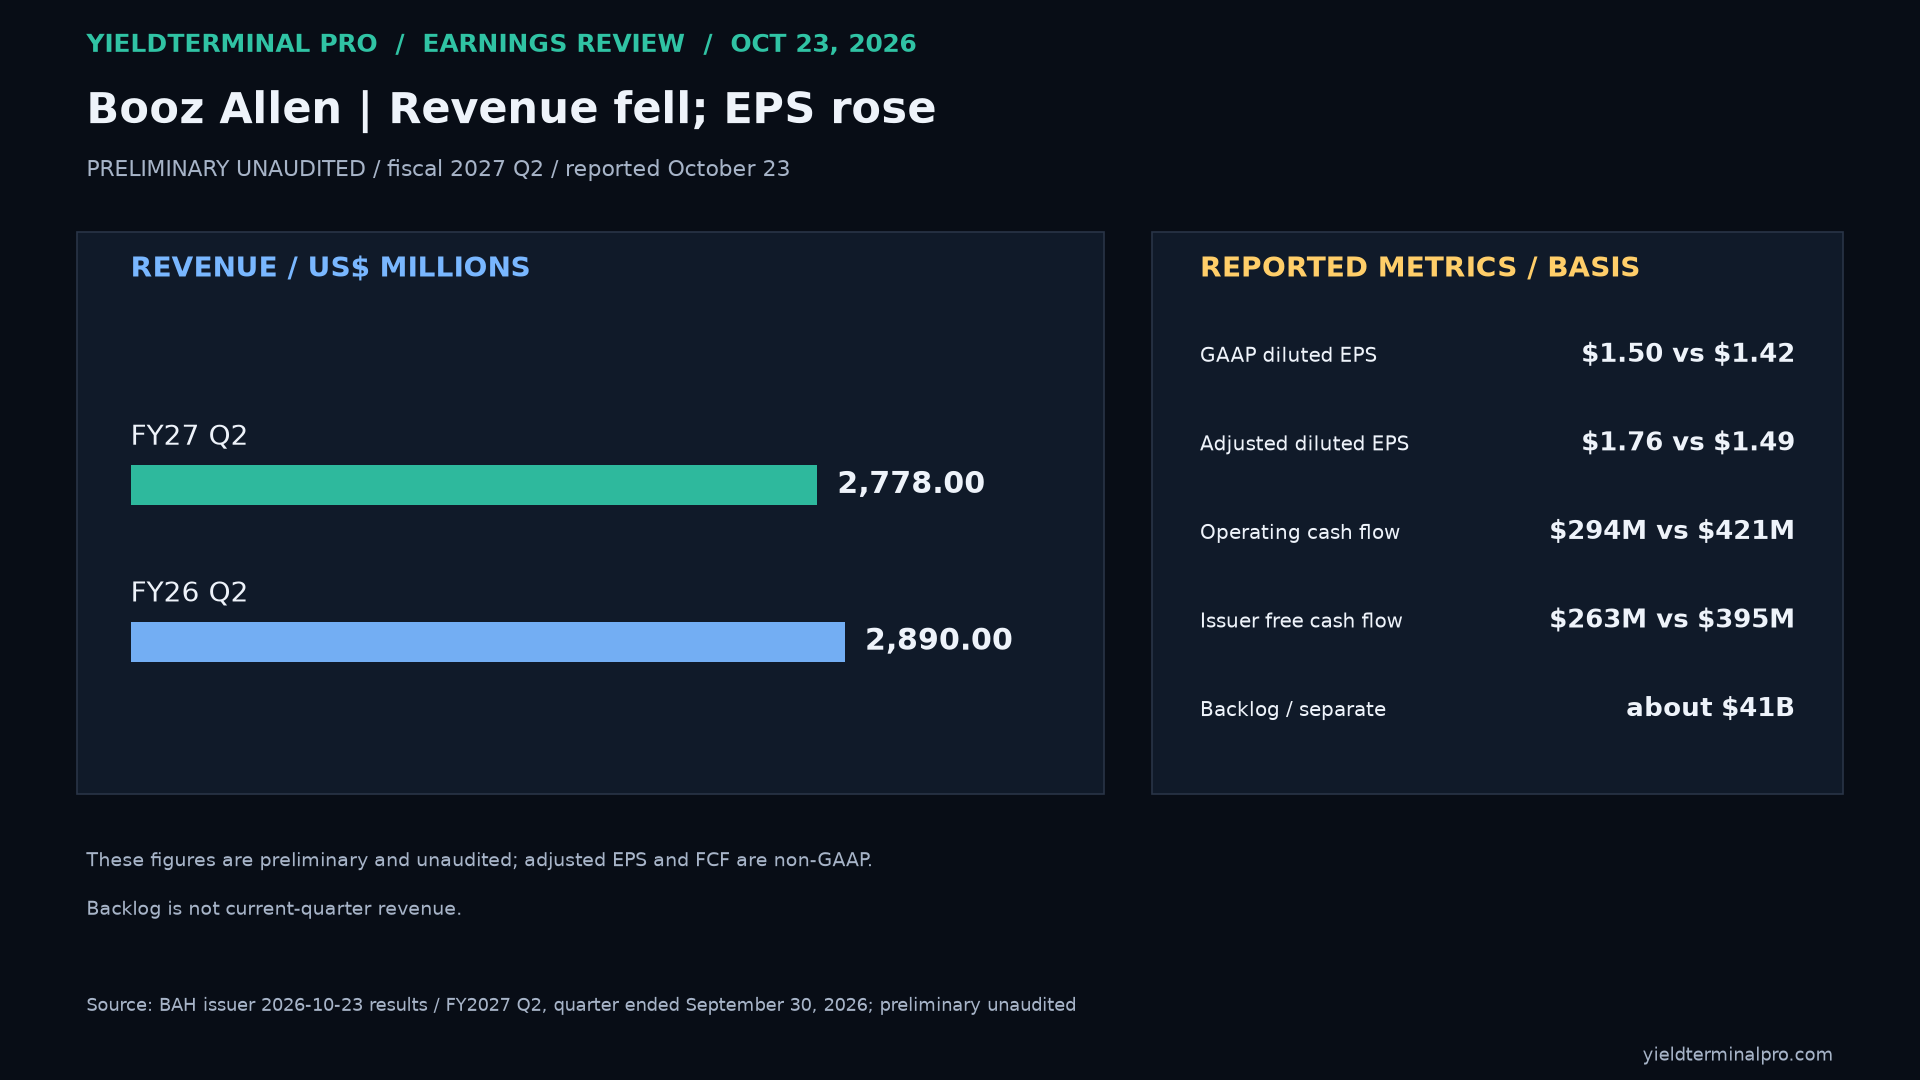
$BAHBooz Allen Hamilton — FY2027 Q2, quarter ended September 30, 2026; preliminary unaudited issuer results Preliminary fiscal 2027 Q2 revenue was $2.778 billion versus $2.890 billion; operating cash flow was about $294 million versus $421 million.