Fri, 16 Oct 2026
124.53 2026-10-13 regular close — historical earnings-day review
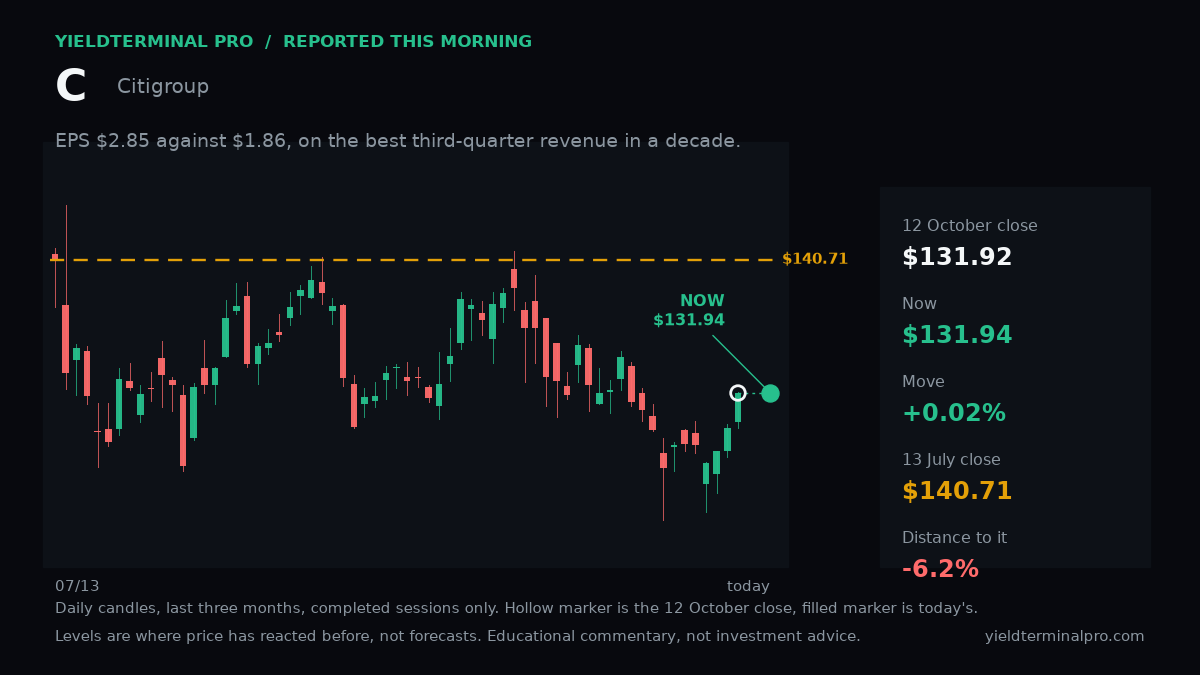
Retrospective earnings-day chart, 2026-10-13: All three averages above the close.
| After | Close | vs Fri, 16 Oct 2026 close | vs published price |
|---|---|---|---|
| 1 session | 121.69 | — | -2.28% |
| 5 sessions | 120.62 | — | -3.14% |
- 20-session SMA through 2026-10-13 130.45 — published below, latest close below
- 50-session SMA through 2026-10-13 133.44 — published below, latest close below
- 200-session SMA through 2026-10-13 126.32 — published below, latest close below
- Oct 13 high 133.50 — published below, latest close below
- Oct 13 low 124.44 — published above, latest close belowcrossed
- 20-session high / 09-16 136.89 — published below, latest close below
- 20-session low / 10-01 123.57 — published above, latest close belowcrossed