← All daily levels$SPY support and resistance levels, and what followed
SPY — October 23 Morning Watch — daily
Each note as it was published, with the price that followed. We publish where price sits against its own levels, not where it is going, so nothing here is scored as right or wrong. Educational commentary, not investment advice.
24 notes, newest first, back to Tue, 13 Oct 2026.
Get the week in one email
Every level we marked, and what price did next. Free, Sundays.
Subscribing signs you up for the free YieldTerminal Sunday recap, one email a week. Educational only, not financial advice. Unsubscribe any time.
Earlier recorded October 23 premarket $762.56 against completed October 22 close $763.96 and low $761.17. The later verified $760.58 observation is recorded separately; it is not plotted on this earlier chart.
No session has closed since this was published.

Fri, 23 Oct 2026760.58 Later recorded October 23 premarket observation; separate from completed daily candle
Later recorded October 23 Nasdaq premarket $760.58 (Yahoo near $760.51), below the completed October 22 intraday low $761.17. That low now needs a reclaim, then a daily retest and close above. This later point is not plotted in the preserved earlier chart.
No session has closed since this was published.
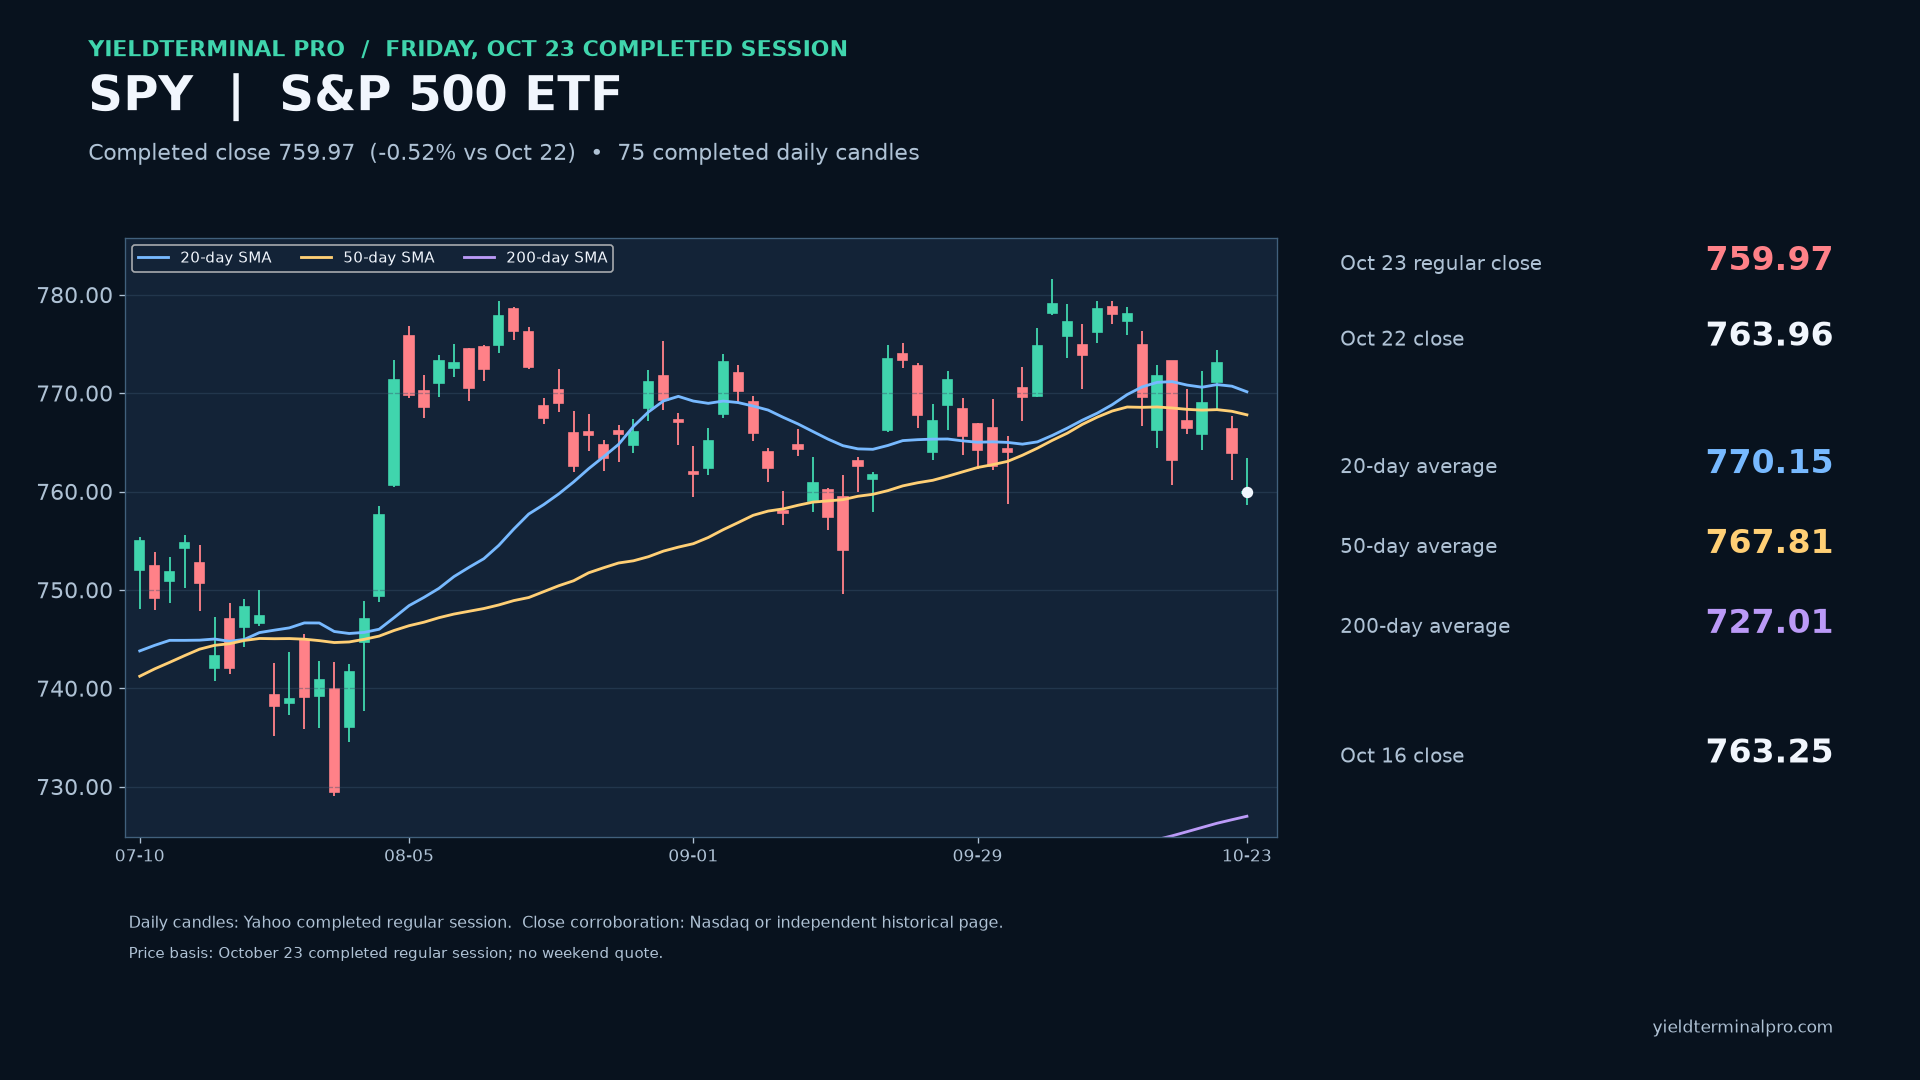
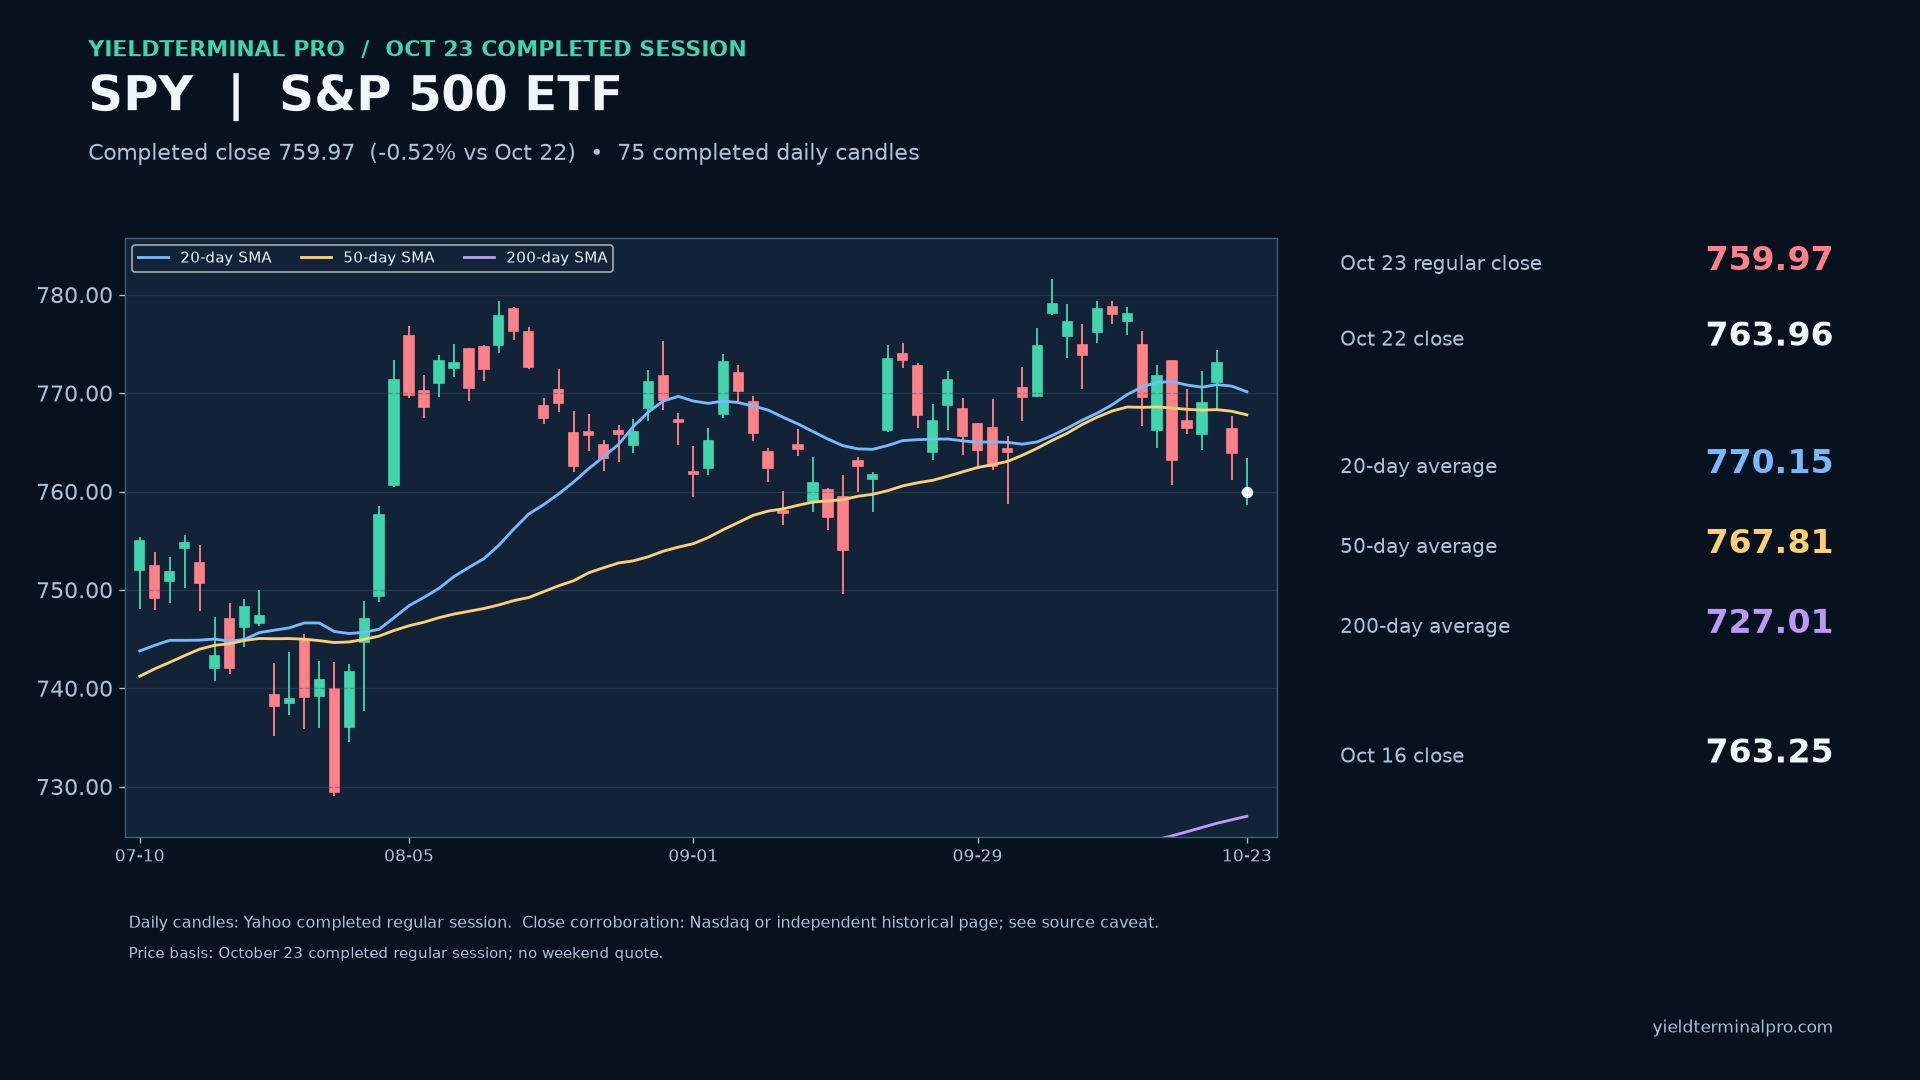
SPY completed October 23 regular-session daily chart: close 759.97; 20-day SMA 770.15, 50-day SMA 767.81, 200-day SMA 727.01; October 23 intraday low 758.68; October 22 intraday low 761.17.
No session has closed since this was published.
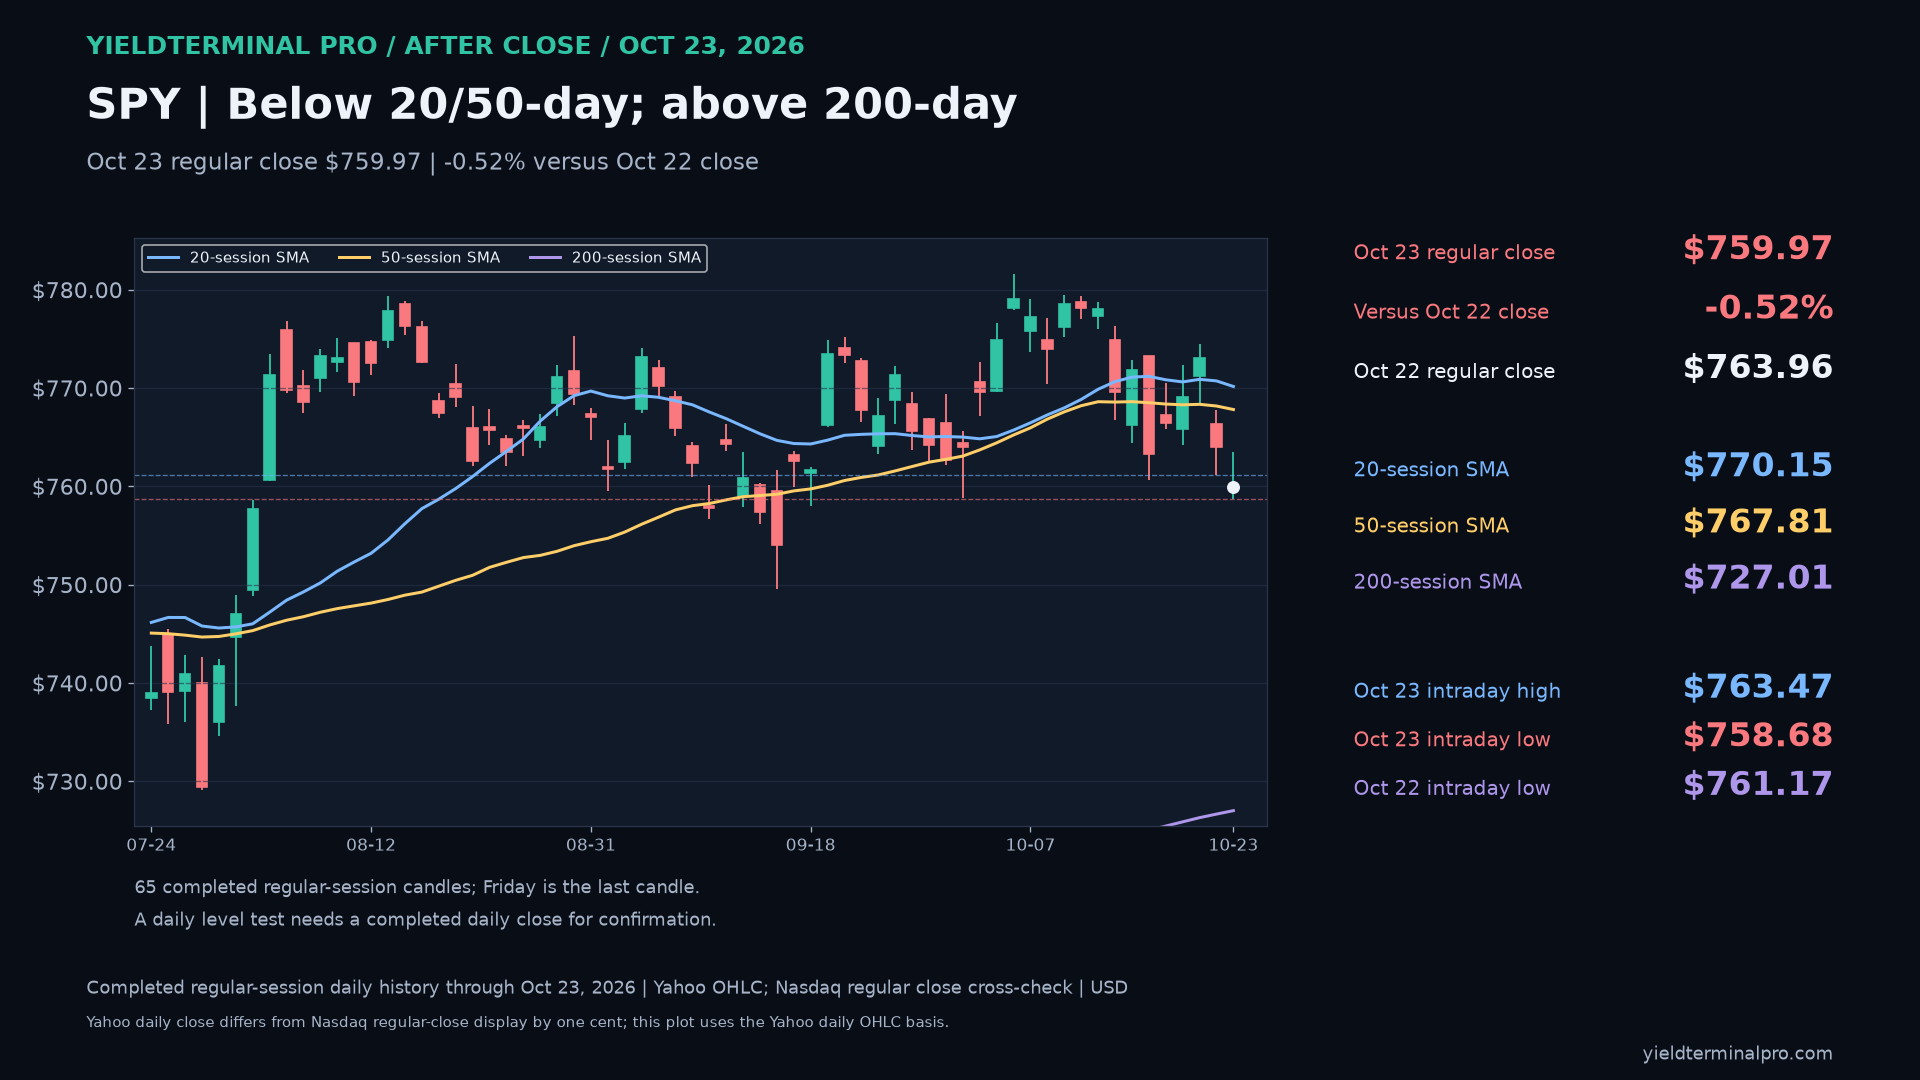
Completed October 23 regular-session close $759.97, below 20-day, below 50-day, above 200-day. Daily reclaim conditions are distinct from an intraday touch.
No session has closed since this was published.
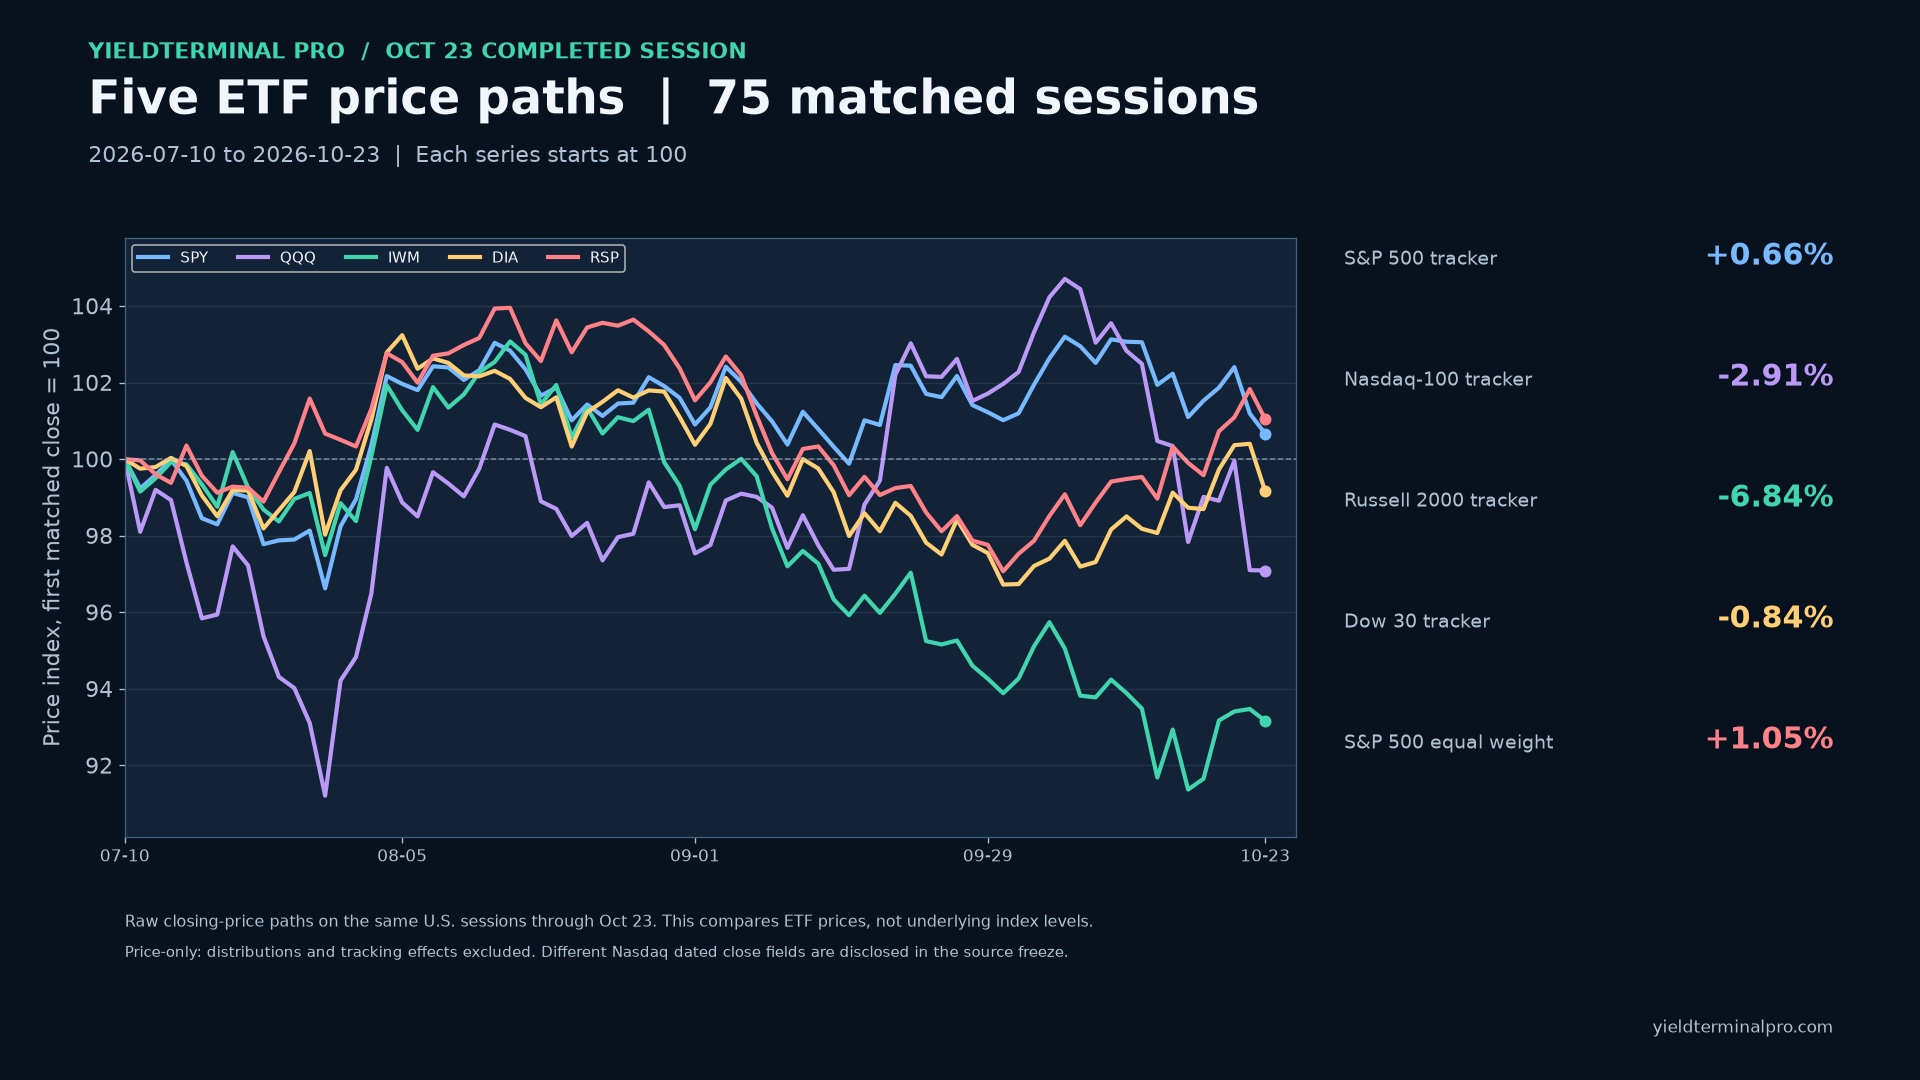
SPY, QQQ, IWM, DIA and RSP closing-price paths on 75 matched U.S. sessions through October 23, 2026, each indexed to 100 at the first close. Price-only comparison; distributions excluded.
No session has closed since this was published.
S&P 500 ETF (SPY) daily chart through October 23, 2026. Completed close 759.97, 20-day average 770.15, 50-day 767.81, 200-day 727.01.
No session has closed since this was published.
Separate October 22 premarket $766.04 (-0.91%) against completed October 21 daily references.
| After | Close | vs Thu, 22 Oct 2026 close | vs published price |
|---|
| 1 session | 759.97 | -0.52% | -0.79% |
This note was marked to a October 22 premarket observation, not a close. The like-for-like column is the one measured from the Thu, 22 Oct 2026 close.
- October 21 intraday high 774.44 — published below, latest close below
- October 21 intraday low 768.40 — published below, latest close below
- 20-day SMA through October 21 770.88 — published below, latest close below
- 50-day SMA through October 21 768.34 — published below, latest close below
- 200-day SMA through October 21 726.29 — published above, latest close above
- 2026-10-16 closing low 763.25 — published above, latest close belowcrossed

SPY: completed October 22 regular-session daily chart, close 764.06; 20-day SMA through October 22 770.72; 50-day SMA through October 22 768.17; 200-day SMA through October 22 726.65; October 21 intraday high 774.44; October 21 intraday low 768.40.
No session has closed since this was published.

Separate October 21 premarket $769.25 (+0.03%) against completed October 20 daily references.
No session has closed since this was published.

Completed regular close $773.17, +0.54% versus October 20. 20-day SMA $770.88; 50-day SMA $768.34; 200-day SMA $726.29. October 21 high $774.43, low $768.40.
| After | Close | vs Wed, 21 Oct 2026 close | vs published price |
|---|
| 1 session | 763.96 | — | — |

Tue, 20 Oct 2026764.78 October 20 dated premarket observation / separate from completed daily candles
The dated October 20 premarket observation $764.78 was below Monday's $765.82 intraday low. That level and the $768.37 50-day/$770.83 20-day averages need daily recovery and confirmation; Friday's close and intraday low remain separate dated references.
No session has closed since this was published.

Completed regular close $769.32, +0.37%. 20-day SMA $770.63, 50-day $768.29, 200-day $725.87. A daily retest and close above a reclaimed level remains the confirmation rule.
No session has closed since this was published.

The observed premarket rebound remains below the 50- and 20-session averages. A daily test and close above the recovered level is required for a successful retest.
No session has closed since this was published.

SPY traded above the morning 50-day reference but closed back below it. The updated 50-day and 20-day remain recovery tests; Friday’s $763.25 close and $760.64 intraday low remain dated downside references. A daily test and close above a recovered level would strengthen the repair.
No session has closed since this was published.

The retained premarket mark is just above the October 15 intraday high. The 20- and 50-session averages are the nearby daily references beneath it.
| After | Close | vs Fri, 16 Oct 2026 close | vs published price |
|---|
| 1 session | 766.48 | +0.42% | -0.89% |
| 5 sessions | 759.97 | -0.43% | -1.73% |
This note was marked to a October 16 premarket - Morning Watch edition, not a close. The like-for-like column is the one measured from the Fri, 16 Oct 2026 close.
- 20-session SMA 771.11 — published above, latest close belowcrossed
- 50-session SMA 768.61 — published above, latest close belowcrossed
- 200-session SMA 724.63 — published above, latest close above
- Oct 15 high 772.87 — published above, latest close belowcrossed
- Oct 15 low 764.43 — published above, latest close belowcrossed
- Sep 24 low 763.25 — published above, latest close belowcrossed
- Sep 30 low 762.18 — published above, latest close belowcrossed

SPY — Lost the nearby averages
| After | Close | vs Fri, 16 Oct 2026 close | vs published price |
|---|
| 1 session | 766.48 | — | +0.43% |
| 5 sessions | 759.97 | — | -0.43% |
- 20-day SMA 771.183 — published below, latest close below
- 50-day SMA 768.501 — published below, latest close below
- 200-day SMA 725.014 — published above, latest close above
- Sep 30 low 762.18 — published above, latest close belowcrossed
- Sep 24 low / reclaim 763.25 — published below, latest close below
- Oct 15 low / reclaim 764.43 — published below, latest close below

Thu, 15 Oct 2026767.19 October 15 premarket observation 2026-10-15T08:35:02-04:00
SPY: October 14 regular close $769.60; October 15 observed premarket $767.19 (-0.31%).
| After | Close | vs Thu, 15 Oct 2026 close | vs published price |
|---|
| 1 session | 763.25 | -1.11% | -0.51% |
| 5 sessions | 763.96 | -1.01% | -0.42% |
This note was marked to a October 15 premarket observation 2026-10-15T08:35:02-04:00, not a close. The like-for-like column is the one measured from the Thu, 15 Oct 2026 close.
- Oct 2 daily gap 765.65 — published above, latest close belowcrossed
- Sep 24 low 763.25 — published above, latest close belowcrossed
- Sep 30 low 762.18 — published above, latest close belowcrossed
- Oct 8 low 770.44 — published below, latest close below
- 20-session SMA through October 14 770.646 — published below, latest close below
- 50-session SMA through October 14 768.568 — published below, latest close below
- 200-session SMA through October 14 724.214 — published above, latest close above

SPDR S&P 500 ETF Trust closed at $771.77 (+0.28% versus October 14). The closing chart compares the retained morning setup with the completed session and dated daily references.
| After | Close | vs Thu, 15 Oct 2026 close | vs published price |
|---|
| 1 session | 763.25 | — | -1.10% |
| 5 sessions | 763.96 | — | -1.01% |
- 20-session SMA 771.10 — published above, latest close belowcrossed
- 50-session SMA 768.61 — published above, latest close belowcrossed
- 200-session SMA 724.63 — published above, latest close above
- Oct 2 gap / crossed 765.65 — published above, latest close belowcrossed
- Sep 24 low 763.25 — published above, latest close belowcrossed
- Sep 30 low 762.18 — published above, latest close belowcrossed
- Oct 8 low 770.44 — published above, latest close belowcrossed
- Oct 15 session low 764.43 — published above, latest close belowcrossed

SPY is -0.69% versus the October 13 regular close at this 10:12 a.m. ET observation.
| After | Close | vs Wed, 14 Oct 2026 close | vs published price |
|---|
| 1 session | 771.79 | +0.28% | -0.11% |
| 5 sessions | 773.09 | +0.45% | +0.06% |
This note was marked to a 10:12 a.m. ET regular-session observation, not a close. The like-for-like column is the one measured from the Wed, 14 Oct 2026 close.
- Oct 9 low 775.14 — published below, latest close below
- Oct 8 low 770.44 — published above, latest close belowcrossed
- Oct 13 low / reclaim 775.95 — published below, latest close below
- Oct 13 close / reclaim 778.01 — published below, latest close below
- Open daily gap from 2026-10-02 765.65 — published above, latest close belowcrossed
- 20-day SMA through October 13 769.869 — published above, latest close belowcrossed
- 50-day SMA through October 13 768.603 — published above, latest close belowcrossed
- 200-day SMA through October 13 723.817 — published above, latest close above

SPY is below the October 13 and October 9 lows; those are reclaim references, with the October 8 low below.
| After | Close | vs Wed, 14 Oct 2026 close | vs published price |
|---|
| 1 session | 771.79 | +0.28% | -0.11% |
| 5 sessions | 773.09 | +0.45% | +0.06% |
This note was marked to a 10:12 a.m. ET regular-session observation, not a close. The like-for-like column is the one measured from the Wed, 14 Oct 2026 close.
- Oct 9 low 775.14 — published below, latest close below
- Oct 8 low 770.44 — published above, latest close belowcrossed
- Oct 13 low / reclaim 775.95 — published below, latest close below
- Oct 13 close / reclaim 778.01 — published below, latest close below
- Open daily gap from 2026-10-02 765.65 — published above, latest close belowcrossed
- 20-day SMA through October 13 769.869 — published above, latest close belowcrossed
- 50-day SMA through October 13 768.603 — published above, latest close belowcrossed
- 200-day SMA through October 13 723.817 — published above, latest close above

SPY closed at $769.67, -1.07% versus the October 13 regular close. The retained morning observation remains separate.
| After | Close | vs Wed, 14 Oct 2026 close | vs published price |
|---|
| 1 session | 771.79 | — | +0.28% |
| 5 sessions | 773.09 | — | +0.44% |
- Oct 8 low / reclaim 770.44 — published below, latest close below
- Oct 13 low / reclaim 775.95 — published below, latest close below
- Oct 2 gap remains 765.65 — published above, latest close belowcrossed
- 20-session SMA through October 14 770.65 — published below, latest close below
- 50-session SMA through October 14 768.569 — published above, latest close belowcrossed
- 200-session SMA through October 14 724.214 — published above, latest close above

SPY: -1.21% from the earlier closing peak to the subsequent closing low. The October 14 close is that subsequent low in the retained history; no later closing rebound has occurred.
| After | Close | vs Wed, 14 Oct 2026 close | vs published price |
|---|
| 1 session | 771.79 | — | +0.28% |
| 5 sessions | 773.09 | — | +0.44% |
- Closing peak / 2026-10-06 779.09 — published below, latest close below
- Subsequent closing low / 2026-10-14 769.67 — published below, latest close below
- October 14 regular close 769.67 — published below, latest close below

SPY closed at $778.01, still below the October 6 intraday high at $781.62.
| After | Close | vs Tue, 13 Oct 2026 close | vs published price |
|---|
| 1 session | 769.60 | — | -1.08% |
| 5 sessions | 769.05 | — | -1.15% |
- October 6 intraday high 781.62 — published below, latest close below
- October 13 intraday low 775.95 — published above, latest close belowcrossed
- October 8 intraday low 770.44 — published above, latest close belowcrossed
- 20-session SMA 769.87 — published above, latest close belowcrossed
- 50-session SMA 768.60 — published above, latest close belowcrossed
