Fri, 16 Oct 2026
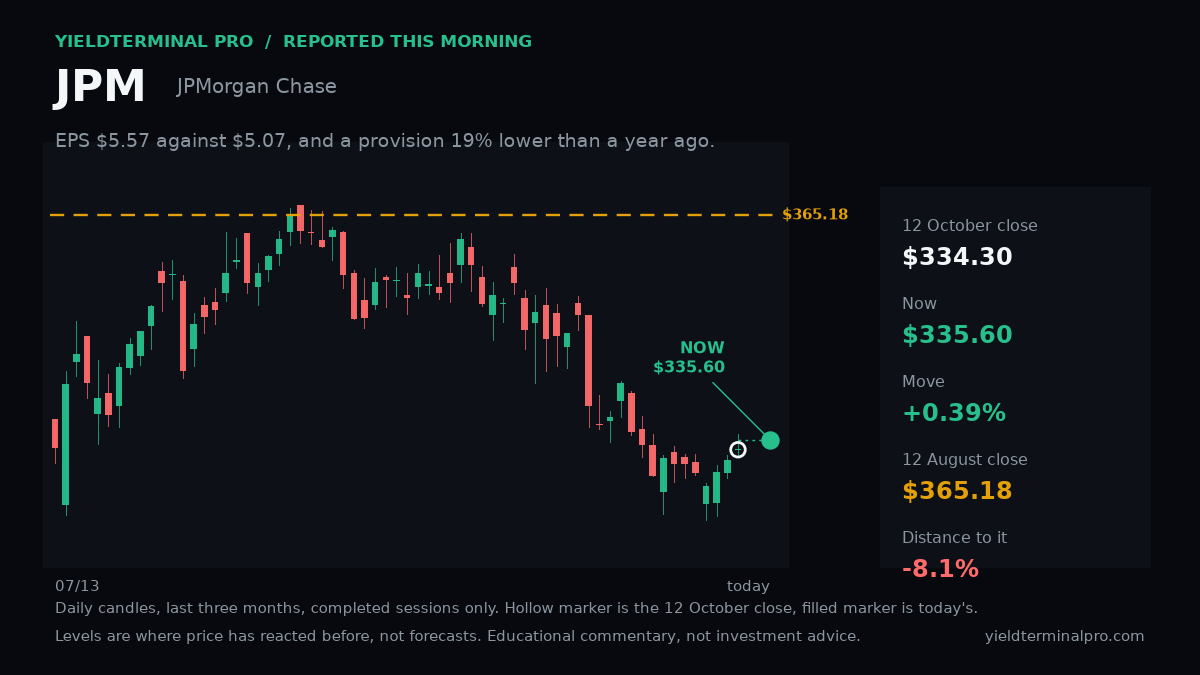
331.43 2026-10-13 regular close — historical earnings-day review
Retrospective earnings-day chart, 2026-10-13: 200-session averages below the close; 20, 50-session averages above it.
| After | Close | vs Fri, 16 Oct 2026 close | vs published price |
|---|---|---|---|
| 1 session | 333.53 | — | +0.63% |
| 5 sessions | 331.58 | — | +0.05% |
- 20-session SMA through 2026-10-13 337.52 — published below, latest close below
- 50-session SMA through 2026-10-13 349.37 — published below, latest close below
- 200-session SMA through 2026-10-13 322.19 — published above, latest close above
- Oct 13 high 344.36 — published below, latest close below
- Oct 13 low 331.17 — published above, latest close above
- 20-session high / 09-16 355.60 — published below, latest close below
- 20-session low / 10-07 325.07 — published above, latest close above