← All daily levels

$META support and resistance levels, and what followed

Meta Platforms, Inc. — October 23 earnings review

Each note as it was published, with the price that followed. We publish where price sits against its own levels, not where it is going, so nothing here is scored as right or wrong. Educational commentary, not investment advice.

12 notes, newest first, back to Sun, 4 Oct 2026.

Get the week in one email

Every level we marked, and what price did next. Free, Sundays.

Subscribing signs you up for the free YieldTerminal Sunday recap, one email a week. Educational only, not financial advice. Unsubscribe any time.

Fri, 23 Oct 2026

648.85 October 22 completed regular-session close

META closed October 22 at $648.85, below its 50-day average ($662.86) and above its 200-day average ($632.56). The October 22 high ($681.07) and low ($639.69) are dated reference levels. This is completed daily history, not an October 23 quote.

No session has closed since this was published.
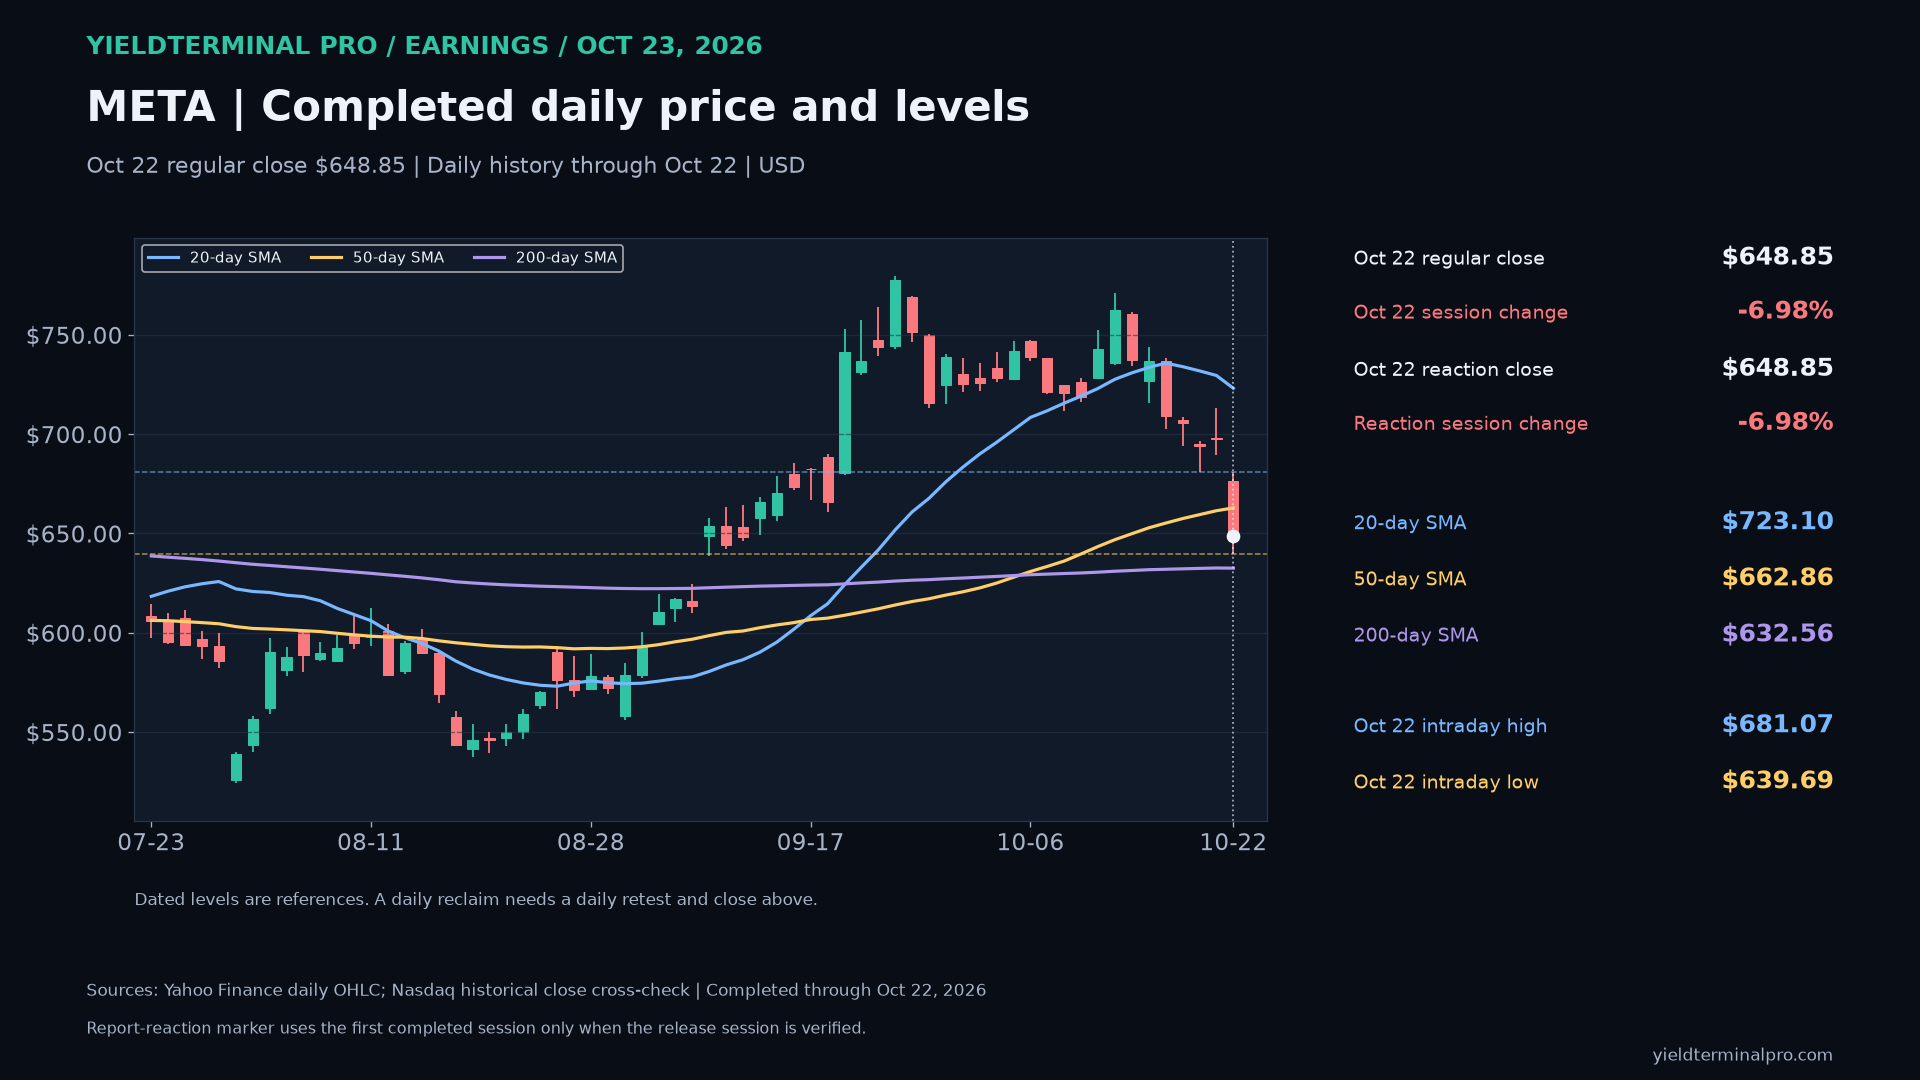
META chart published Fri, 23 Oct 2026
Thu, 22 Oct 2026

676.98 October 22 recorded premarket observation

Recorded October 22 premarket $676.98 (-2.94% versus Wednesday close $697.52), below Wednesday low $689.68 and the 20-day average. The former low needs a reclaim, daily retest and close above; the 50- and 200-day averages remain underneath.

AfterClosevs Thu, 22 Oct 2026 closevs published price
1 session642.62-0.96%-5.08%

This note was marked to a October 22 recorded premarket observation, not a close. The like-for-like column is the one measured from the Thu, 22 Oct 2026 close.

  • October 21 intraday high 713.22 — published below, latest close below
  • October 21 intraday low 689.68 — published below, latest close below
  • 20-day SMA through October 21 729.54 — published below, latest close below
  • 50-day SMA through October 21 661.46 — published above, latest close belowcrossed
  • 200-day SMA through October 21 632.62 — published above, latest close above
META chart published Thu, 22 Oct 2026
Thu, 22 Oct 2026

697.52 October 21 completed regular-session close; supporting graphic retains its stated historical or financial period

Quarterly financial results reported October 21; GAAP, issuer-adjusted measures, cash flows and forecasts retain their stated scopes.

AfterClosevs Thu, 22 Oct 2026 closevs published price
1 session642.62—-7.87%
META chart published Thu, 22 Oct 2026
Thu, 22 Oct 2026

648.85 October 22 completed regular-session close

META: completed October 22 regular-session daily chart, close 648.85; 20-day SMA through October 22 723.10; 50-day SMA through October 22 662.86; 200-day SMA through October 22 632.56; October 21 intraday high 713.22; October 21 intraday low 689.68.

AfterClosevs Thu, 22 Oct 2026 closevs published price
1 session642.62—-0.96%
  • 20-day SMA through October 22 723.10 — published below, latest close below
  • 50-day SMA through October 22 662.86 — published below, latest close below
  • 200-day SMA through October 22 632.56 — published above, latest close above
  • October 21 intraday high 713.22 — published below, latest close below
  • October 21 intraday low 689.68 — published below, latest close below
META chart published Thu, 22 Oct 2026
Wed, 21 Oct 2026

707.82 October 21 regular-session observation / separate from daily candles

$META $707.82, above 50-day $659.49. 200-day $632.42. Oct 20 high/low $696.51/$681.05.

AfterClosevs Wed, 21 Oct 2026 closevs published price
1 session648.85—-8.33%

This note was marked to a October 21 regular-session observation / separate from daily candles, not a close. The like-for-like column is the one measured from the Wed, 21 Oct 2026 close.

  • October 20 regular close 694.25 — published above, latest close belowcrossed
  • 20-session SMA through October 20 731.87 — published below, latest close below
  • 50-session SMA through October 20 659.49 — published above, latest close belowcrossed
  • 200-session SMA through October 20 632.42 — published above, latest close above
  • Oct 20 intraday high 696.51 — published above, latest close belowcrossed
  • Oct 20 intraday low 681.05 — published above, latest close belowcrossed
  • 2026-09-09 daily gap $624.80 to $638.56 624.80 — published above, latest close above
META chart published Wed, 21 Oct 2026

Completed regular close $697.52, +0.47% versus October 20. 20-day SMA $729.54; 50-day SMA $661.46; 200-day SMA $632.62. October 21 high $713.22, low $690.10.

AfterClosevs Wed, 21 Oct 2026 closevs published price
1 session648.85——
META chart published Wed, 21 Oct 2026

Separate recorded October 21 after-hours observation $718.00, +2.94% versus completed regular close $697.52. Provisional observation, not another daily candle or confirmed daily reclaim.

AfterClosevs Wed, 21 Oct 2026 closevs published price
1 session648.85——
META chart published Wed, 21 Oct 2026

Quarter ended September 30, 2026: revenue $64.60B (+26%); GAAP operating income $12.99B (-37%), including $9.89B legal charge; GAAP diluted EPS $3.83. Company illustration excluding legal charge gives EPS $7.40, distinct from reported GAAP. Quarterly operating cash flow $32.79B less capital spending including finance-lease principal $34.91B leaves non-GAAP FCF -$2.12B. Separately labeled Q4 revenue forecast $73.00-$76.00B and full-year capital-spending outlook $135.00-$145.00B.

AfterClosevs Wed, 21 Oct 2026 closevs published price
1 session648.85——
META chart published Wed, 21 Oct 2026
Sat, 17 Oct 2026

709.325 October 16 regular close

October 16 close $709.33 was above the 50-session SMA ($655.24) and above the 200-session SMA ($631.98). Earnings preview for October 19-23; historical levels do not bound an earnings gap.

AfterClosevs Sat, 17 Oct 2026 closevs published price
1 session705.44—-0.55%
5 sessions642.62—-9.40%
  • 50-session SMA 655.24 — published above, latest close belowcrossed
  • 200-session SMA 631.977 — published above, latest close above
META chart published Sat, 17 Oct 2026
Fri, 16 Oct 2026

736.72 October 15 regular close - October 16 written research

October 16 written research edition, using the completed October 15 close and moving averages. This chart is a distinct version from the morning premarket edition.

AfterClosevs Fri, 16 Oct 2026 closevs published price
1 session705.44—-4.25%
5 sessions642.62—-12.77%
  • 20-session SMA 733.60 — published above, latest close belowcrossed
  • 50-session SMA 652.85 — published above, latest close belowcrossed
  • 200-session SMA 631.76 — published above, latest close above
  • Oct 15 intraday high 743.97 — published below, latest close below
  • Oct 15 intraday low 715.58 — published above, latest close belowcrossed
  • 2026-09-09 remaining daily gap 624.80 — published above, latest close above
META chart published Fri, 16 Oct 2026
Tue, 13 Oct 2026

762.50 October 13 regular-session close

META gained 2.63% from the October 12 close to $762.50 at the October 13 regular-session close. Above the 50-day at $646.90 and above the 200-day at $631.00.

AfterClosevs Tue, 13 Oct 2026 closevs published price
1 session737.54—-3.27%
5 sessions694.25—-8.95%
  • 50-session SMA 646.90 — published above, latest close belowcrossed
  • 200-session SMA 631.00 — published above, latest close above
META chart published Tue, 13 Oct 2026
Sun, 4 Oct 2026

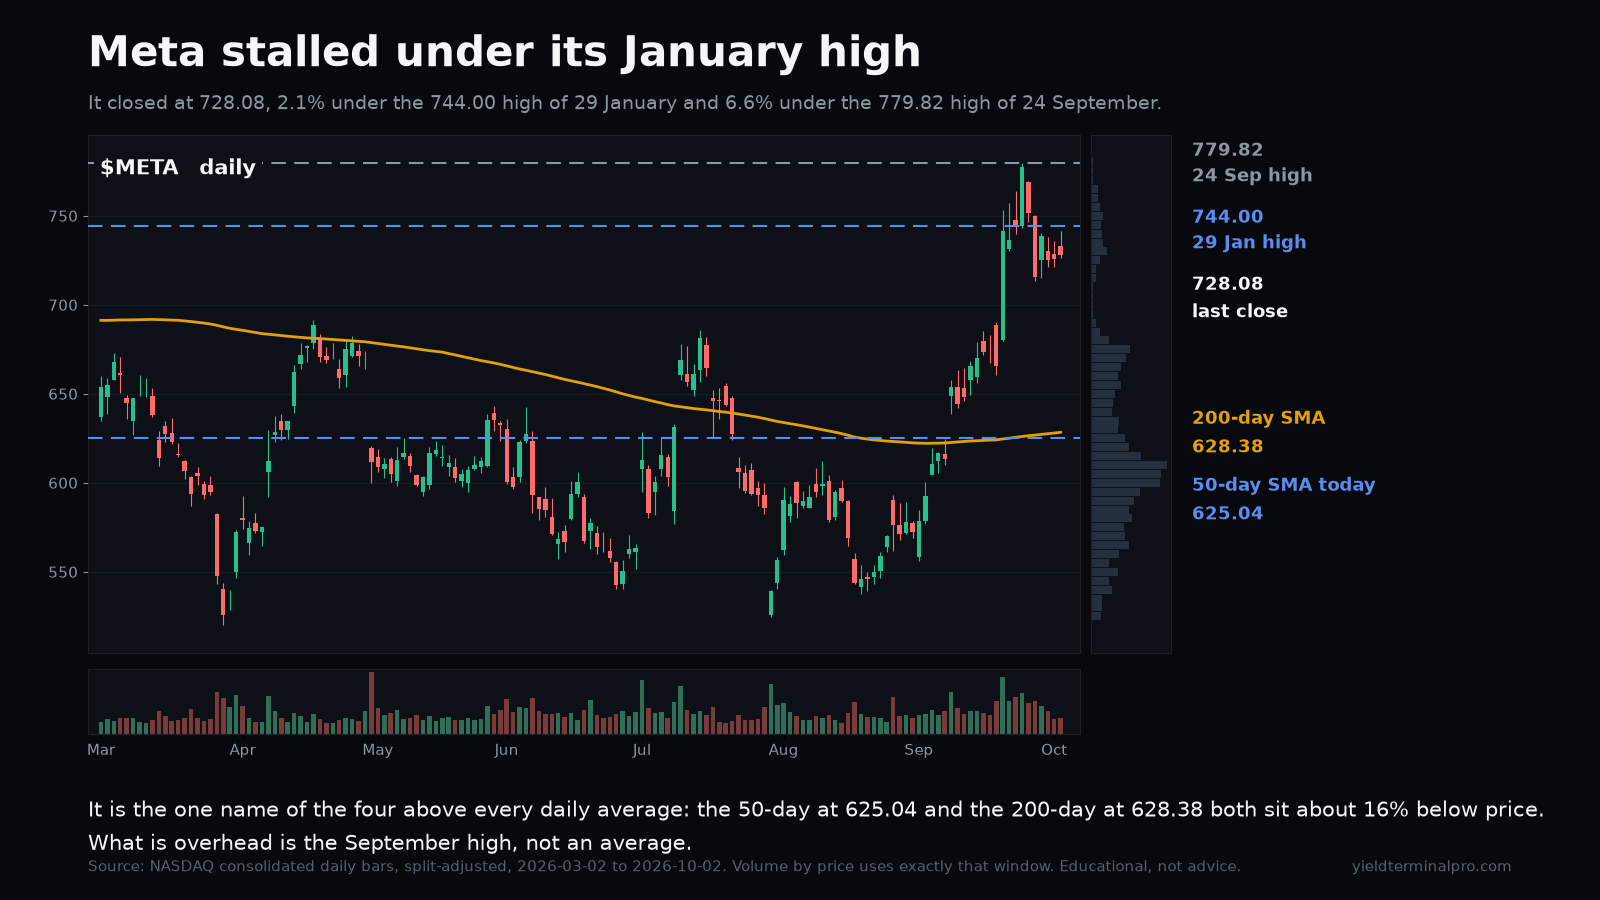
728.08 2 Oct close

Meta is the only one of these four trading above every daily average, and it stopped just under the 744.00 high of 29 January. What sits overhead is the September high, not a moving average.

AfterClosevs Sun, 4 Oct 2026 closevs published price
1 session741.90—+1.90%
5 sessions718.67—-1.29%
  • 29 January high 744.00 — published below, latest close below
  • 24 September high 779.82 — published below, latest close below
  • 50-day simple moving average 625.04 — published above, latest close above
  • 200-day simple moving average 628.38 — published above, latest close above
META chart published Sun, 4 Oct 2026

More on this name $META

See the full disclaimer.