Fri, 23 Oct 2026
704.84 October 23 recorded premarket observation
Separate October 23 premarket 704.84 versus completed October 22 close 704.47; daily bars remain completed through October 22.
No session has closed since this was published.

QQQ — October 23 Morning Watch — daily
Each note as it was published, with the price that followed. We publish where price sits against its own levels, not where it is going, so nothing here is scored as right or wrong. Educational commentary, not investment advice.
44 notes, newest first, back to Tue, 13 Oct 2026.
Every level we marked, and what price did next. Free, Sundays.
Subscribing signs you up for the free YieldTerminal Sunday recap, one email a week. Educational only, not financial advice. Unsubscribe any time.
704.84 October 23 recorded premarket observation
Separate October 23 premarket 704.84 versus completed October 22 close 704.47; daily bars remain completed through October 22.
No session has closed since this was published.
704.47 October 22 completed regular-session close
Completed closing decline October 6 to October 16, separate rebound to October 21, then a new lower close October 22. October 23 premarket is excluded.
No session has closed since this was published.

704.40 October 23 completed regular-session close
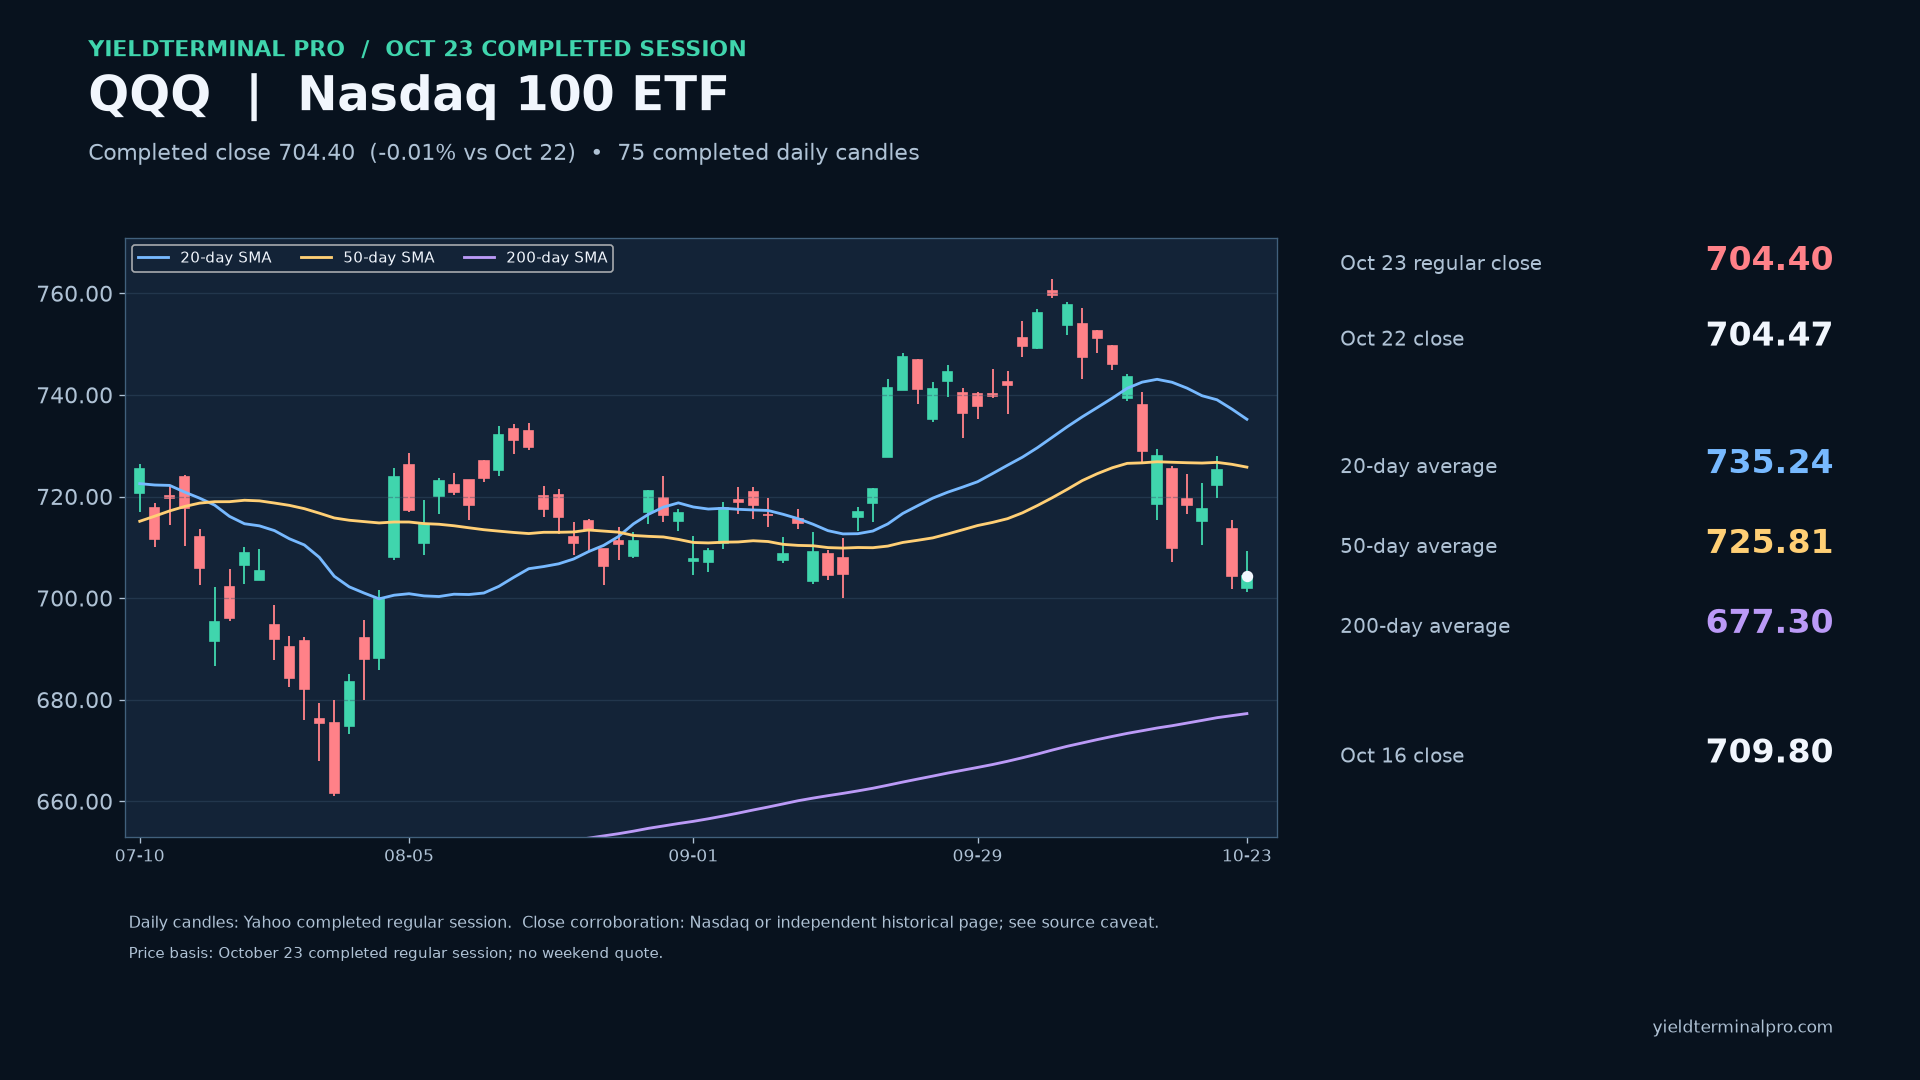
QQQ completed October 23 regular-session daily chart: close 704.40; 20-day SMA 735.24, 50-day SMA 725.81, 200-day SMA 677.30; October 23 intraday low 701.16; October 22 intraday low 701.90.
No session has closed since this was published.
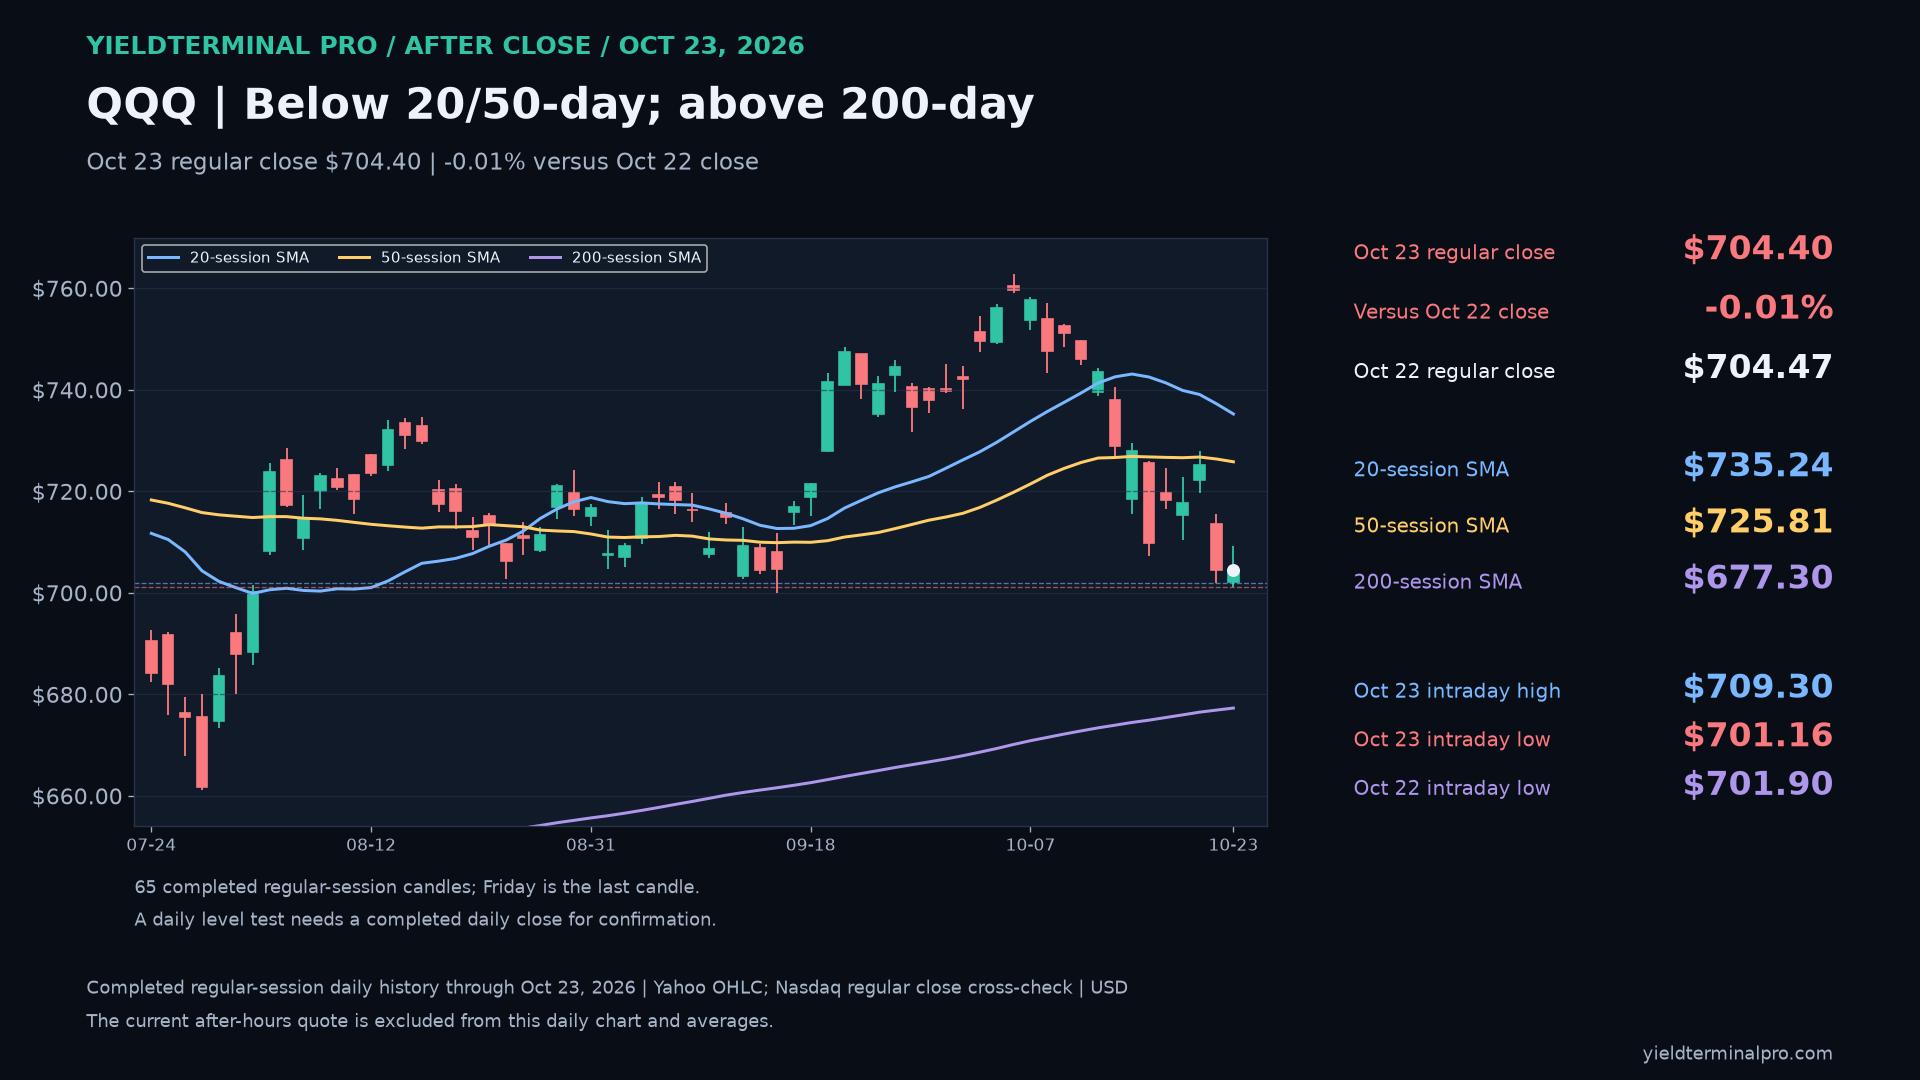
704.40 October 23 completed regular-session close; supporting price reference
QQQ closing-price decline from October 6 to October 16, a separate rebound through October 21, and renewed weakness through October 23; completed regular-session closes only.
No session has closed since this was published.
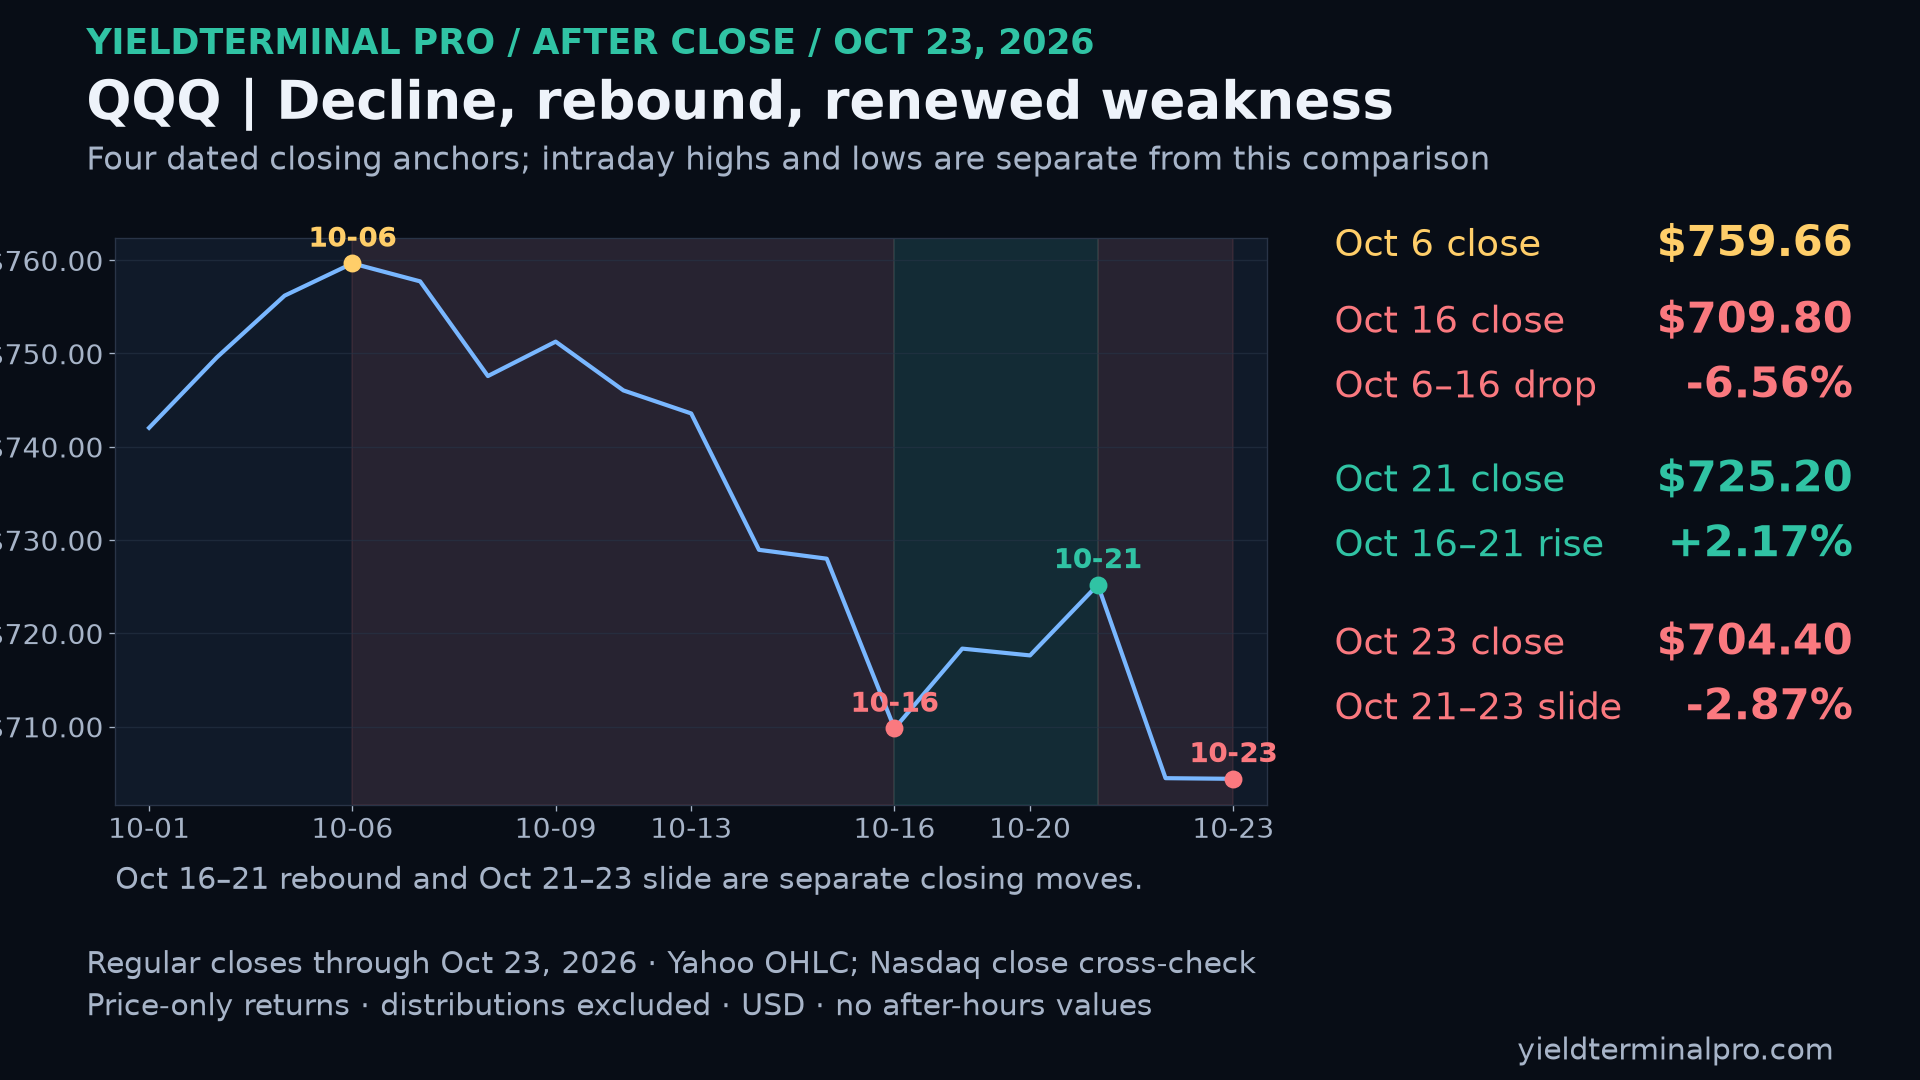
704.40 October 23 completed regular-session close
Completed October 23 regular-session close $704.40, below 20-day, below 50-day, above 200-day. Daily reclaim conditions are distinct from an intraday touch.
No session has closed since this was published.
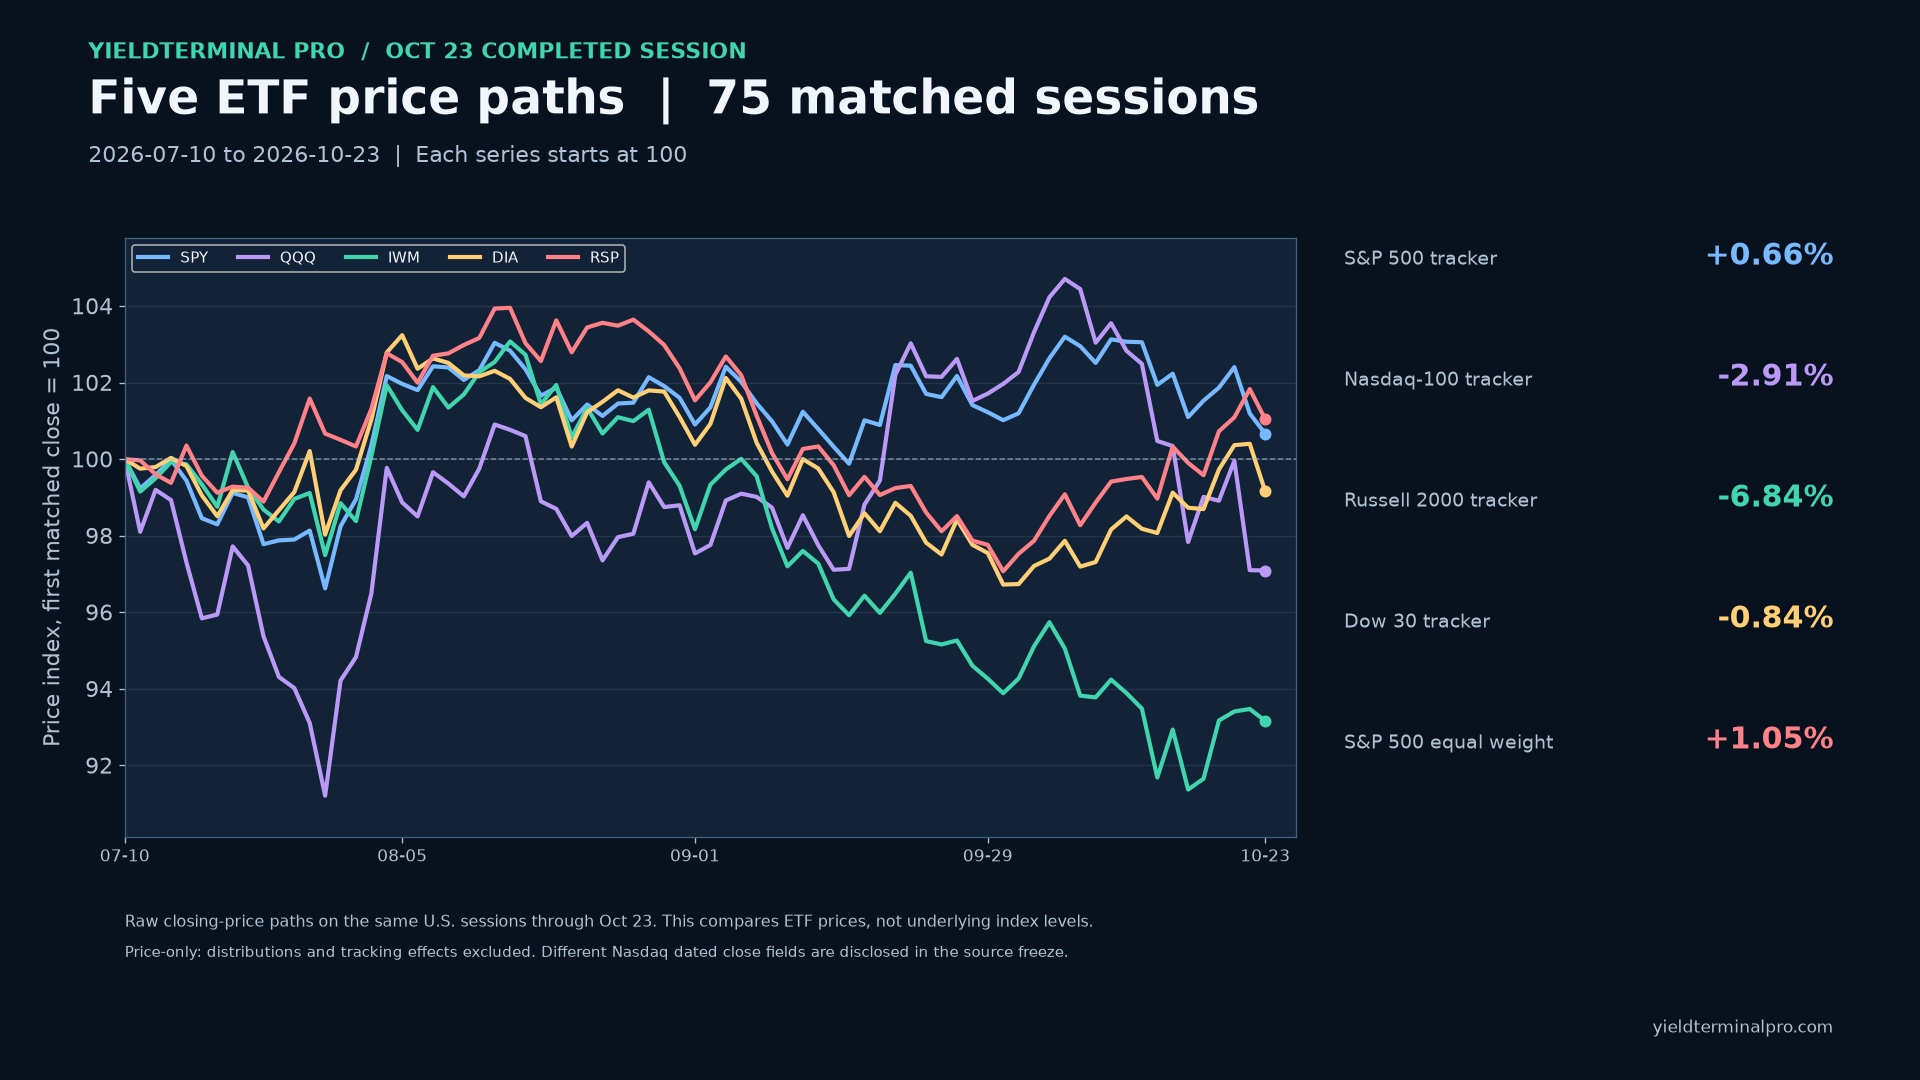
704.40 October 23 completed U.S. regular-session close
SPY, QQQ, IWM, DIA and RSP closing-price paths on 75 matched U.S. sessions through October 23, 2026, each indexed to 100 at the first close. Price-only comparison; distributions excluded.
No session has closed since this was published.
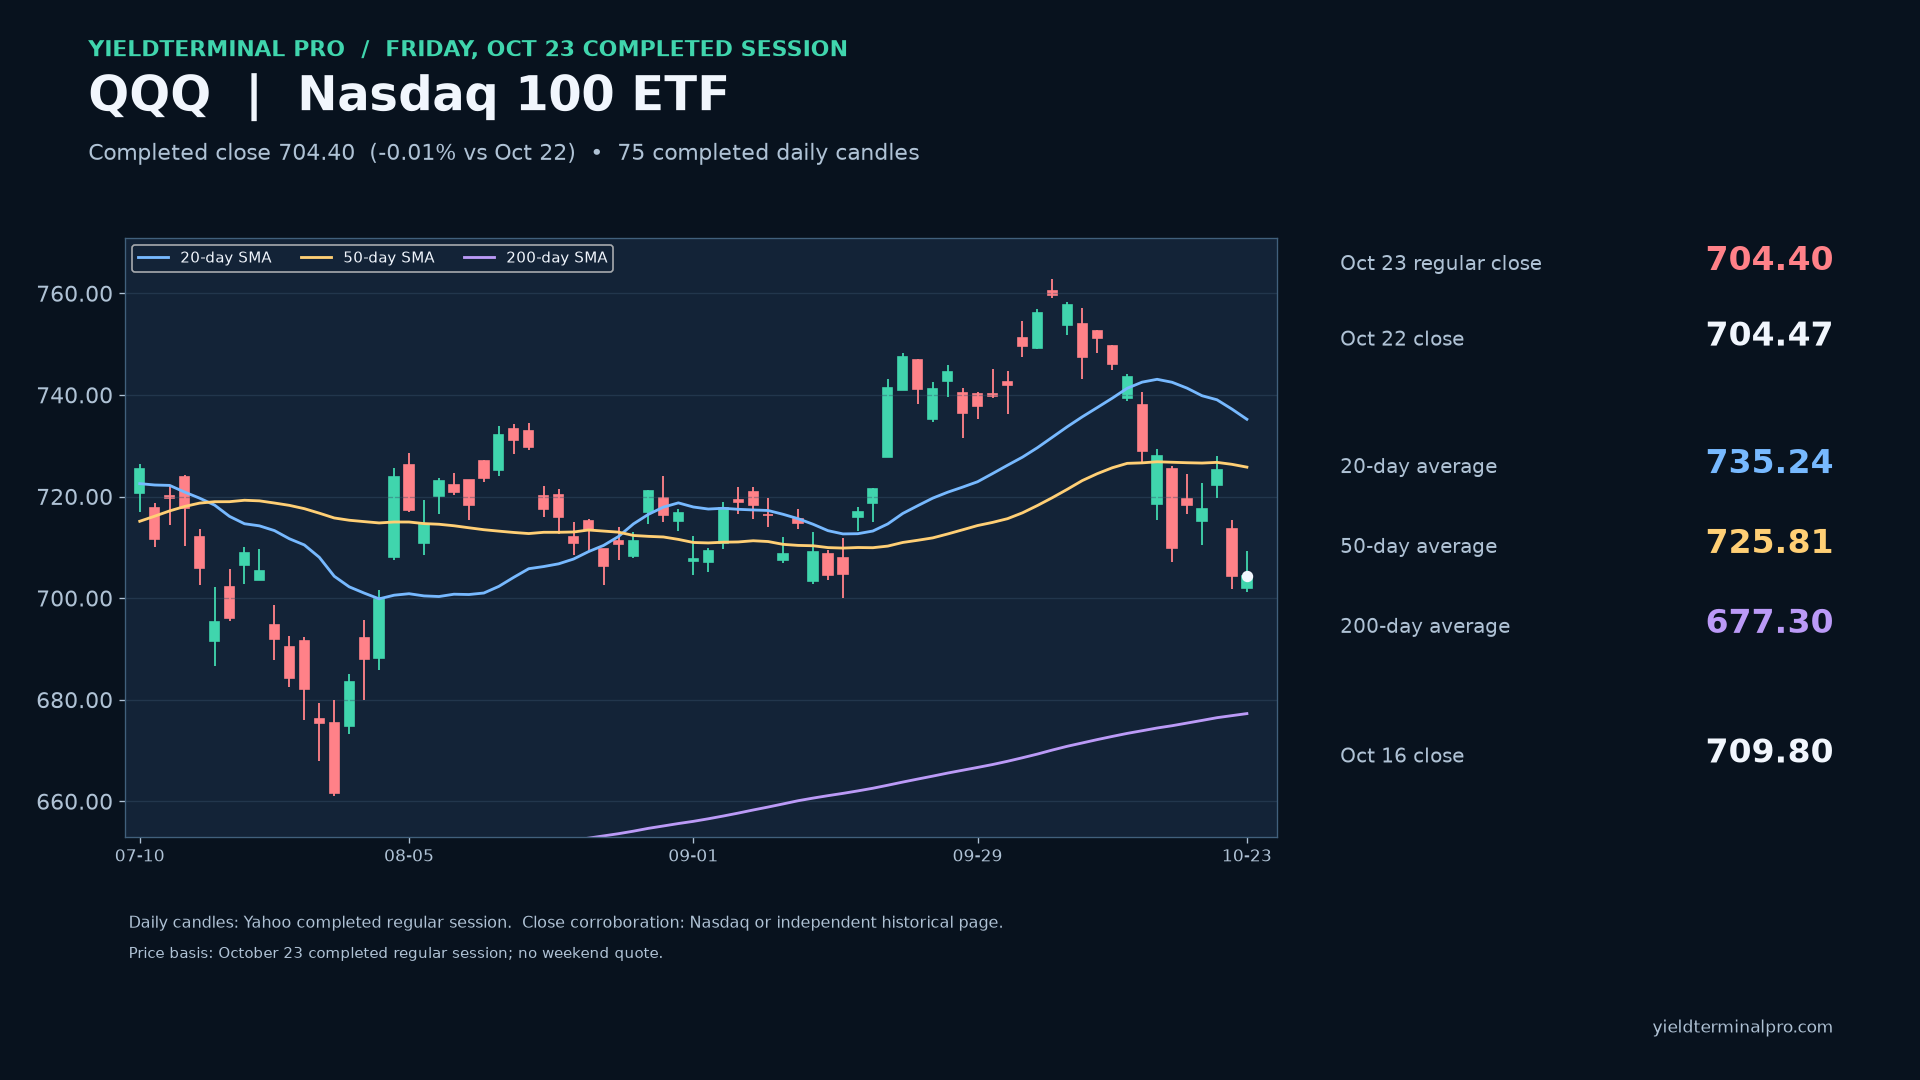
704.40 October 23 completed U.S. regular-session close
Nasdaq 100 ETF (QQQ) daily chart through October 23, 2026. Completed close 704.40, 20-day average 735.24, 50-day 725.81, 200-day 677.30.
No session has closed since this was published.
713.86 October 22 premarket observation
Separate October 22 premarket $713.86 (-1.56%) against completed October 21 daily references.
| After | Close | vs Thu, 22 Oct 2026 close | vs published price |
|---|---|---|---|
| 1 session | 704.40 | -0.01% | -1.33% |
This note was marked to a October 22 premarket observation, not a close. The like-for-like column is the one measured from the Thu, 22 Oct 2026 close.

725.20 October 21 completed regular-session close; supporting graphic retains its stated historical or financial period
Completed closing peak-to-subsequent-low decline and separate rebound through October 21; premarket observations are excluded.
| After | Close | vs Thu, 22 Oct 2026 close | vs published price |
|---|---|---|---|
| 1 session | 704.40 | — | -2.87% |

725.20 October 21 completed regular close in USD; chart values are indices rebased to 100, not dollar prices
Matched April 21-October 21 price-only returns: WMT -9.10%, COST -0.75%, QQQ +12.55%. Dividends excluded; relative performance does not establish valuation or future returns.
No session has closed since this was published.

704.47 October 22 completed regular-session close
QQQ: completed October 22 regular-session daily chart, close 704.47; 20-day SMA through October 22 737.24; 50-day SMA through October 22 726.37; 200-day SMA through October 22 676.89; October 21 intraday high 727.95; October 21 intraday low 719.71.
No session has closed since this was published.

704.47 October 22 completed regular-session close; supporting price reference
QQQ: full closing-price decline and any separately labeled rebound through October 22; completed regular-session closes only, excluding after-hours observations.
No session has closed since this was published.

704.47 October 22 completed regular-session close; supporting price reference
October 22 qualifying-watchlist top five gainers among 198 verified eligible records; CARR and AAL remain excluded pending reconciliation. These are not market-wide rankings.
No session has closed since this was published.

704.47 October 22 completed regular-session close; supporting price reference
October 22 qualifying-watchlist top five decliners among 198 verified eligible records; CARR and AAL remain excluded pending reconciliation. These are not market-wide rankings.
No session has closed since this was published.

719.02 October 21 premarket observation
Separate October 21 premarket $719.02 (+0.19%) against completed October 20 daily references.
No session has closed since this was published.

717.63 October 20 completed regular-session close; supporting chart uses its stated historical or financial period
Completed closing peak-to-subsequent-low decline and separate low-to-October 20 rebound; excludes October 21 premarket observations.
No session has closed since this was published.

Completed regular close $725.20, +1.05% versus October 20. 20-day SMA $739.07; 50-day SMA $726.75; 200-day SMA $676.49. October 21 high $727.95, low $719.72.
| After | Close | vs Wed, 21 Oct 2026 close | vs published price |
|---|---|---|---|
| 1 session | 704.47 | — | — |

Closing peak $759.66 (2026-10-06) to subsequent closing low $709.80 (2026-10-16): -6.56%. Separate low-to-October 21 regular-close rebound: +2.17% to $725.20.
| After | Close | vs Wed, 21 Oct 2026 close | vs published price |
|---|---|---|---|
| 1 session | 704.47 | — | — |

713.75 October 20 dated premarket observation / separate from completed daily candles
The dated October 20 premarket observation $713.75 was below Monday's $716.57 intraday low. The $724.55/$725.96 high cluster and $726.68 50-day average remain needed repair; a premarket crossing alone is not daily confirmation.
No session has closed since this was published.

718.36 October 19 completed regular-session close / separate historical context
The full closing-price decline from 2026-10-06 to 2026-10-16 was -6.56%; the separate low-to-October 19 closing rebound was +1.21%. The rebound does not erase the preceding decline.
No session has closed since this was published.

717.63 October 20 completed regular-session close
Completed regular close $717.63, -0.10%. 20-day SMA $739.87, 50-day $726.62, 200-day $675.95. A daily retest and close above a reclaimed level remains the confirmation rule.
No session has closed since this was published.

717.63 October 20 completed regular-session close
Full closing peak-to-subsequent-low decline -6.56%; separate low-to-October 20 rebound 1.10%. Closing extremes remain distinct from intraday extremes.
No session has closed since this was published.

717.41 October 19 premarket Morning Watch edition
The observed rebound remains below the October 16 high and 50-session average. October 13 retains an overhead gap at $744.20-$744.85; this is not a guaranteed destination.
No session has closed since this was published.

709.80 October 16 regular close as separate context; graphic uses a price index
QQQ benchmark over the same June 12–October 16 window as SPCX and RKLB; price changes exclude dividends.
No session has closed since this was published.

718.83 October 19 regular-session observation; not a completed daily close
$QQQ — $718.83, below the 50-day at $726.77. Key levels: Friday high $725.96, Friday low $707.23. 20-day: $742.52.
No session has closed since this was published.

718.36 October 19 completed regular-session close
The Qs rebounded but the session high did not reach Friday’s $725.96 high. The 50-day remains overhead. The October 6 closing peak to October 16 closing low decline was 6.56%; the separate low-to-October 19 rebound was 1.21%. Friday’s $709.80 close and $707.23 intraday low remain dated downside references.
No session has closed since this was published.

718.36 October 19 completed regular-session close
The October 6 closing peak to October 16 closing low decline was 6.56%; the separate rebound from that low to October 19 was 1.21%. Closing extremes are distinct from intraday extremes.
No session has closed since this was published.

709.80 October 16 regular close - Sunday chart review
QQQ - The weekly trend and the recent decline
No session has closed since this was published.

709.80 October 16 regular close - Sunday chart review
QQQ - The daily moving averages
No session has closed since this was published.

709.80 October 16 regular close - Sunday chart review
QQQ - Filled September gaps and surviving October gaps
No session has closed since this was published.

709.80 October 16 regular close - Sunday chart review
QQQ - The dated references below the close
No session has closed since this was published.

709.80 October 16 regular close - Sunday chart review
QQQ - What would repair the near-term chart?
No session has closed since this was published.

727.68 October 16 premarket - Morning Watch edition
The retained premarket mark is slightly above the 50-session average, with the September 28 low still overhead and the September 17 daily gap below.
| After | Close | vs Fri, 16 Oct 2026 close | vs published price |
|---|---|---|---|
| 1 session | 718.36 | +1.21% | -1.28% |
| 5 sessions | 704.40 | -0.76% | -3.20% |
This note was marked to a October 16 premarket - Morning Watch edition, not a close. The like-for-like column is the one measured from the Fri, 16 Oct 2026 close.

718.06 October 16 regular-session observation — incomplete session
Below the completed 50-session average, with the October 15 and August 11 lows still underneath the observed regular-session price.
| After | Close | vs Fri, 16 Oct 2026 close | vs published price |
|---|---|---|---|
| 1 session | 718.36 | — | +0.04% |
| 5 sessions | 704.40 | — | -1.90% |
This note was marked to a October 16 regular-session observation — incomplete session, not a close. The like-for-like column is the one measured from the Fri, 16 Oct 2026 close.

710.95 October 16 regular-session observation — incomplete session
QQQ has traded through the September gap; the gap and lost prior lows are potential reclaim levels.
| After | Close | vs Fri, 16 Oct 2026 close | vs published price |
|---|---|---|---|
| 1 session | 718.36 | — | +1.04% |
| 5 sessions | 704.40 | — | -0.92% |
This note was marked to a October 16 regular-session observation — incomplete session, not a close. The like-for-like column is the one measured from the Fri, 16 Oct 2026 close.

709.80 October 16 regular close · After Close
QQQ — Closed below the September gap
| After | Close | vs Fri, 16 Oct 2026 close | vs published price |
|---|---|---|---|
| 1 session | 718.36 | — | +1.21% |
| 5 sessions | 704.40 | — | -0.76% |

720.33 October 15 premarket observation 2026-10-15T08:35:08-04:00
QQQ: October 14 regular close $728.95; October 15 observed premarket $720.33 (-1.18%).
| After | Close | vs Thu, 15 Oct 2026 close | vs published price |
|---|---|---|---|
| 1 session | 709.80 | -2.50% | -1.46% |
| 5 sessions | 704.47 | -3.23% | -2.20% |
This note was marked to a October 15 premarket observation 2026-10-15T08:35:08-04:00, not a close. The like-for-like column is the one measured from the Thu, 15 Oct 2026 close.

728.00 October 15 completed regular close — After Close edition
Invesco QQQ Trust closed at $728.00 (-0.13% versus October 14). The closing chart compares the retained morning setup with the completed session and dated daily references.
| After | Close | vs Thu, 15 Oct 2026 close | vs published price |
|---|---|---|---|
| 1 session | 709.80 | — | -2.50% |
| 5 sessions | 704.47 | — | -3.23% |

735.63 10:12 a.m. ET regular-session observation
QQQ is -1.07% versus the October 13 regular close at this 10:12 a.m. ET observation.
| After | Close | vs Wed, 14 Oct 2026 close | vs published price |
|---|---|---|---|
| 1 session | 728.00 | -0.13% | -1.04% |
| 5 sessions | 725.20 | -0.51% | -1.42% |
This note was marked to a 10:12 a.m. ET regular-session observation, not a close. The like-for-like column is the one measured from the Wed, 14 Oct 2026 close.

735.63 10:12 a.m. ET regular-session observation
QQQ has lost the October 1 low intraday; the September 28 low is the next dated reference below.
| After | Close | vs Wed, 14 Oct 2026 close | vs published price |
|---|---|---|---|
| 1 session | 728.00 | -0.13% | -1.04% |
| 5 sessions | 725.20 | -0.51% | -1.42% |
This note was marked to a 10:12 a.m. ET regular-session observation, not a close. The like-for-like column is the one measured from the Wed, 14 Oct 2026 close.

728.95 October 14 regular-session close
QQQ closed at $728.95, -1.97% versus the October 13 regular close. The retained morning observation remains separate.
| After | Close | vs Wed, 14 Oct 2026 close | vs published price |
|---|---|---|---|
| 1 session | 728.00 | — | -0.13% |
| 5 sessions | 725.20 | — | -0.51% |

728.95 October 14 regular-session close
QQQ: -4.04% from the earlier closing peak to the subsequent closing low. The October 14 close is that subsequent low in the retained history; no later closing rebound has occurred.
| After | Close | vs Wed, 14 Oct 2026 close | vs published price |
|---|---|---|---|
| 1 session | 728.00 | — | -0.13% |
| 5 sessions | 725.20 | — | -0.51% |

743.57 October 13 regular-session close
QQQ closed at $743.57, below the October 12 intraday low at $744.85.
| After | Close | vs Tue, 13 Oct 2026 close | vs published price |
|---|---|---|---|
| 1 session | 728.95 | — | -1.97% |
| 5 sessions | 717.63 | — | -3.49% |

See the full disclaimer.