Fri, 16 Oct 2026
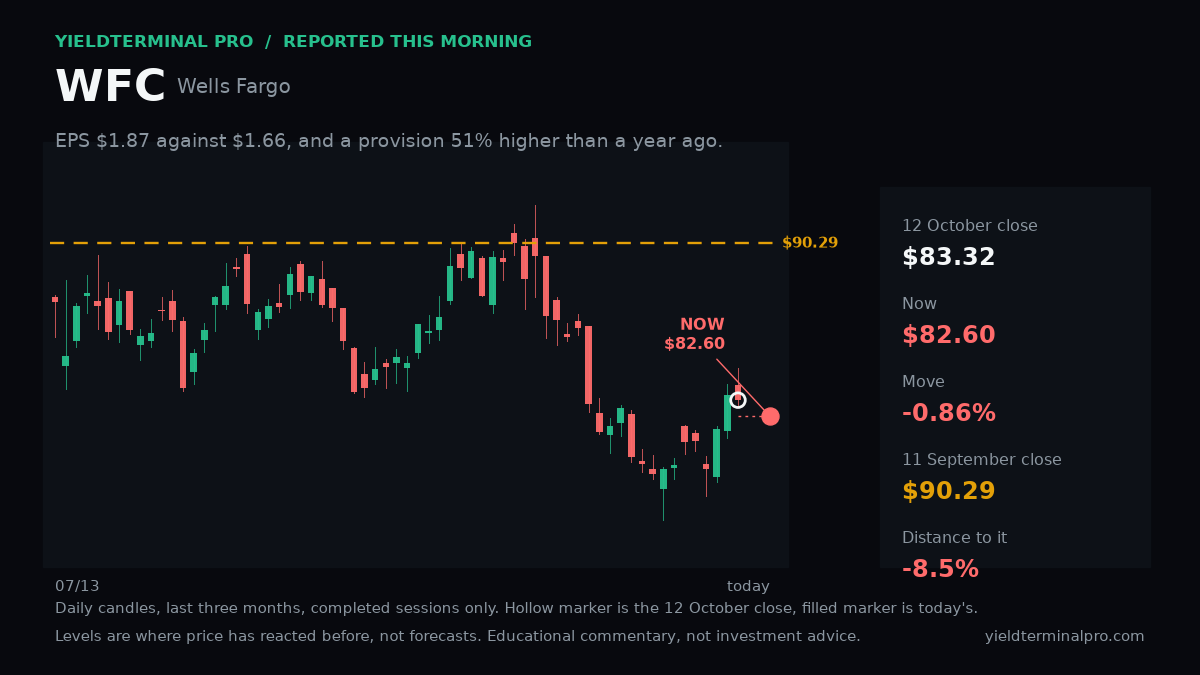
80.74 2026-10-13 regular close — historical earnings-day review
Retrospective earnings-day chart, 2026-10-13: All three averages above the close.
| After | Close | vs Fri, 16 Oct 2026 close | vs published price |
|---|---|---|---|
| 1 session | 81.80 | — | +1.31% |
| 5 sessions | 82.39 | — | +2.04% |
- 20-session SMA through 2026-10-13 82.58 — published below, latest close below
- 50-session SMA through 2026-10-13 85.55 — published below, latest close below
- 200-session SMA through 2026-10-13 84.35 — published below, latest close below
- Oct 13 high 83.43 — published below, latest close below
- Oct 13 low 80.31 — published above, latest close above
- 20-session high / 09-16 89.72 — published below, latest close below
- 20-session low / 10-01 78.00 — published above, latest close above