Daily Levels
One level, one chart, every morning
A short note on where price sits against a level that can be checked. Every level carries the window it was measured over, because the same stock measured over a different window gives a different number.
Educational commentary, not investment advice.
Fri, 2 Oct 2026
Prices marked to the 1 October close unless stated. Bitcoin is a live price; its daily bar was still open.
Five charts, one claim each. Three of them exist because checking a level against the bars contradicted the first draft: Qualcomm's "first level above" was the fourth, Bitcoin had been above its 200-day for six weeks rather than reclaiming it, and Netflix had closed above its 200-day twice, not never.
$AVGOBroadcom Inc.
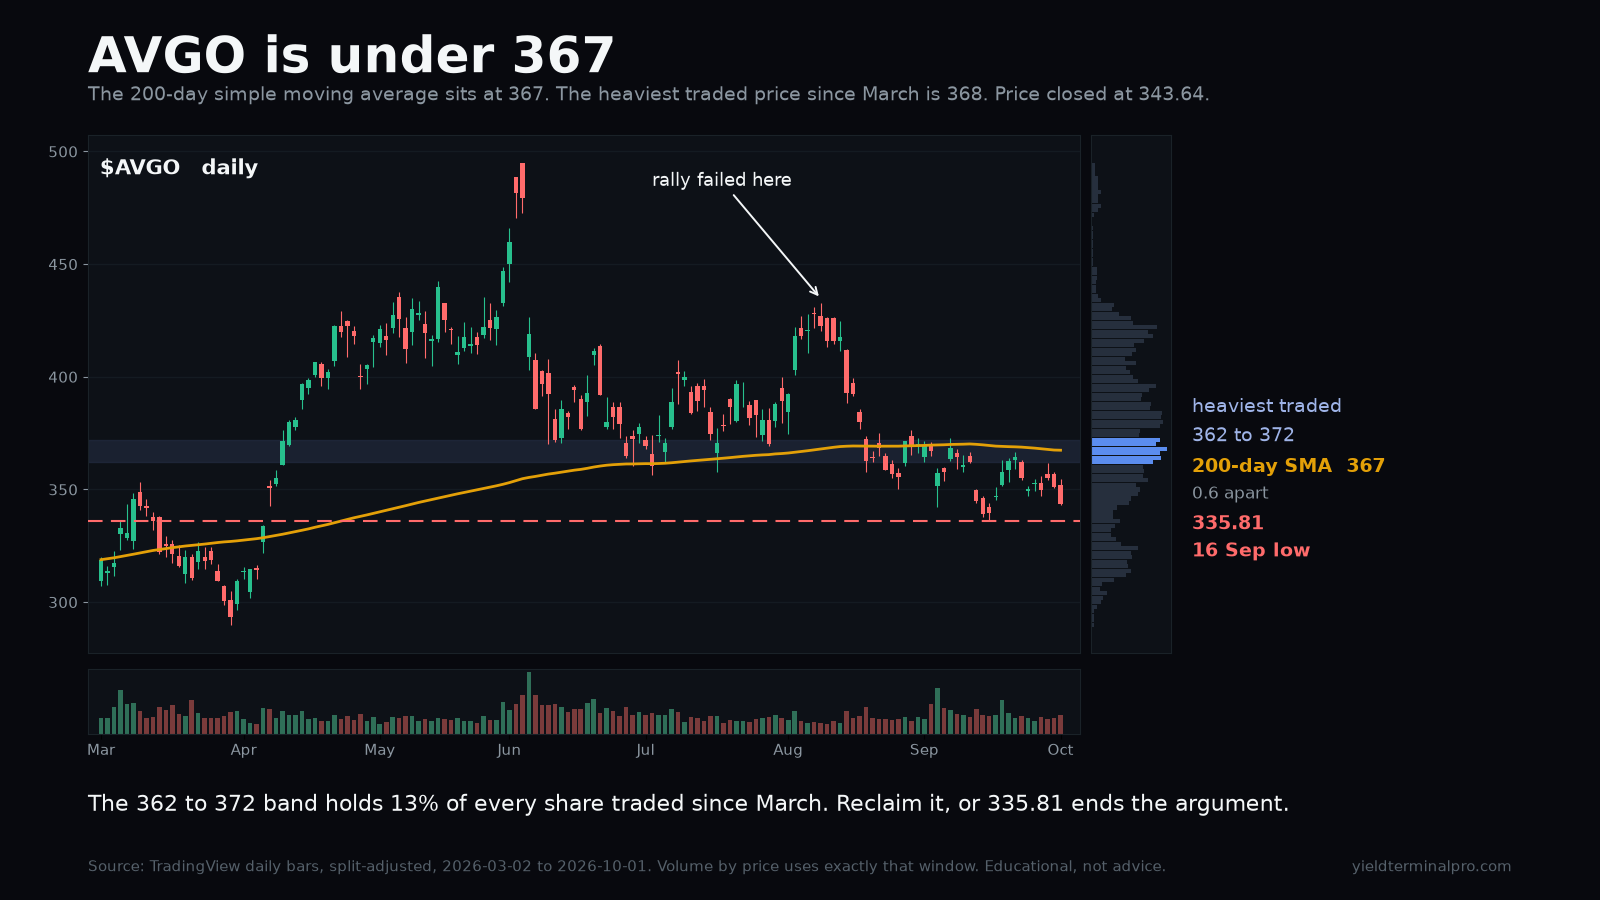
343.641 Oct closeTwo unrelated methods land on the same price. The 200-day simple moving average is 367 and the heaviest traded price since March is 368, 0.6 apart, and Broadcom closed under both.
- Heaviest traded band13% of the window's volume
- 362.00 to 372.00
- 200-day simple moving average
- 367.42
- 16 September lowthe level that ends the argument
- 335.81
Levels measured over 2 March to 1 October 2026. A level measured over a different window can be a different number.
 See the chart on X →
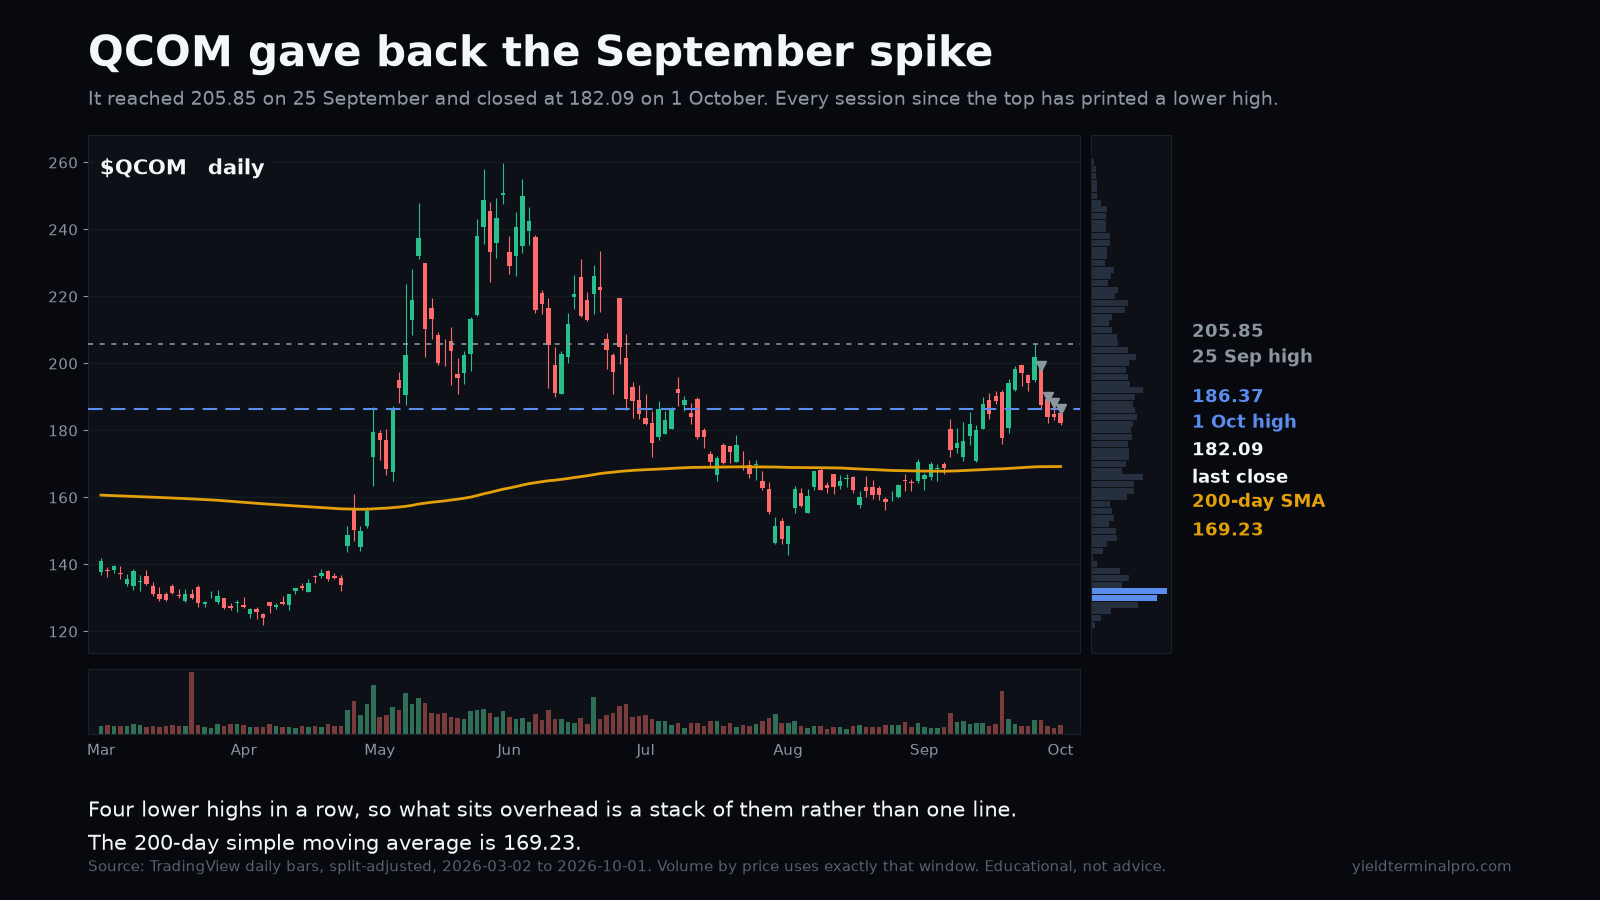
Qualcomm gave back the September spike in four sessions, and every one of them printed a lower high. What sits overhead is a stack of highs, not a single line to clear.
- 25 September highthe top
- 205.85
- 1 October highthe first level overhead
- 186.37
- 200-day simple moving average
- 169.23
Levels measured over 2 March to 1 October 2026. A level measured over a different window can be a different number.
 See the chart on X →
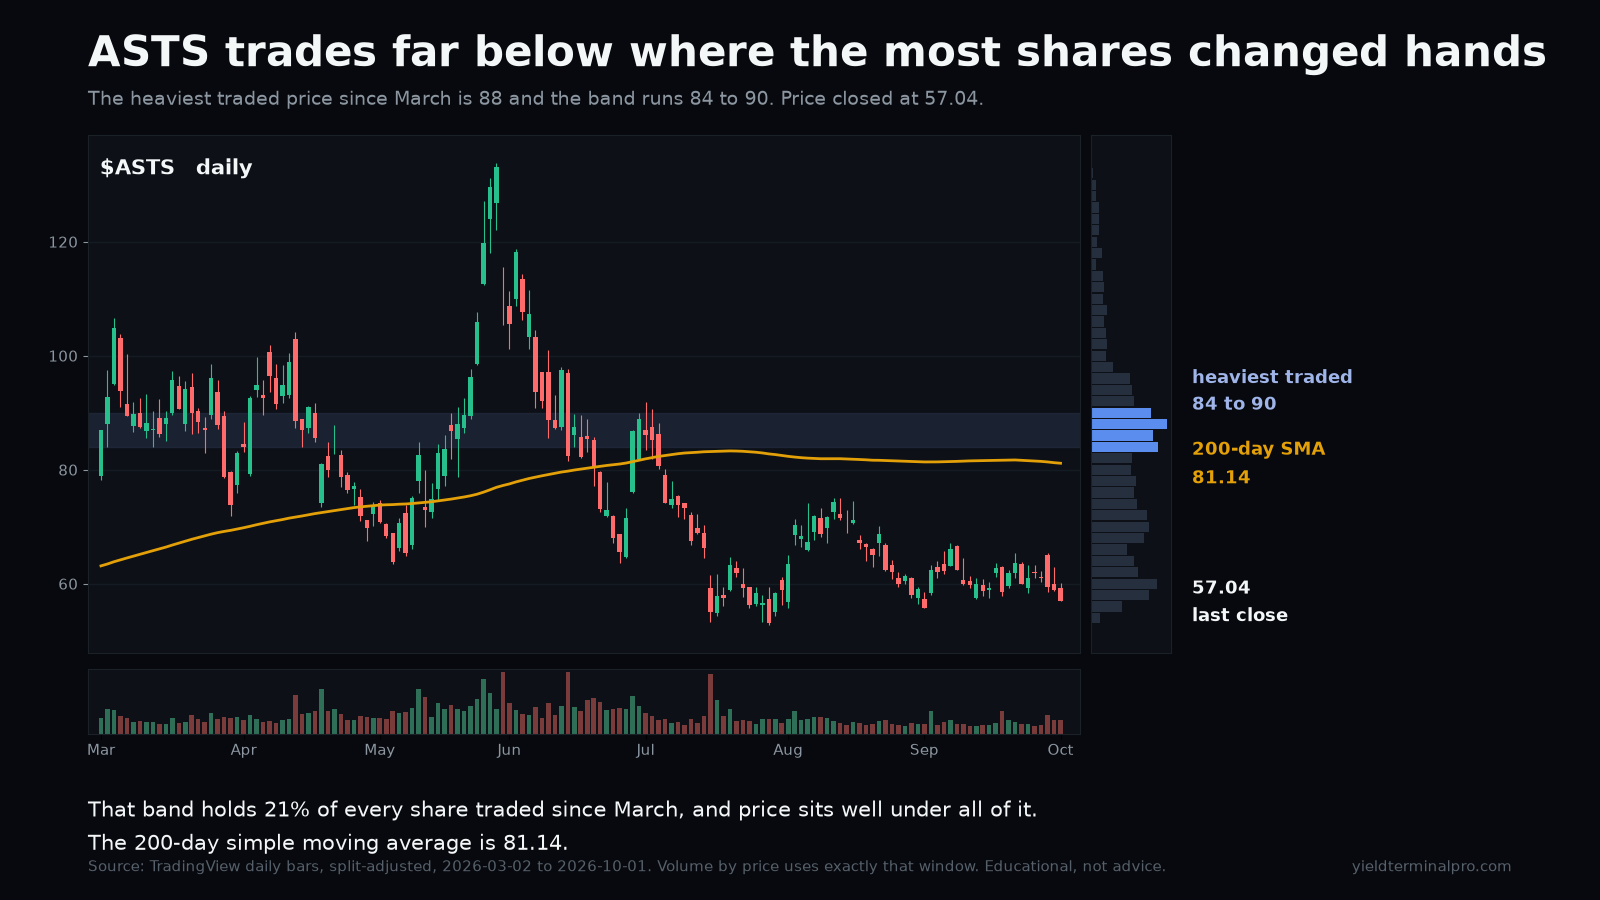
Every share that changed hands in the heaviest zone since March is above the current price. There is no comparable volume beneath it.
- Heaviest traded band21% of the window's volume, all above price
- 84.00 to 90.00
- 200-day simple moving average
- 81.14
Levels measured over 2 March to 1 October 2026. A level measured over a different window can be a different number.
 See the chart on X →
BTCBitcoin
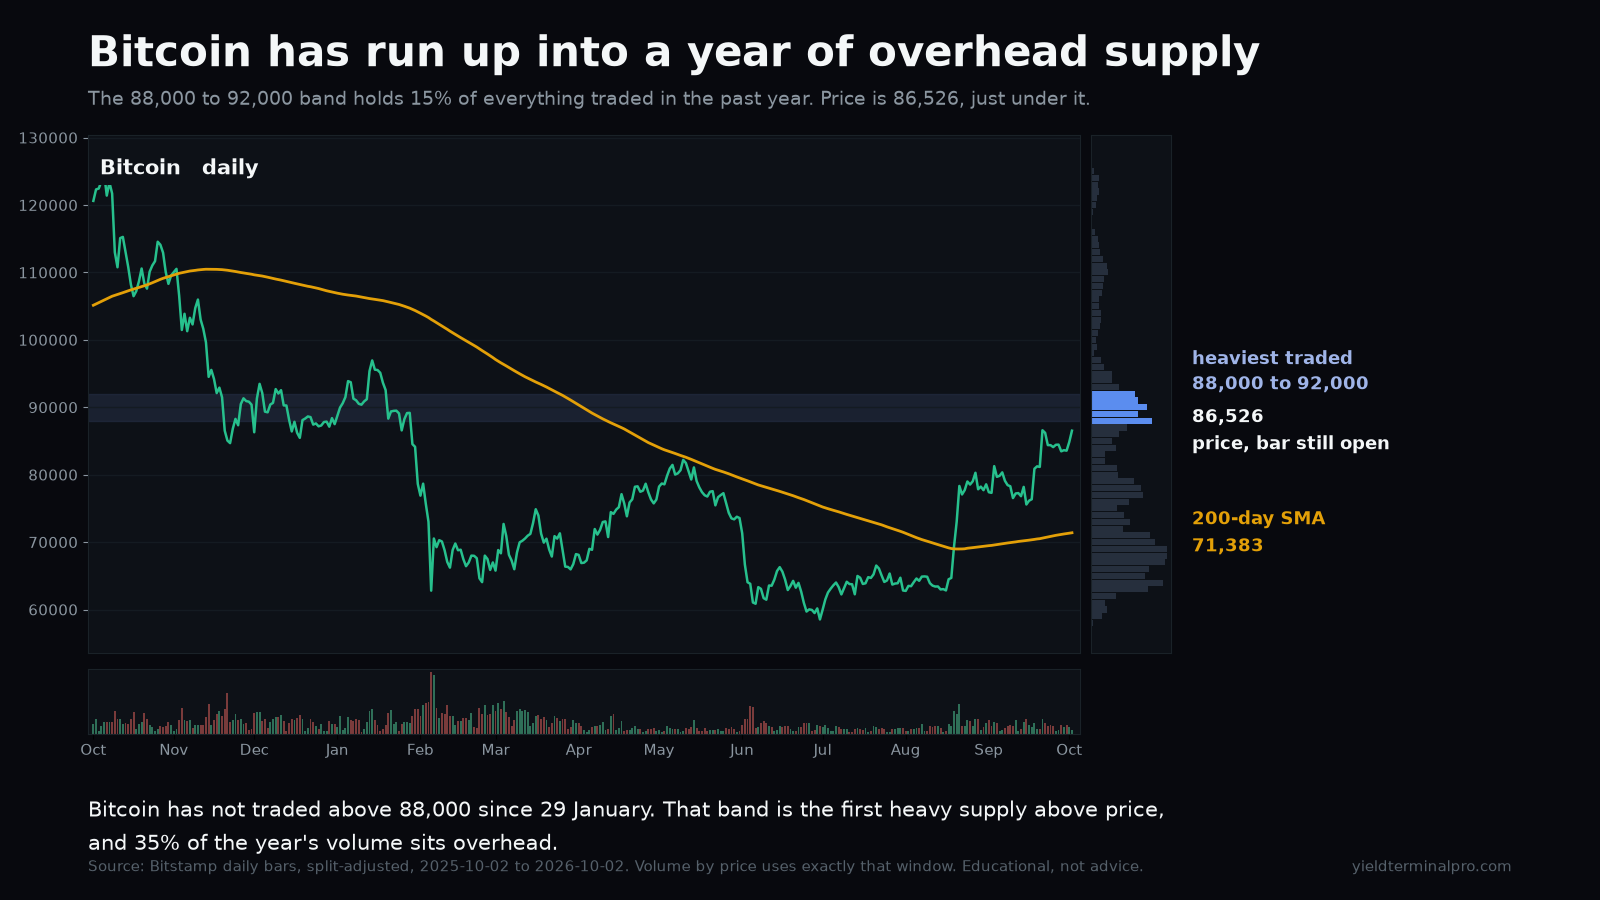
86,526live price, daily bar still openBitcoin has run up to the underside of the heaviest band of volume in a year. It has not traded above 88,000 since 29 January, and 35% of the year's volume sits above the current price.
- Heaviest band above price15% of the year's volume
- 88,000 to 92,000
- 200-day simple moving averagelast close below it was 18 August
- 71,383
- October 2025 high
- 126,272
Levels measured over 2 October 2025 to 2 October 2026, Bitstamp. A level measured over a different window can be a different number.
 See the chart on X →
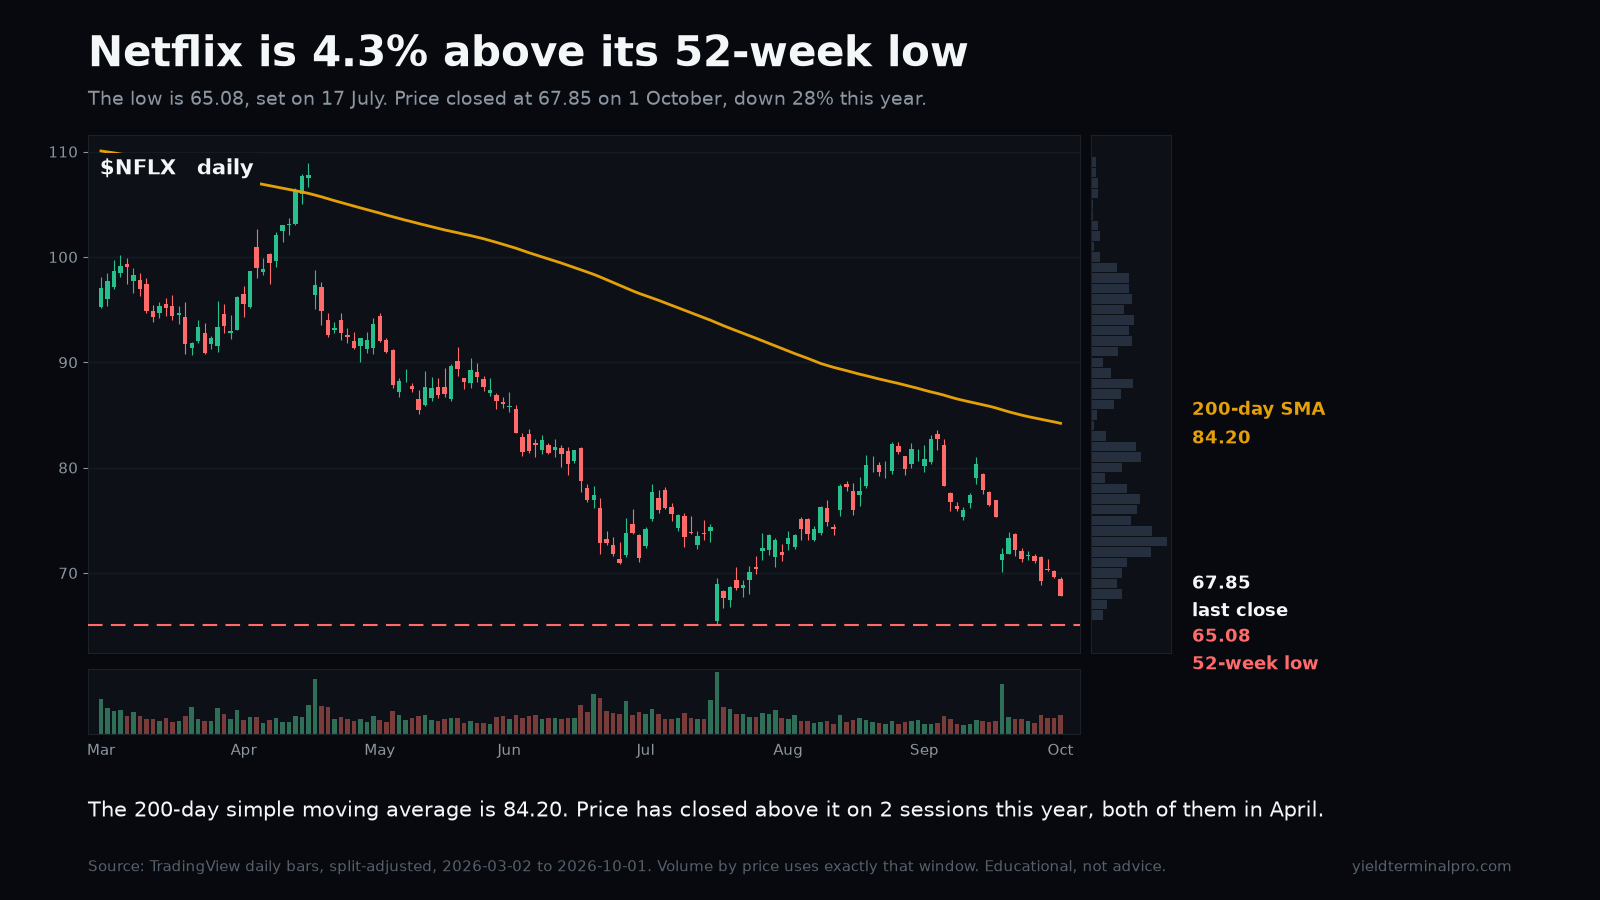
$NFLXNetflix, Inc.
67.851 Oct closeThe 200-day now sits above every high of the last 30 sessions, which makes the lift off July's low a move inside the downtrend rather than out of it.
- 200-day simple moving averageprice closed above it on 2 of 188 sessions this year, both in April
- 84.20
- Highest high, last 30 sessionsbelow the 200-day
- 83.60
- 52-week lowset 17 July; price is 4.3% above it
- 65.08
Levels measured over 2 March to 1 October 2026. A level measured over a different window can be a different number.
 See the chart on X →
Get the week in one email
Every level we marked, and whether price reached it. Free, Sundays.
Subscribing signs you up for the free YieldTerminal Sunday recap, one email a week. Educational only, not financial advice. Unsubscribe any time.
Want the whole write-up on one name? See the daily stock review.
See the full disclaimer.