← All daily levels

$WMT support and resistance levels, and what followed

WMT - October 22 WMT-daily

Each note as it was published, with the price that followed. We publish where price sits against its own levels, not where it is going, so nothing here is scored as right or wrong. Educational commentary, not investment advice.

6 notes, newest first, back to Tue, 6 Oct 2026.

Get the week in one email

Every level we marked, and what price did next. Free, Sundays.

Subscribing signs you up for the free YieldTerminal Sunday recap, one email a week. Educational only, not financial advice. Unsubscribe any time.

Thu, 22 Oct 2026

120.29 Recorded October 22 regular-session observation; separate from completed daily candles

Recorded October 22 observation $120.29 (+2.11%) was above all three completed averages and Wednesday high $118.16. An intraday reclaim is not completed daily confirmation.

AfterClosevs Thu, 22 Oct 2026 closevs published price
1 session119.89—-0.33%

This note was marked to a Recorded October 22 regular-session observation; separate from completed daily candles, not a close. The like-for-like column is the one measured from the Thu, 22 Oct 2026 close.

  • 20-session SMA through October 21 110.922 — published above, latest close above
  • 50-session SMA through October 21 109.244 — published above, latest close above
  • 200-session SMA through October 21 118.353 — published above, latest close above
  • October 21 intraday high 118.16 — published above, latest close above
  • October 21 intraday low 116.63 — published above, latest close above
  • 2026-10-15 gap through October 21 only 116.24 — published above, latest close above
WMT chart published Thu, 22 Oct 2026
Thu, 22 Oct 2026

117.80 October 21 completed regular close; price reference only, chart shows financial results

Walmart July 31 fiscal Q2 and Costco 16-week August 30 fiscal Q4 are different reporting windows. GAAP and adjusted EPS retain their definitions; absolute EPS does not rank the businesses.

AfterClosevs Thu, 22 Oct 2026 closevs published price
1 session119.89—+1.77%
WMT chart published Thu, 22 Oct 2026
Thu, 22 Oct 2026

117.80 October 21 completed regular close; price reference only, chart shows financial cash windows

Walmart six-month company-defined cash measures and Costco audited 52-week cash arithmetic are shown separately. Do not annualize Walmart or declare a cash winner from unequal windows.

AfterClosevs Thu, 22 Oct 2026 closevs published price
1 session119.89—+1.77%
WMT chart published Thu, 22 Oct 2026
Thu, 22 Oct 2026

117.80 October 21 completed regular close in USD; chart values are indices rebased to 100, not dollar prices

Matched April 21-October 21 price-only returns: WMT -9.10%, COST -0.75%, QQQ +12.55%. Dividends excluded; relative performance does not establish valuation or future returns.

AfterClosevs Thu, 22 Oct 2026 closevs published price
1 session119.89—+1.77%
WMT chart published Thu, 22 Oct 2026
Tue, 20 Oct 2026

118.71 October 20 regular-session observation / separate from daily candles

$WMT $118.71, above the 50-day ($109.05). 200-day: $118.30. Oct 19 high/low: $119.28/$118.05.

AfterClosevs Tue, 20 Oct 2026 closevs published price
1 session117.80—-0.77%

This note was marked to a October 20 regular-session observation / separate from daily candles, not a close. The like-for-like column is the one measured from the Tue, 20 Oct 2026 close.

  • October 19 regular close 118.70 — published above, latest close above
  • 20-session SMA through October 19 110.17 — published above, latest close above
  • 50-session SMA through October 19 109.05 — published above, latest close above
  • 200-session SMA through October 19 118.30 — published above, latest close above
  • Oct 19 intraday high 119.28 — published below, latest close abovecrossed
  • Oct 19 intraday low 118.05 — published above, latest close above
  • 2026-10-15 daily gap $116.24 to $117.75 116.24 — published above, latest close above
WMT chart published Tue, 20 Oct 2026
Tue, 6 Oct 2026

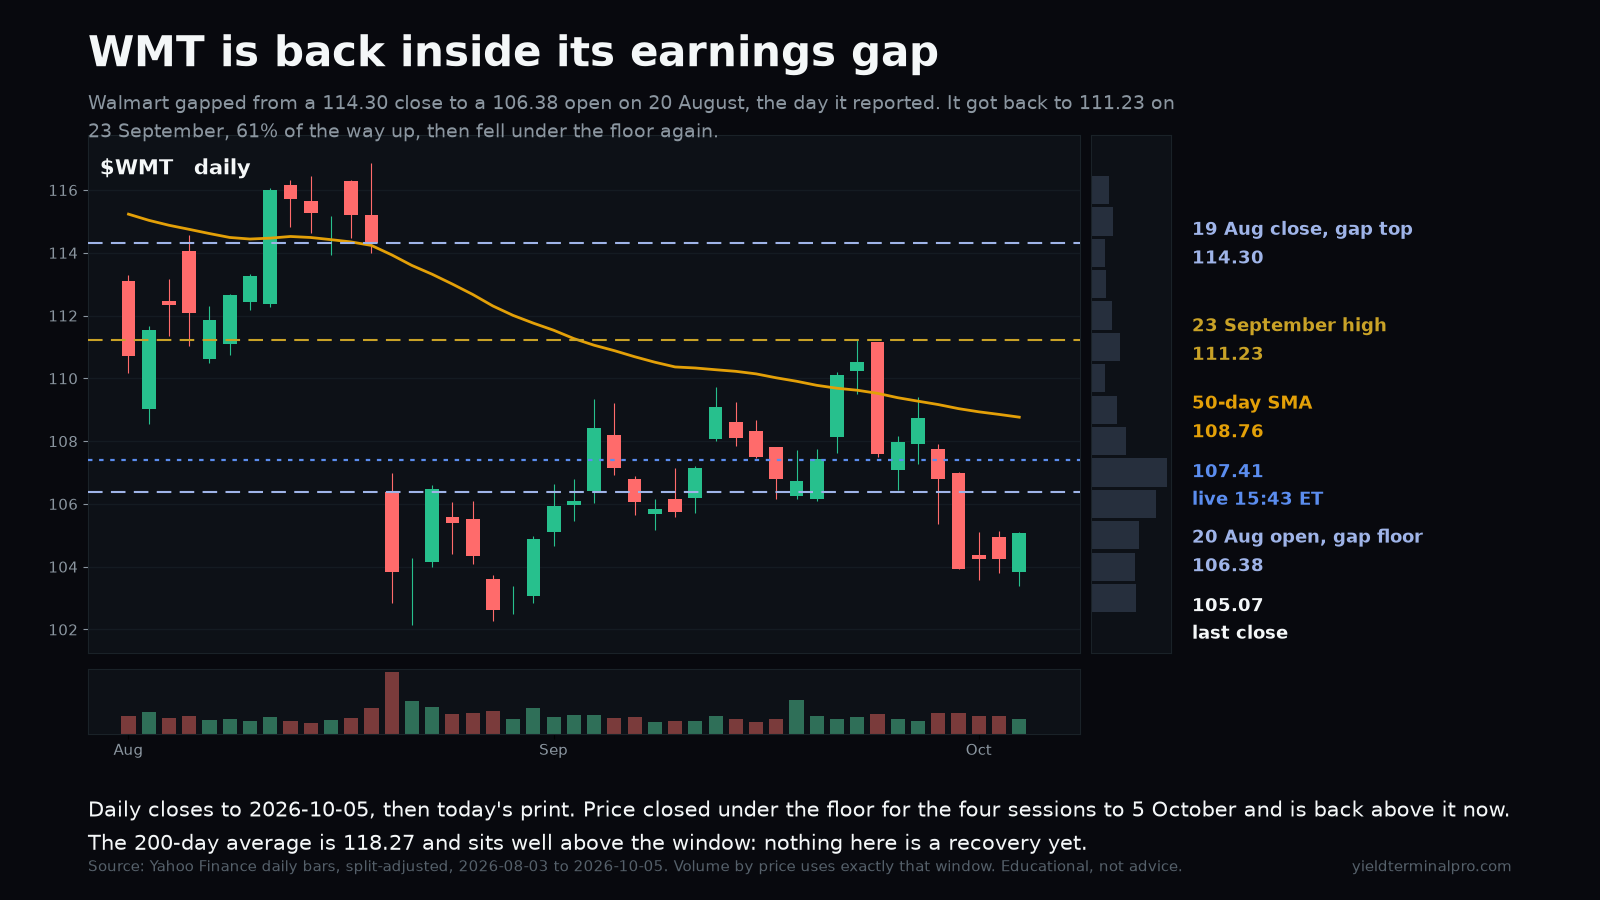
107.41 live session print, 15:43 ET, 6 October 2026

WMT is trading at 107.41, back inside the gap its 20 August earnings report opened. The one push into that gap's upper half reached 111.23 on 23 September and failed 3.07 short of closing it.

AfterClosevs Tue, 6 Oct 2026 closevs published price
1 session108.16+0.90%+0.70%
5 sessions112.28+4.74%+4.53%

This note was marked to a live session print, 15:43 ET, 6 October 2026, not a close. The like-for-like column is the one measured from the Tue, 6 Oct 2026 close.

  • 23 September high 111.23 — published below, latest close abovecrossed
  • 20 August open (gap floor) 106.38 — published above, latest close above
  • 50-day simple moving average 108.76 — published below, latest close abovecrossed
  • 200-day simple moving average 118.27 — published below, latest close abovecrossed
WMT chart published Tue, 6 Oct 2026

More on this name $WMT

See the full disclaimer.