← All daily levels$TSLA support and resistance levels, and what followed
Tesla, Inc. — October 23 earnings review
Each note as it was published, with the price that followed. We publish where price sits against its own levels, not where it is going, so nothing here is scored as right or wrong. Educational commentary, not investment advice.
20 notes, newest first, back to Sat, 3 Oct 2026.
Get the week in one email
Every level we marked, and what price did next. Free, Sundays.
Subscribing signs you up for the free YieldTerminal Sunday recap, one email a week. Educational only, not financial advice. Unsubscribe any time.
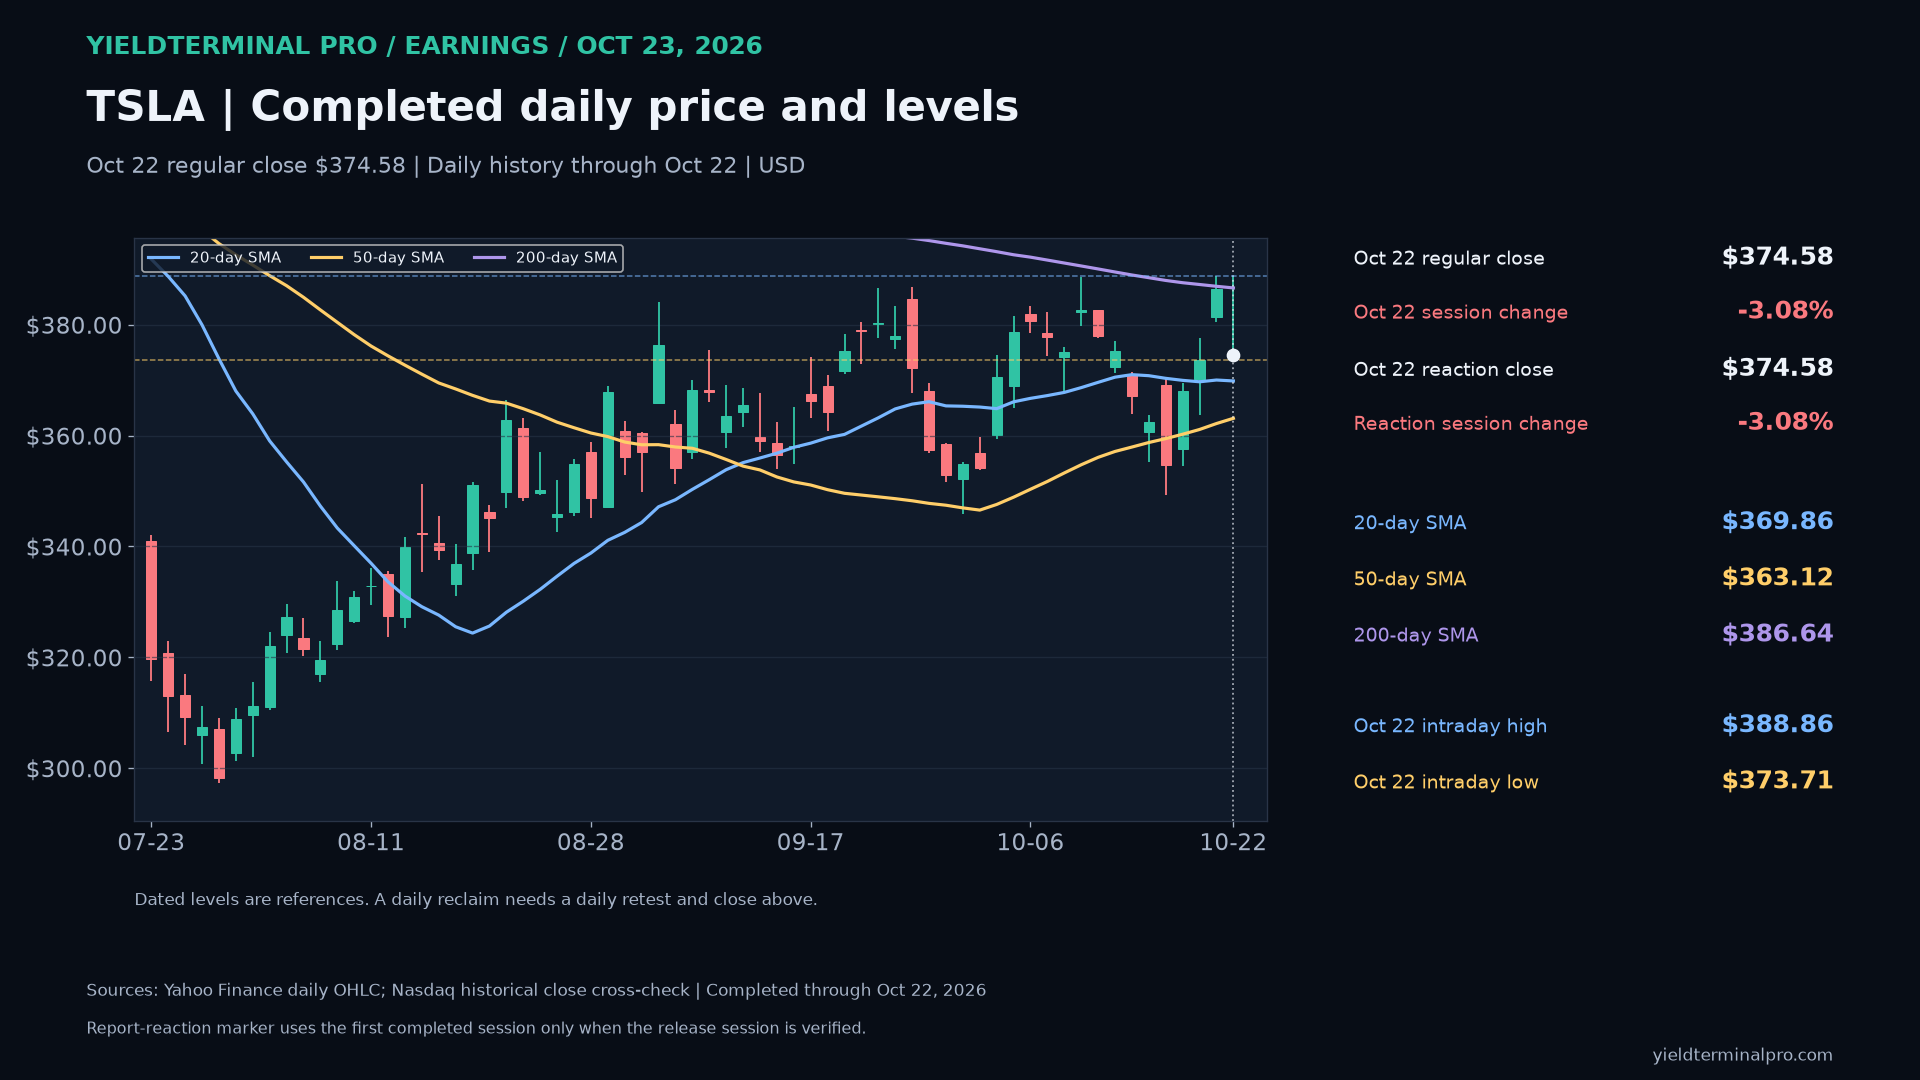
TSLA closed October 22 at $374.58, above its 50-day average ($363.12) and below its 200-day average ($386.64). The October 22 high ($388.86) and low ($373.71) are dated reference levels. This is completed daily history, not an October 23 quote.
No session has closed since this was published.
Separate October 22 premarket $372.01 (-3.74%) against completed October 21 daily references.
| After | Close | vs Thu, 22 Oct 2026 close | vs published price |
|---|
| 1 session | 372.22 | -0.63% | +0.06% |
This note was marked to a October 22 premarket observation, not a close. The like-for-like column is the one measured from the Thu, 22 Oct 2026 close.
- October 21 intraday high 388.84 — published below, latest close below
- October 21 intraday low 380.51 — published below, latest close below
- 20-day SMA through October 21 370.03 — published above, latest close above
- 50-day SMA through October 21 362.18 — published above, latest close above
- 200-day SMA through October 21 386.94 — published below, latest close below

Thu, 22 Oct 2026386.47 October 21 completed regular-session close; supporting graphic retains its stated historical or financial period
Quarterly financial results reported October 21; GAAP, issuer-adjusted measures, cash flows and forecasts retain their stated scopes.
| After | Close | vs Thu, 22 Oct 2026 close | vs published price |
|---|
| 1 session | 372.22 | — | -3.69% |

TSLA: completed October 22 regular-session daily chart, close 374.58; 20-day SMA through October 22 369.86; 50-day SMA through October 22 363.12; 200-day SMA through October 22 386.64; October 21 intraday high 388.84; October 21 intraday low 380.51.
| After | Close | vs Thu, 22 Oct 2026 close | vs published price |
|---|
| 1 session | 372.22 | — | -0.63% |
- 20-day SMA through October 22 369.86 — published above, latest close above
- 50-day SMA through October 22 363.12 — published above, latest close above
- 200-day SMA through October 22 386.64 — published below, latest close below
- October 21 intraday high 388.84 — published below, latest close below
- October 21 intraday low 380.51 — published below, latest close below

Separate October 21 premarket $378.02 (+1.15%) against completed October 20 daily references.
| After | Close | vs Wed, 21 Oct 2026 close | vs published price |
|---|
| 1 session | 374.58 | -3.08% | -0.91% |
This note was marked to a October 21 premarket observation, not a close. The like-for-like column is the one measured from the Wed, 21 Oct 2026 close.
- October 20 high 377.59 — published above, latest close belowcrossed
- October 20 low 363.64 — published above, latest close above
- 20-day SMA through October 20 369.712 — published above, latest close above
- 50-day SMA through October 20 361.108 — published above, latest close above
- 200-day SMA through October 20 387.261 — published below, latest close below

Completed regular close $386.47, +3.41% versus October 20. 20-day SMA $370.03; 50-day SMA $362.18; 200-day SMA $386.94. October 21 high $388.84, low $380.51.
| After | Close | vs Wed, 21 Oct 2026 close | vs published price |
|---|
| 1 session | 374.58 | — | — |

Separate recorded October 21 after-hours observation $392.75, +1.62% versus completed regular close $386.47. Provisional observation, not another daily candle or confirmed daily reclaim.
| After | Close | vs Wed, 21 Oct 2026 close | vs published price |
|---|
| 1 session | 374.58 | — | — |

Quarter ended September 30, 2026: revenue $28.05B, essentially flat year over year; GAAP operating income $0.72B (-56%); operating margin 2.60%; GAAP diluted EPS $0.22, non-GAAP $0.48. Quarterly GAAP operating cash flow $6.26B less capital expenditures $4.73B leaves company non-GAAP free cash flow $1.53B (-62%). GAAP and non-GAAP earnings are distinct.
| After | Close | vs Wed, 21 Oct 2026 close | vs published price |
|---|
| 1 session | 374.58 | — | — |

Tue, 20 Oct 2026367.74 October 20 dated premarket observation / separate from completed daily candles
The dated October 20 premarket observation $367.74 was above the $360.25 50-day but below the $369.97 20-day and $387.58 200-day. Recovering the area around $370.00 requires daily confirmation; earnings remain ahead on October 21.
| After | Close | vs Tue, 20 Oct 2026 close | vs published price |
|---|
| 1 session | 386.47 | +3.41% | +5.09% |
This note was marked to a October 20 dated premarket observation / separate from completed daily candles, not a close. The like-for-like column is the one measured from the Tue, 20 Oct 2026 close.
- 20-session SMA through October 19 369.97 — published below, latest close abovecrossed
- 50-session SMA through October 19 360.25 — published above, latest close above
- 200-session SMA through October 19 387.58 — published below, latest close below
- Oct 19 intraday high 369.58 — published below, latest close abovecrossed
- Oct 19 intraday low 354.47 — published above, latest close above
- Oct 16 intraday low 349.33 — published above, latest close above

Completed regular close $373.71, +1.54%. 20-day SMA $369.71, 50-day $361.11, 200-day $387.26. A daily retest and close above a reclaimed level remains the confirmation rule.
| After | Close | vs Tue, 20 Oct 2026 close | vs published price |
|---|
| 1 session | 386.47 | — | +3.41% |
- 20-session SMA 369.71 — published above, latest close above
- 50-session SMA 361.11 — published above, latest close above
- 200-session SMA 387.26 — published below, latest close below
- Oct 20 intraday high 377.59 — published below, latest close below
- Oct 20 intraday low 363.64 — published above, latest close above
- Oct 19 intraday high 369.58 — published above, latest close above

Premarket remains below the 50-, 20- and 200-session averages. October 21 after-close earnings remain upcoming.
| After | Close | vs Mon, 19 Oct 2026 close | vs published price |
|---|
| 1 session | 373.71 | +1.54% | +5.75% |
This note was marked to a October 19 premarket Morning Watch edition, not a close. The like-for-like column is the one measured from the Mon, 19 Oct 2026 close.
- October 16 regular close 354.72 — published below, latest close abovecrossed
- 20-session SMA 370.33 — published below, latest close abovecrossed
- 50-session SMA 359.46 — published below, latest close abovecrossed
- 200-session SMA 387.99 — published below, latest close below
- October 16 intraday high 370.50 — published below, latest close abovecrossed
- October 16 intraday low 349.33 — published above, latest close above

Mon, 19 Oct 2026354.72 October 16 completed regular close; October 19 research edition
Dated completed-close price context, moving averages and separate retained decline/rebound.
| After | Close | vs Mon, 19 Oct 2026 close | vs published price |
|---|
| 1 session | 373.71 | — | +5.35% |
- 20-session SMA through October 16 370.33 — published below, latest close abovecrossed
- 50-session SMA through October 16 359.46 — published below, latest close abovecrossed
- 200-session SMA through October 16 387.99 — published below, latest close below
- October 16 intraday low 349.33 — published above, latest close above

Tesla Q2 operating results and the separately identified SpaceX unrealized investment gain.
| After | Close | vs Mon, 19 Oct 2026 close | vs published price |
|---|
| 1 session | 373.71 | — | +5.35% |

Tesla quarterly and first-half cash measures, the separately classified SpaceX purchase and upcoming Q3 reporting checkpoint.
| After | Close | vs Mon, 19 Oct 2026 close | vs published price |
|---|
| 1 session | 373.71 | — | +5.35% |

Tesla reclaimed the 50-day but remained below the 20-day and Friday’s $370.50 high. This is an initial reclaim; a later daily test and close above the recovered average would strengthen the case. Friday’s $349.33 intraday low remains a dated failure reference. Results remain upcoming after the close on October 21.
| After | Close | vs Mon, 19 Oct 2026 close | vs published price |
|---|
| 1 session | 373.71 | — | +1.54% |
- October 19 regular close 368.06 — published below, latest close abovecrossed
- October 16 regular close 354.72 — published above, latest close above
- 20-session SMA through October 19 369.97 — published below, latest close abovecrossed
- 50-session SMA through October 19 360.25 — published above, latest close above
- 200-session SMA through October 19 387.58 — published below, latest close below
- Oct 16 intraday high 370.50 — published below, latest close abovecrossed
- Oct 19 intraday low 354.47 — published above, latest close above
- Oct 16 intraday low 349.33 — published above, latest close above

October 16 close $354.72 was below the 50-session SMA ($359.46) and below the 200-session SMA ($387.99). Earnings preview for October 19-23; historical levels do not bound an earnings gap.
| After | Close | vs Sat, 17 Oct 2026 close | vs published price |
|---|
| 1 session | 368.06 | — | +3.76% |
| 5 sessions | 372.22 | — | +4.93% |
- 50-session SMA 359.462 — published below, latest close abovecrossed
- 200-session SMA 387.991 — published below, latest close below

Study-universe context; not a new Saturday trade setup. Test the Theory, data through October 15, 2026.
| After | Close | vs Sat, 17 Oct 2026 close | vs published price |
|---|
| 1 session | 368.06 | — | — |
| 5 sessions | 372.22 | — | — |
This note was marked to a Historical study; no current quote, not a close. The like-for-like column is the one measured from the Sat, 17 Oct 2026 close.

The retained premarket mark is inside the October 13 daily gap. The observed premarket high and 200-session average are higher references, not guaranteed targets.
| After | Close | vs Fri, 16 Oct 2026 close | vs published price |
|---|
| 1 session | 368.06 | +3.76% | -2.49% |
| 5 sessions | 372.22 | +4.93% | -1.39% |
This note was marked to a October 16 premarket - Morning Watch edition, not a close. The like-for-like column is the one measured from the Fri, 16 Oct 2026 close.
- 20-session SMA 370.81 — published above, latest close above
- 50-session SMA 358.76 — published above, latest close above
- 200-session SMA 388.49 — published below, latest close below
- Oct 13 daily gap 377.05 — published above, latest close belowcrossed
- Oct 8 low 368.03 — published above, latest close above
- Oct 15 daily gap 363.75 — published above, latest close above
- Oct 15 low 355.23 — published above, latest close above

TSLA — The premarket jump faded
| After | Close | vs Fri, 16 Oct 2026 close | vs published price |
|---|
| 1 session | 368.06 | — | +3.76% |
| 5 sessions | 372.22 | — | +4.93% |
- 20-day SMA 370.333 — published below, latest close abovecrossed
- 50-day SMA 359.462 — published below, latest close abovecrossed
- 200-day SMA 387.991 — published below, latest close below
- Oct 16 low 349.33 — published above, latest close above
- Oct 13 gap / overhead 377.05 — published below, latest close below
- Oct 16 high / reclaim 370.58 — published below, latest close abovecrossed
- October 16 intraday low 349.33 — published above, latest close above
- October 16 intraday high 370.58 — published below, latest close abovecrossed

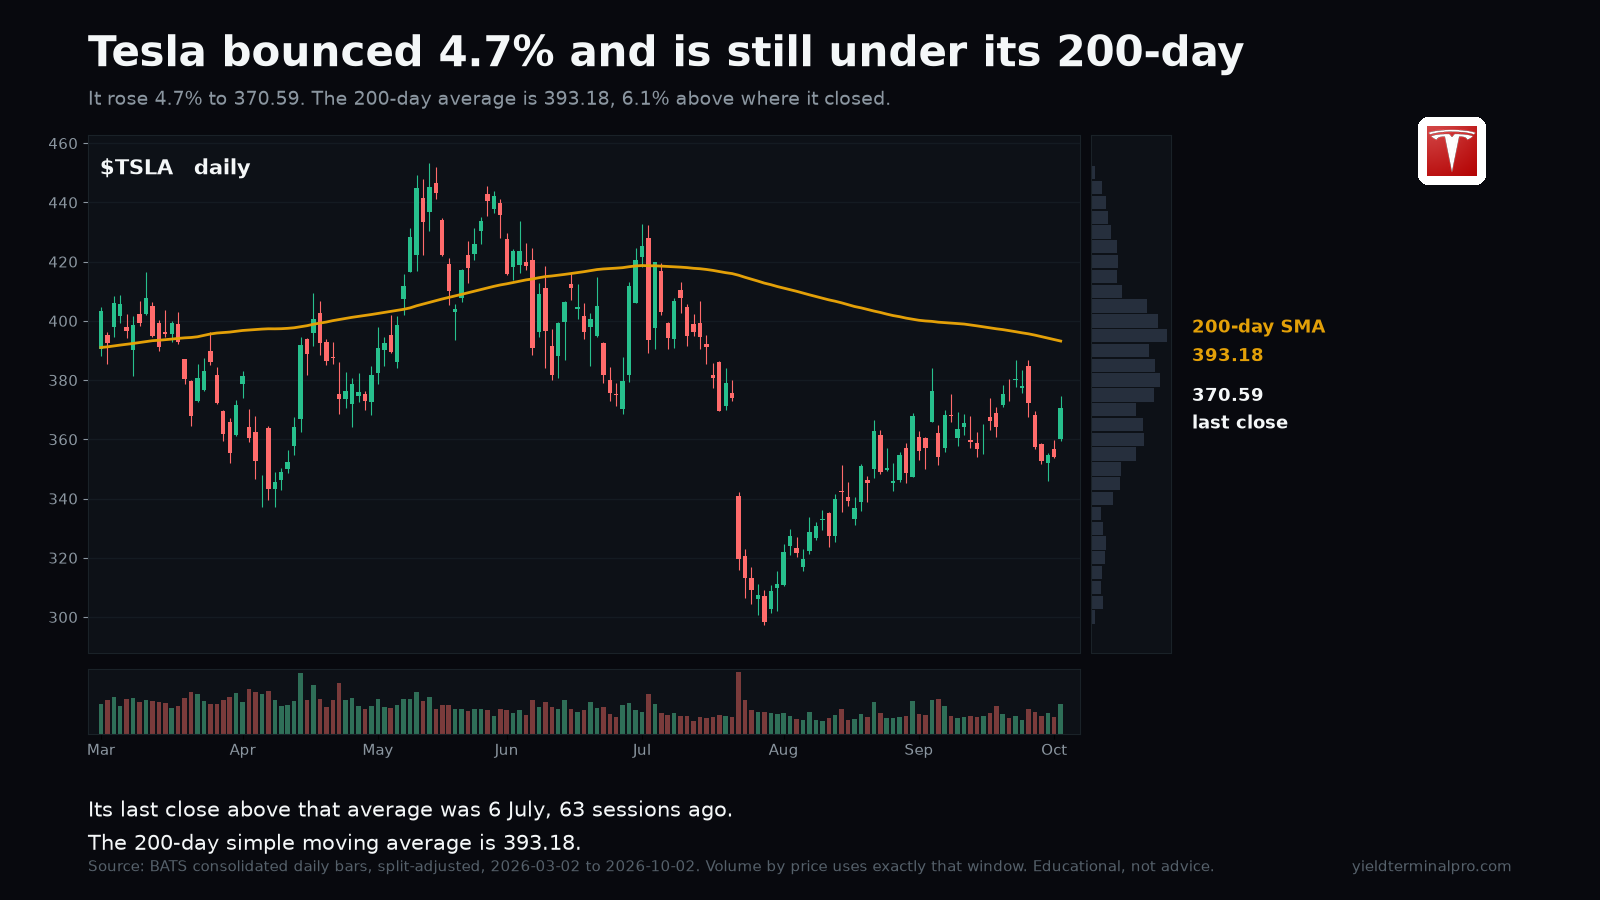
Tesla rose 4.7% and is still under its 200-day average. Its last close above that line was 6 July, 63 sessions earlier, and it finished 6% short of it. Nearly three months under one line is a trend, not a dip.
| After | Close | vs Sat, 3 Oct 2026 close | vs published price |
|---|
| 1 session | 378.73 | — | +2.20% |
| 5 sessions | 382.70 | — | +3.27% |
- 200-day simple moving average 393.18 — published below, latest close below
- 2 October session low 359.42 — published above, latest close above
- 52-week low 297.38 — published above, latest close above