$SPYSPY - October 26 Morning Watch
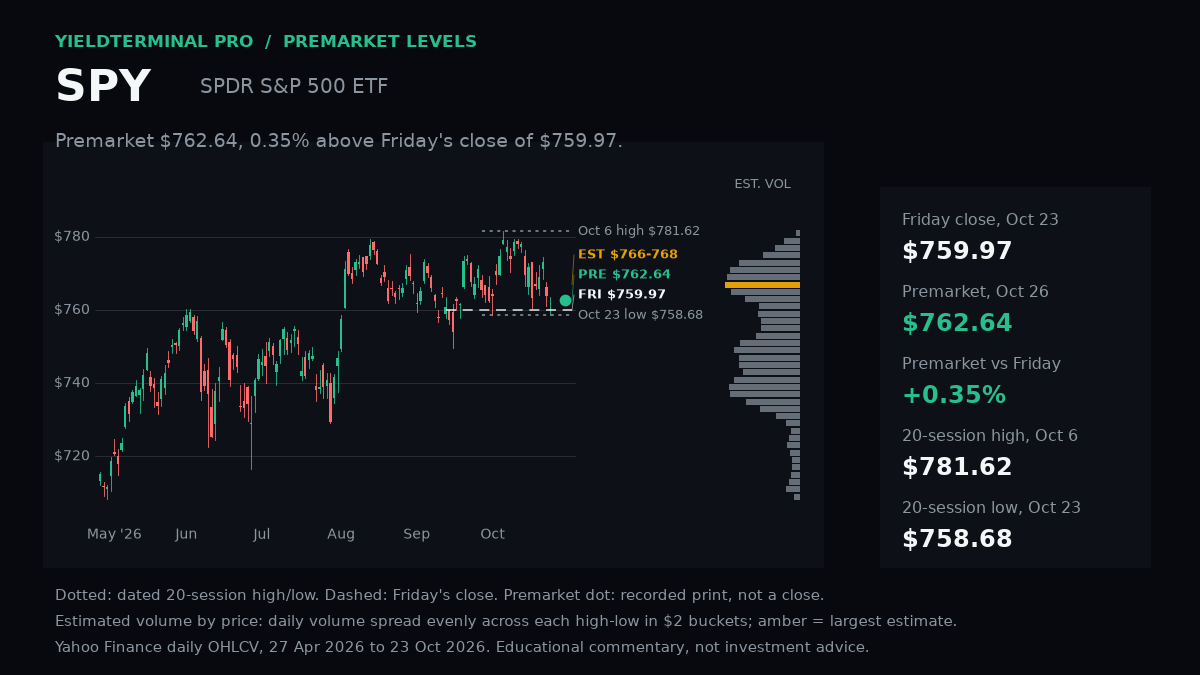
762.64Recorded October 26 premarket observationCompleted October 23 close $759.97; separately recorded October 26 premarket observation $762.64. Daily levels and averages are based on completed October 23 history.
- October 23 intraday low
- 758.68
- October 23 intraday high
- 763.47
- 20-day SMA through October 23
- 770.15
- 50-day SMA through October 23
- 767.81
- 200-day SMA through October 23
- 727.01
Levels measured over Completed US regular-session history through October 23; recorded October 26 premarket observation separately marked.. A level measured over a different window can be a different number.
 See the chart on X →