Fri, 23 Oct 2026
114.11 October 22 completed regular-session close
No verified October 23 premarket quote shown; completed October 22 close 114.11.
No session has closed since this was published.

NEM — October 23 Morning Watch — daily
Each note as it was published, with the price that followed. We publish where price sits against its own levels, not where it is going, so nothing here is scored as right or wrong. Educational commentary, not investment advice.
13 notes, newest first, back to Sat, 17 Oct 2026.
Every level we marked, and what price did next. Free, Sundays.
Subscribing signs you up for the free YieldTerminal Sunday recap, one email a week. Educational only, not financial advice. Unsubscribe any time.
114.11 October 22 completed regular-session close
No verified October 23 premarket quote shown; completed October 22 close 114.11.
No session has closed since this was published.
114.11 October 22 completed regular-session close; graphic retains its stated financial period
September 2026 quarter issuer financial results; keep reported results, cash flows and future guidance in their separate scopes.
No session has closed since this was published.

114.11 October 22 completed regular-session close; graphic retains its stated financial period
September 2026 quarter issuer financial results; keep reported results, cash flows and future guidance in their separate scopes.
No session has closed since this was published.

109.78 Recorded October 23 regular-session observation; separate from completed daily candle
Recorded $109.78 regular-session observation below completed October 22 low $111.41 and below the 50- and 200-day averages. The dated low needs a reclaim.
No session has closed since this was published.

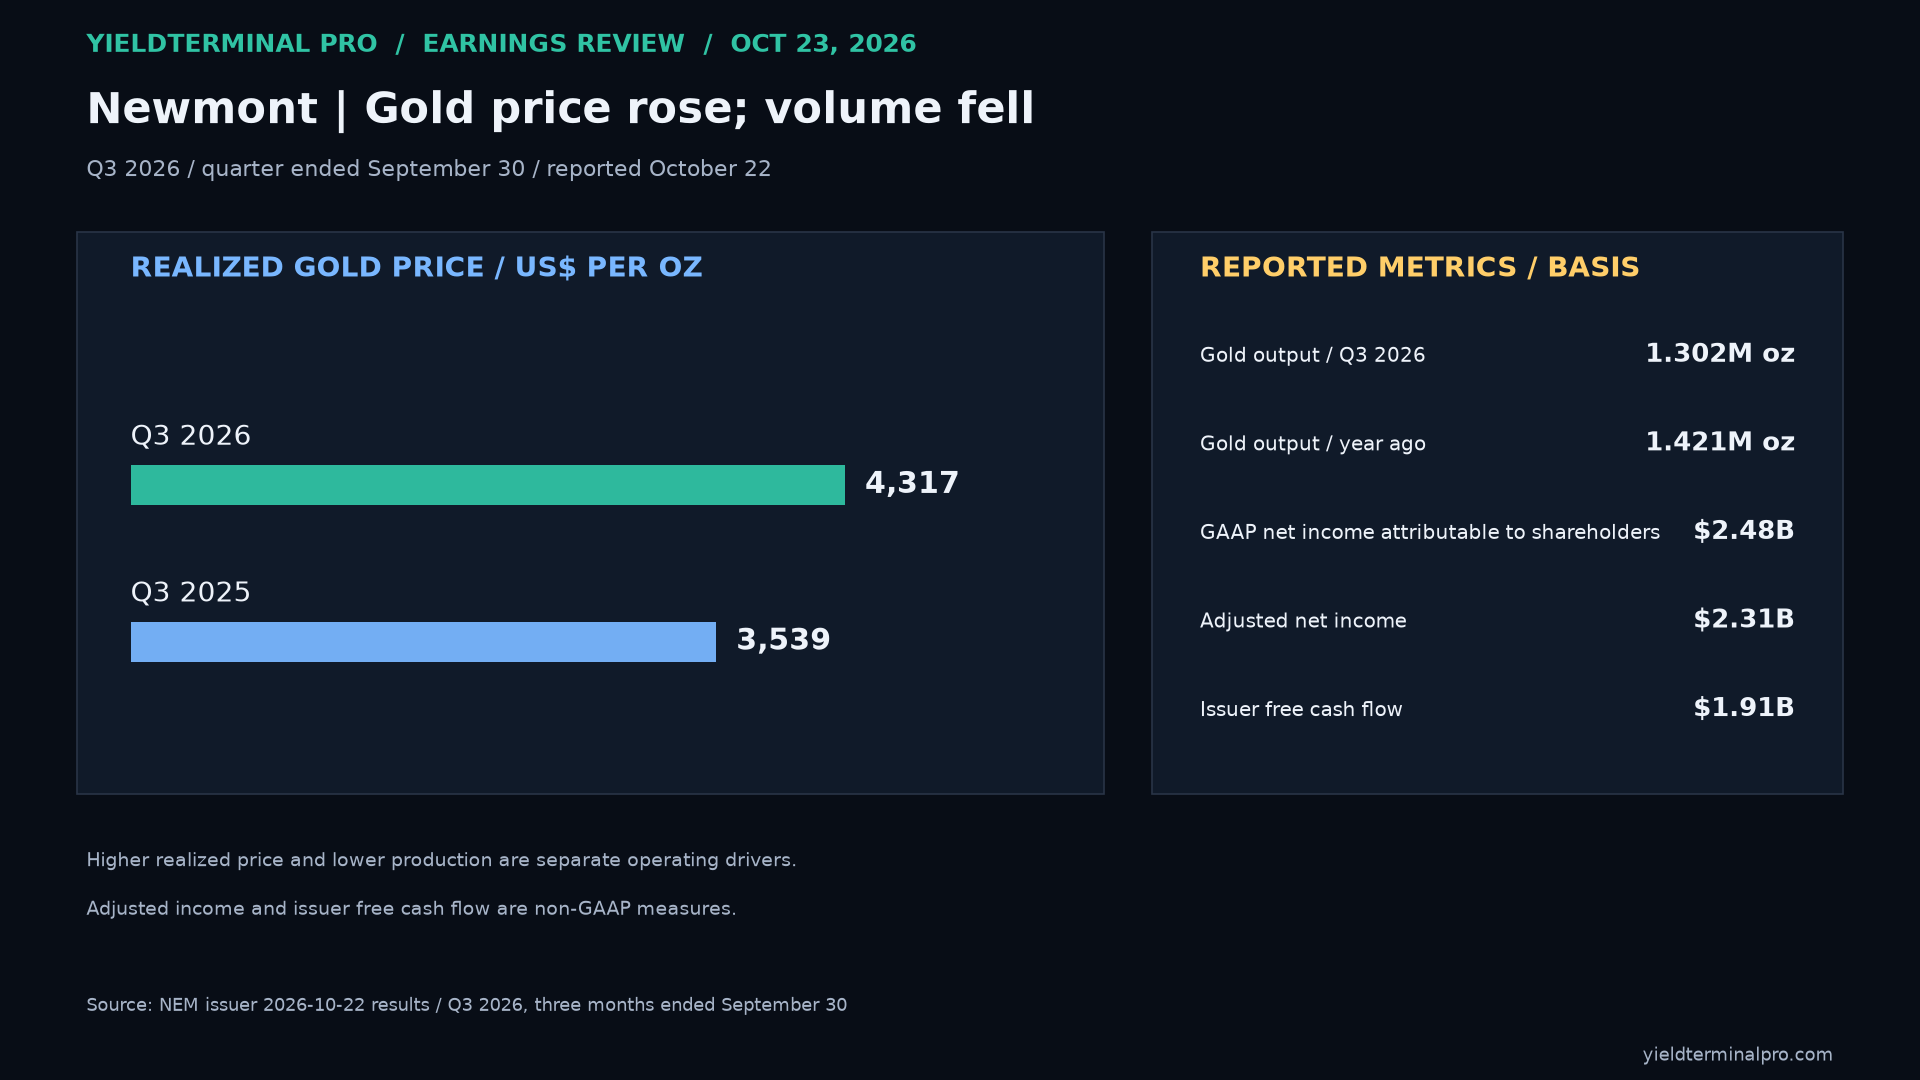
Q3 realized gold price rose to $4,317 per ounce from $3,539; production fell to 1.302 million ounces from 1.421 million.
No session has closed since this was published.
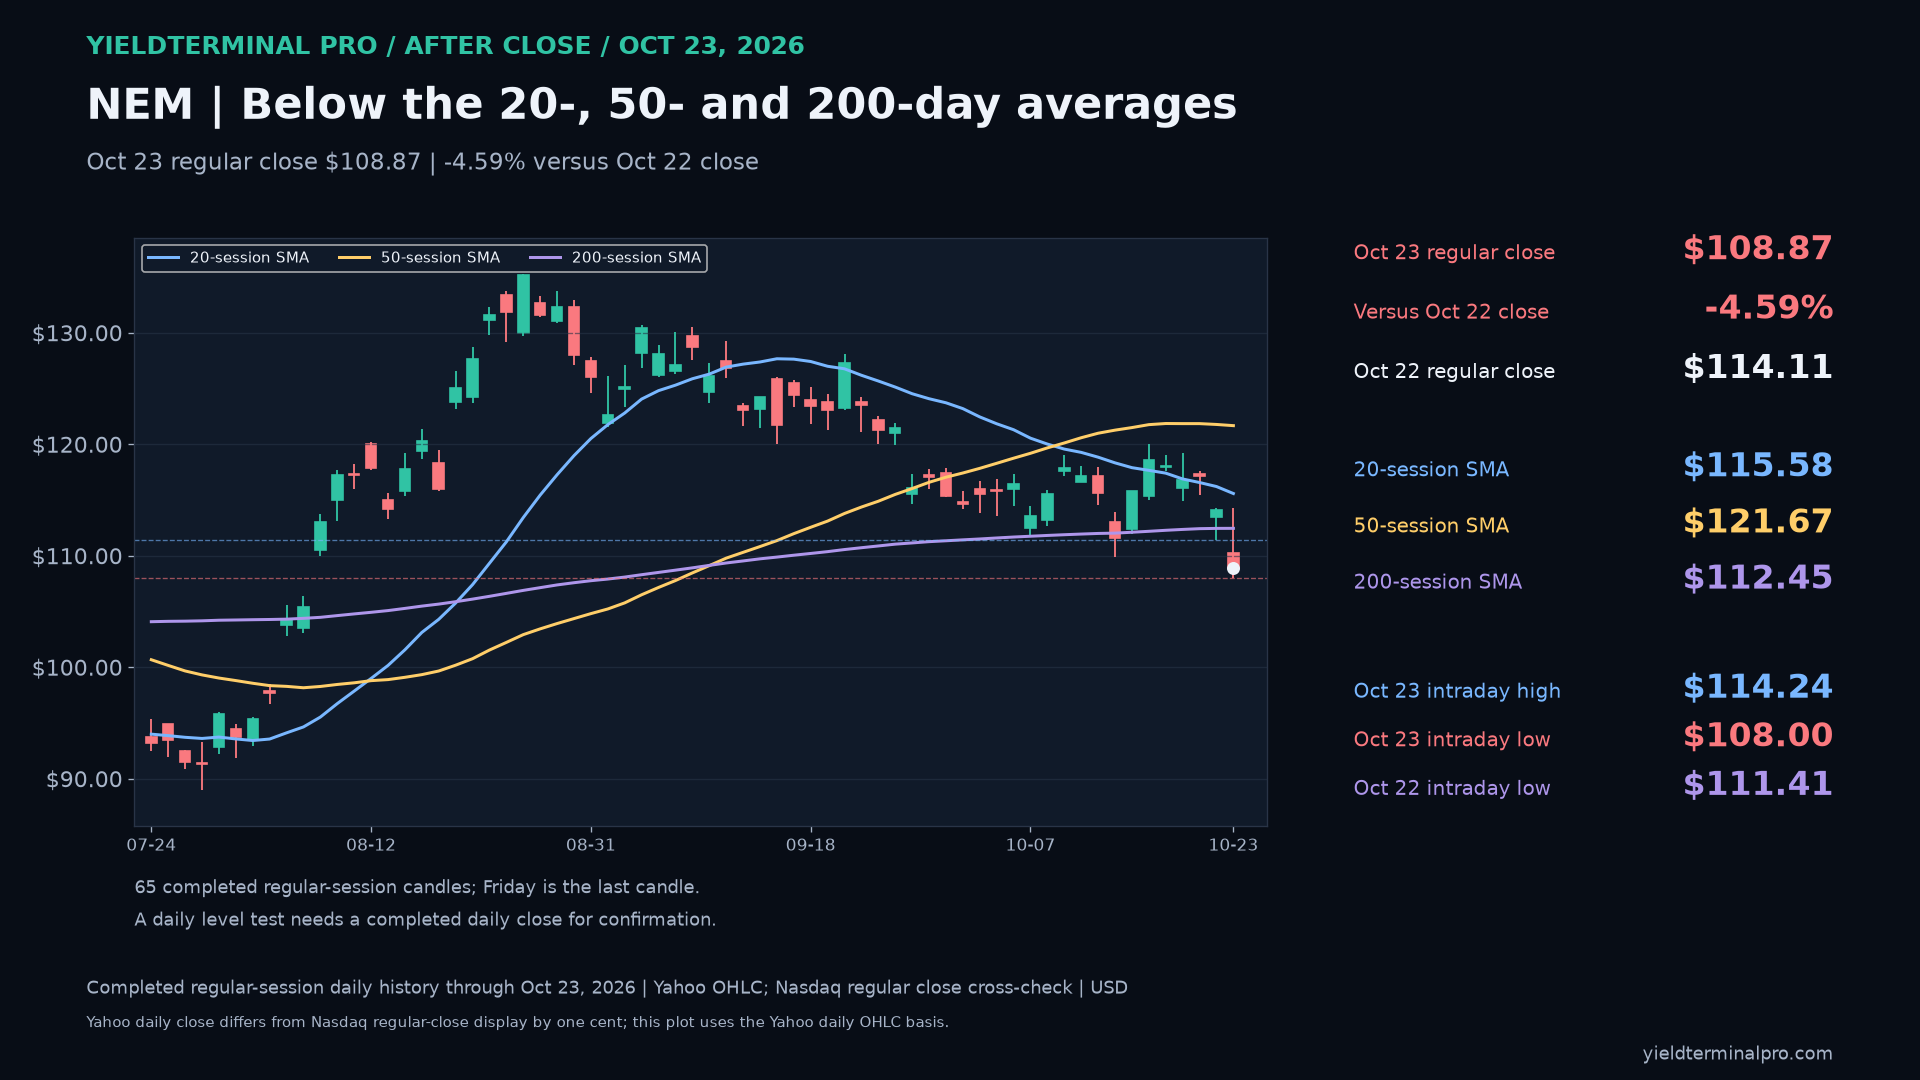
108.87 October 23 completed regular-session close
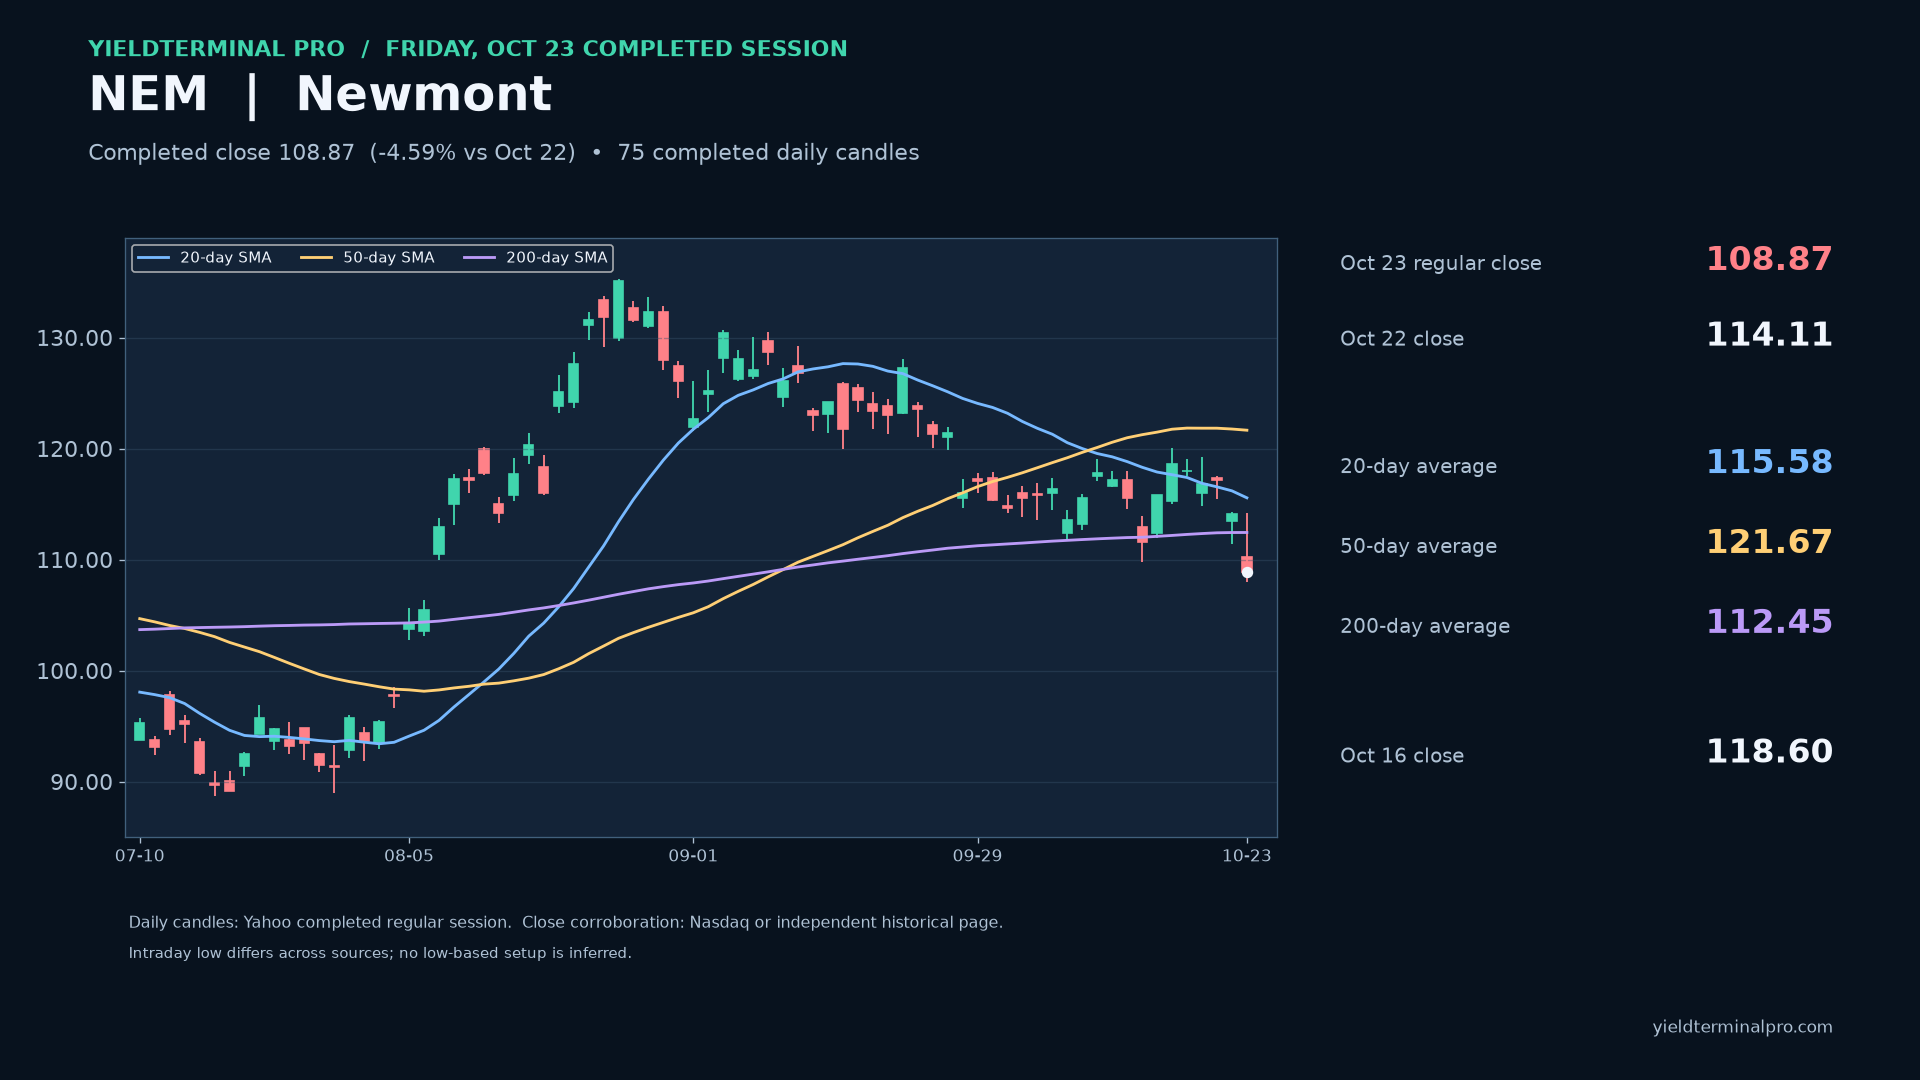
NEM completed October 23 regular-session daily chart: close 108.87; 20-day SMA 115.58, 50-day SMA 121.67, 200-day SMA 112.45; October 23 intraday low 108.00; October 22 intraday low 111.41.
No session has closed since this was published.
108.87 October 23 completed regular-session close; supporting price reference
Newmont September 2026 quarter production, realized gold price and reported earnings.
No session has closed since this was published.
108.87 October 23 completed regular-session close; supporting price reference
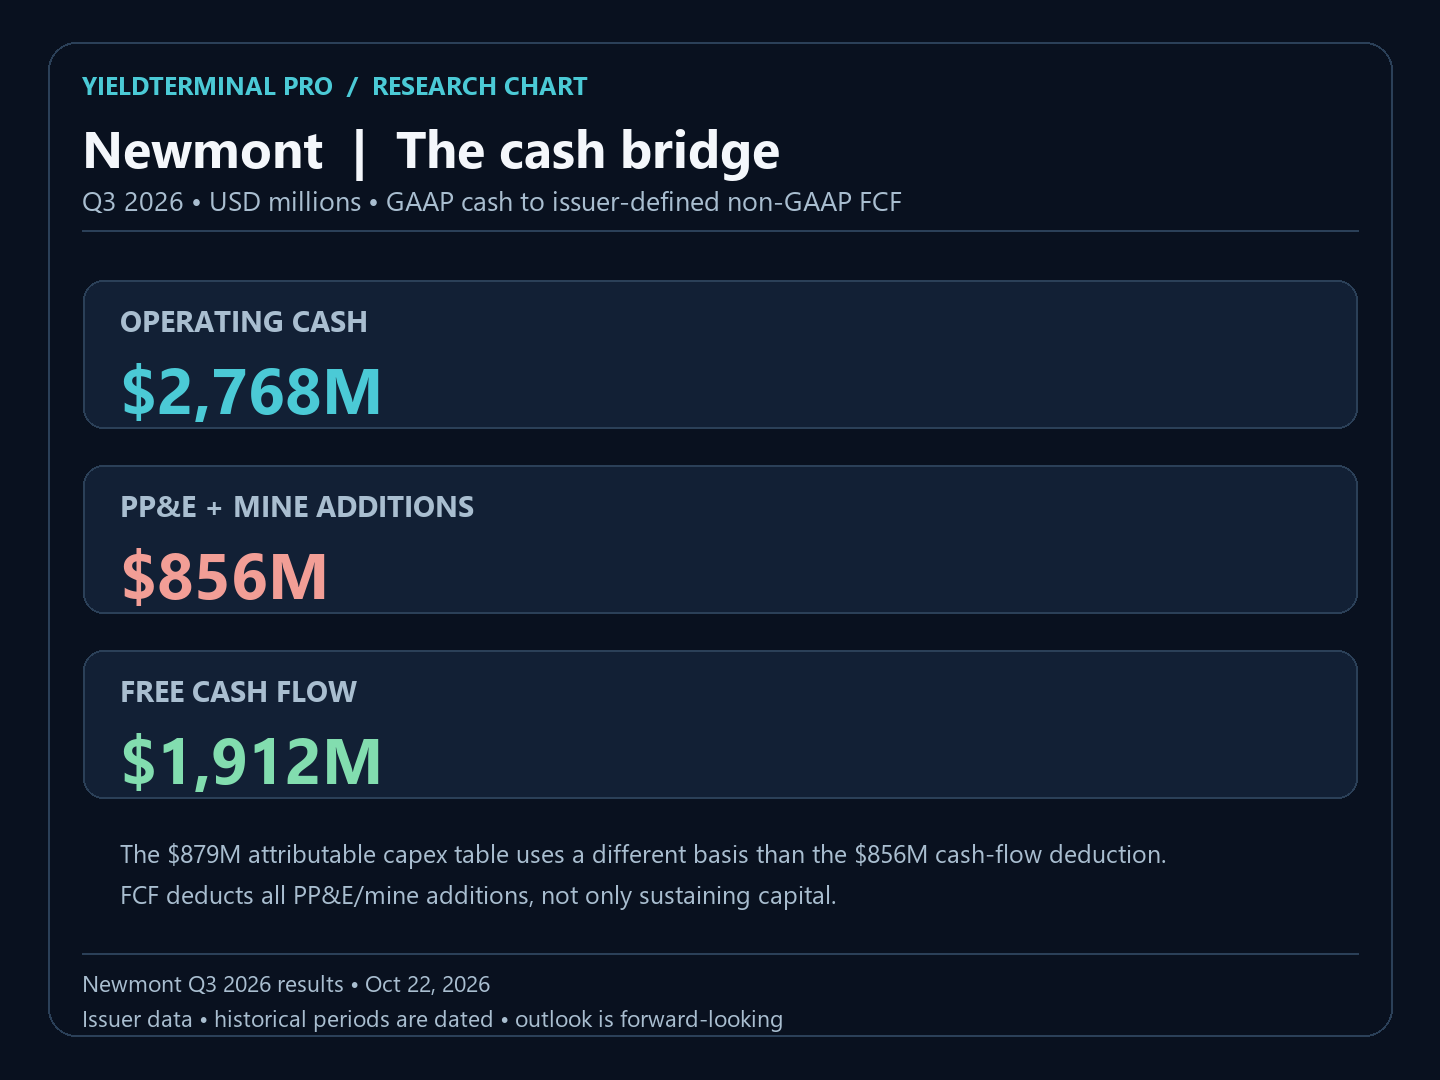
Newmont September 2026 quarter operating cash flow and issuer-reconciled non-GAAP free cash flow.
No session has closed since this was published.
108.87 October 23 completed regular-session close
Completed October 23 regular-session close $108.87, below 20-day, below 50-day, below 200-day. Daily reclaim conditions are distinct from an intraday touch.
No session has closed since this was published.
108.87 October 23 completed regular-session close; supporting financial or relative chart
September 2026 quarter GAAP operating cash $2.768 billion; company-defined non-GAAP free cash flow $1.912 billion after $856 million of mine additions.
No session has closed since this was published.
108.87 October 23 completed regular-session close; supporting financial or relative chart
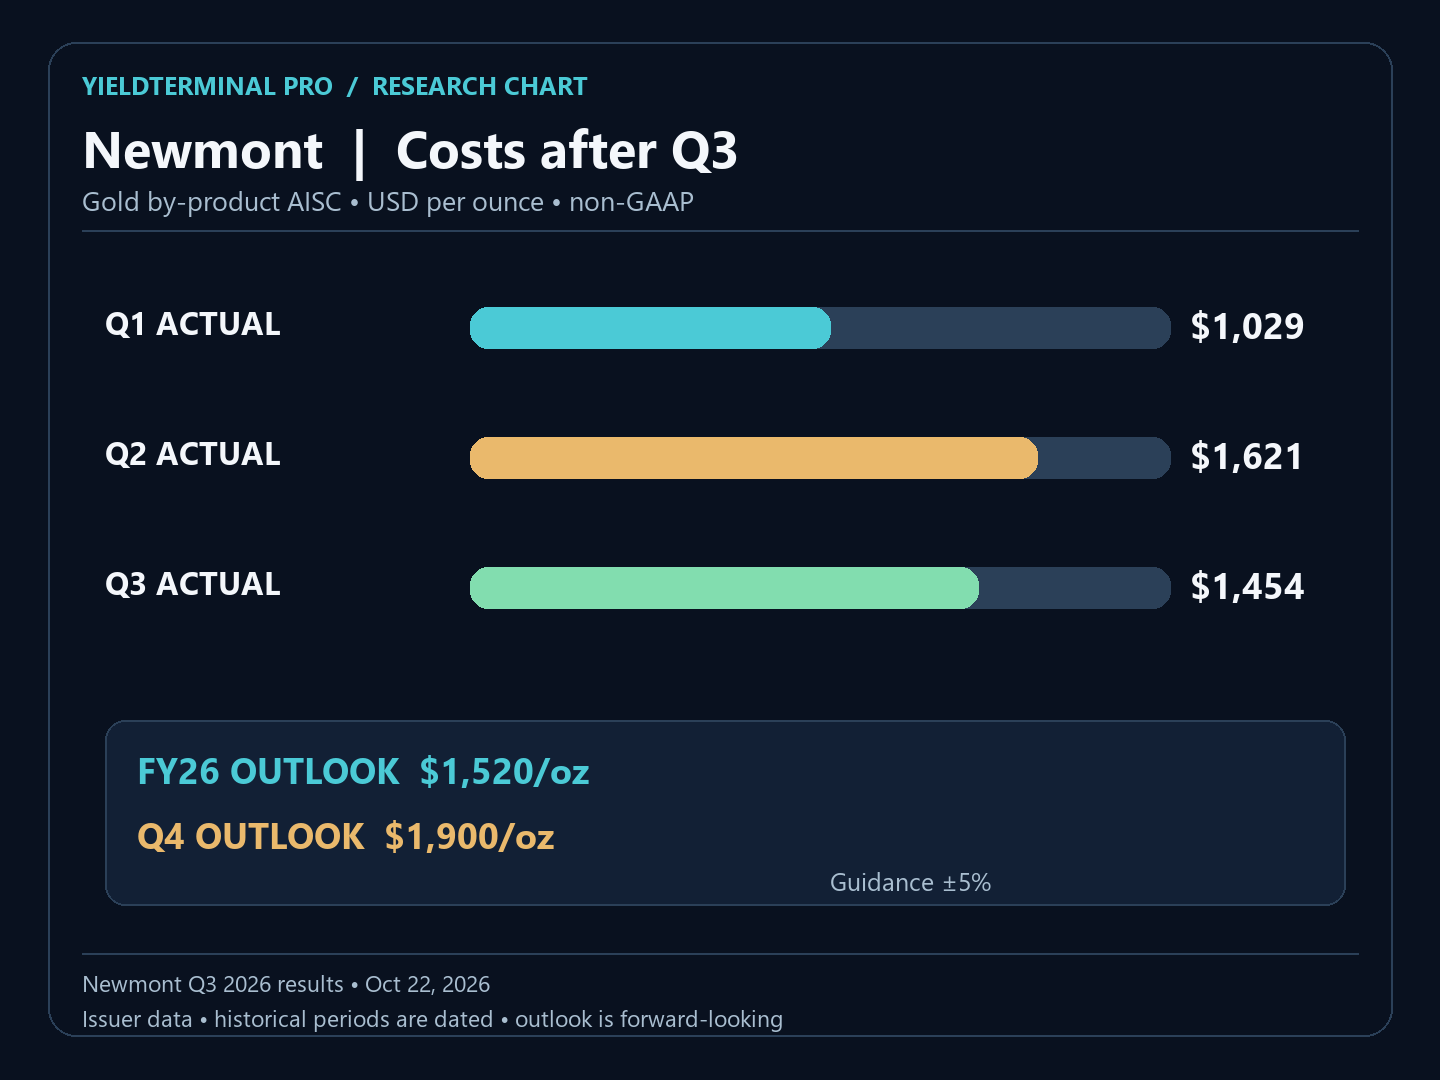
Quarterly by-product AISC $1,454/oz is completed; $1,520/oz full-year 2026 outlook is a separate forecast.
No session has closed since this was published.
108.87 October 23 completed regular-session close; supporting financial or relative chart
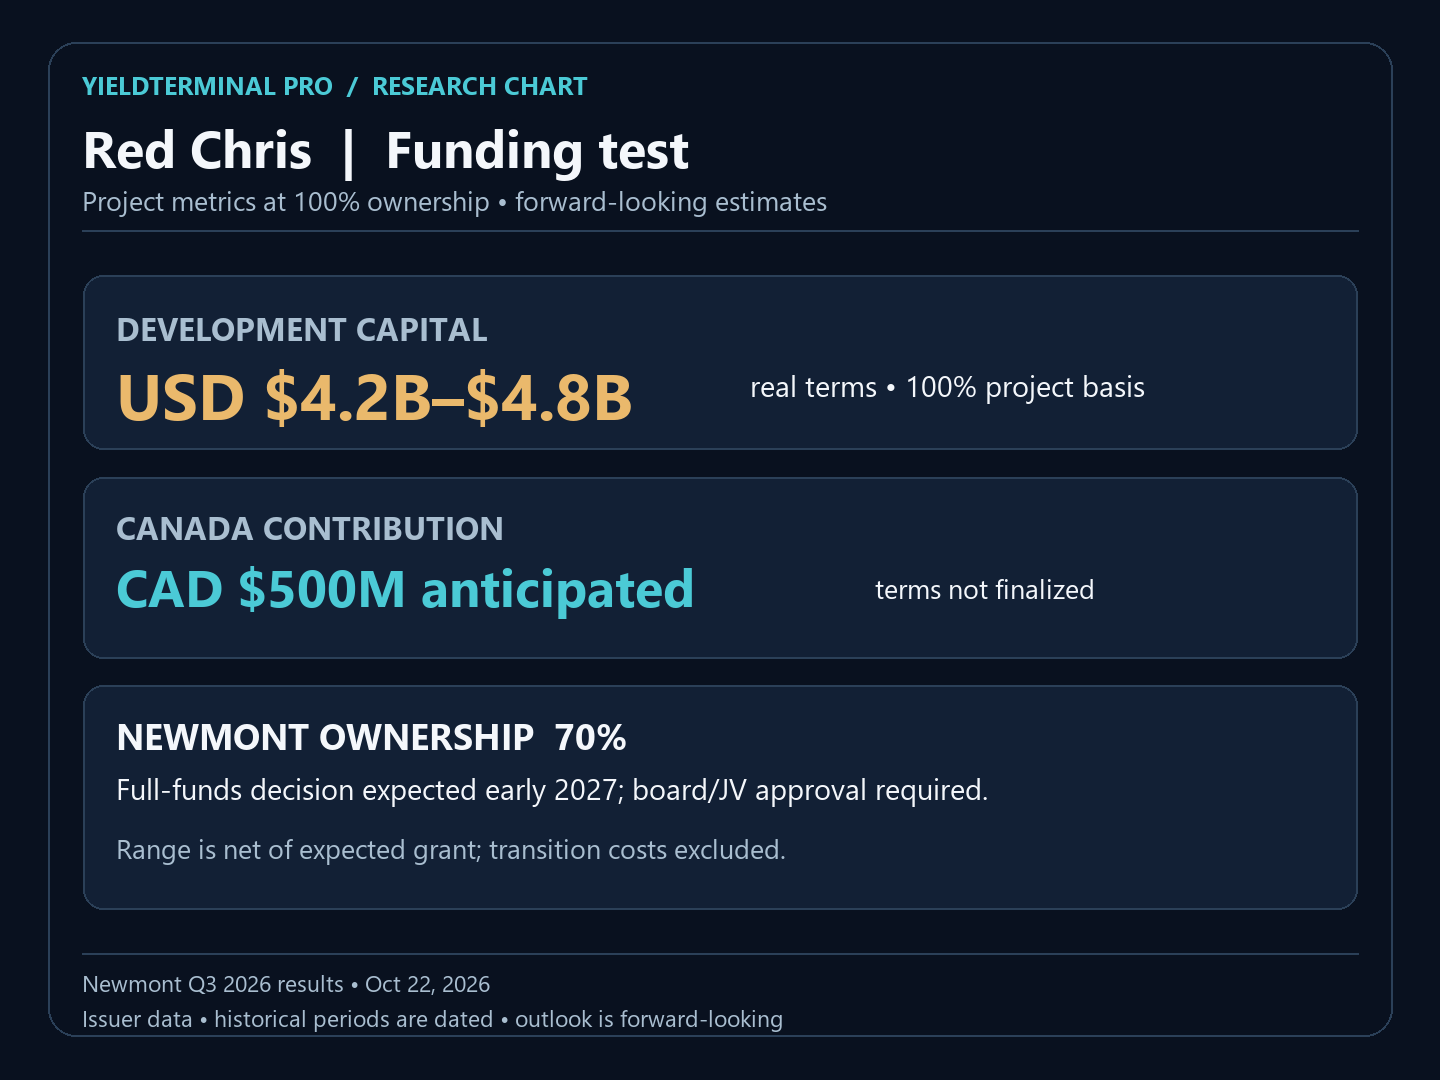
Proposed Red Chris development capital $4.2–$4.8 billion is on a 100% project basis and subject to approval.
No session has closed since this was published.
118.60 October 16 regular close
October 16 close $118.60 was below the 50-session SMA ($121.76) and above the 200-session SMA ($112.19). Earnings preview for October 19-23; historical levels do not bound an earnings gap.
| After | Close | vs Sat, 17 Oct 2026 close | vs published price |
|---|---|---|---|
| 1 session | 118.01 | — | -0.50% |
| 5 sessions | 108.87 | — | -8.20% |

See the full disclaimer.