← All daily levels$WDC support and resistance levels, and what followed
WDC — October 23 Morning Watch — daily
Each note as it was published, with the price that followed. We publish where price sits against its own levels, not where it is going, so nothing here is scored as right or wrong. Educational commentary, not investment advice.
18 notes, newest first, back to Sat, 3 Oct 2026.
Get the week in one email
Every level we marked, and what price did next. Free, Sundays.
Subscribing signs you up for the free YieldTerminal Sunday recap, one email a week. Educational only, not financial advice. Unsubscribe any time.
Separate October 23 premarket 341.96 versus completed October 22 close 354.19; daily bars remain completed through October 22. The recorded premarket point was below the October 22 low.
No session has closed since this was published.

Fri, 23 Oct 2026354.19 October 22 completed regular-session close; graphic retains its stated financial period
fiscal 2027 first quarter issuer financial results; keep reported results, cash flows and future guidance in their separate scopes.
No session has closed since this was published.

Fri, 23 Oct 2026354.19 October 22 completed regular-session close; graphic retains its stated financial period
fiscal 2027 first quarter issuer financial results; keep reported results, cash flows and future guidance in their separate scopes.
No session has closed since this was published.

Fri, 23 Oct 2026354.19 October 22 completed regular close; price reference only for a financial or comparative chart
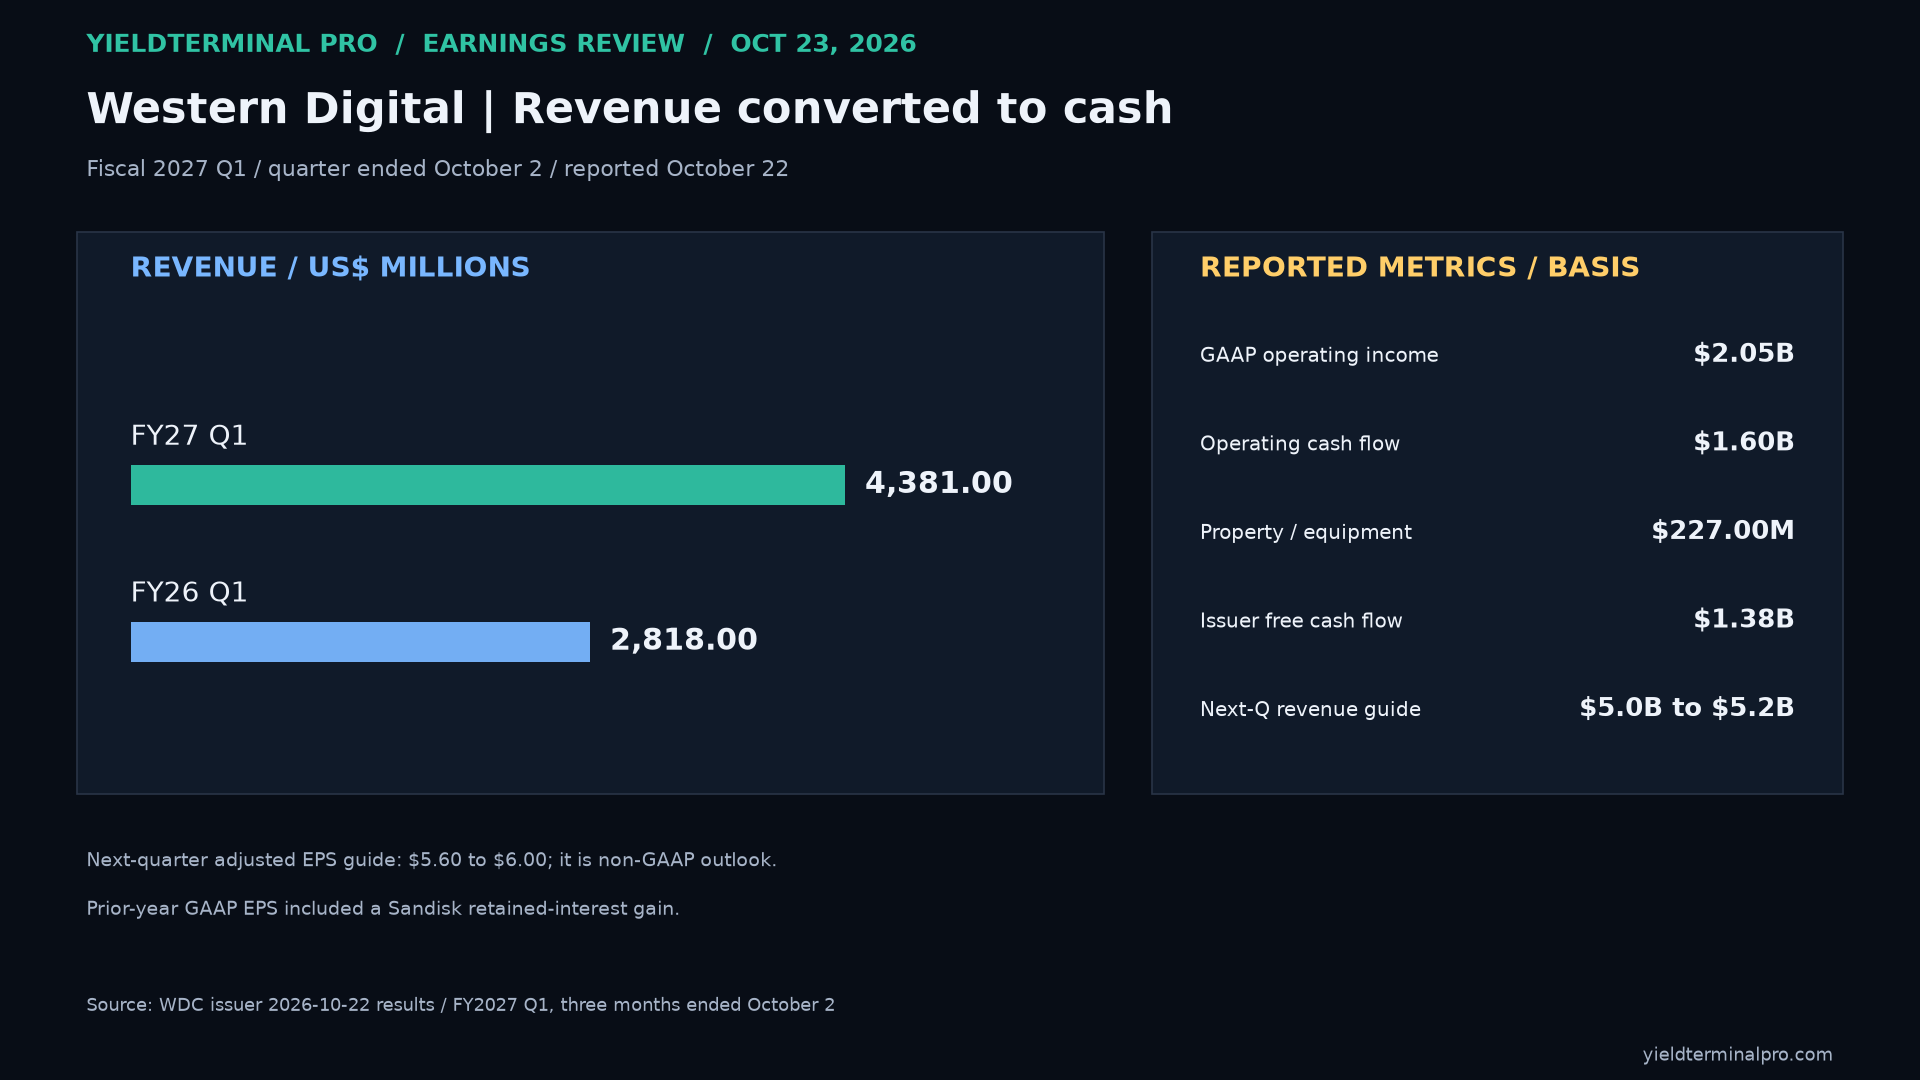
Fiscal-first-quarter revenue reached $4.381 billion and GAAP operating income $2.046 billion; the prior-year operating result was also positive.
No session has closed since this was published.

Fri, 23 Oct 2026354.19 October 22 completed regular close; price reference only for a financial or comparative chart
Fiscal-first-quarter operating cash of $1.604 billion less $227 million of net property and equipment purchases yielded $1.377 billion of issuer-defined free cash flow.
No session has closed since this was published.

Fri, 23 Oct 2026344.89 Recorded, corroborated October 23 regular-session observation; separate from completed daily candles
Recorded October 23 US regular-session observation $344.89 (-2.63%) was below the October 22 intraday low $348.23 and completed 20-, 50- and 200-session averages; a daily retest and close above the old low is needed for a reclaim.
No session has closed since this was published.

Fri, 23 Oct 2026354.19 October 22 completed regular close; October 23 observation is excluded from the completed closing-price series and shown separately
The full dated decline and later rebound are separate phases; the October 23 observation is excluded from the completed-close context.
No session has closed since this was published.

Fiscal 2027 Q1 revenue rose to $4.381 billion from $2.818 billion; issuer-defined free cash flow was $1.377 billion.
No session has closed since this was published.
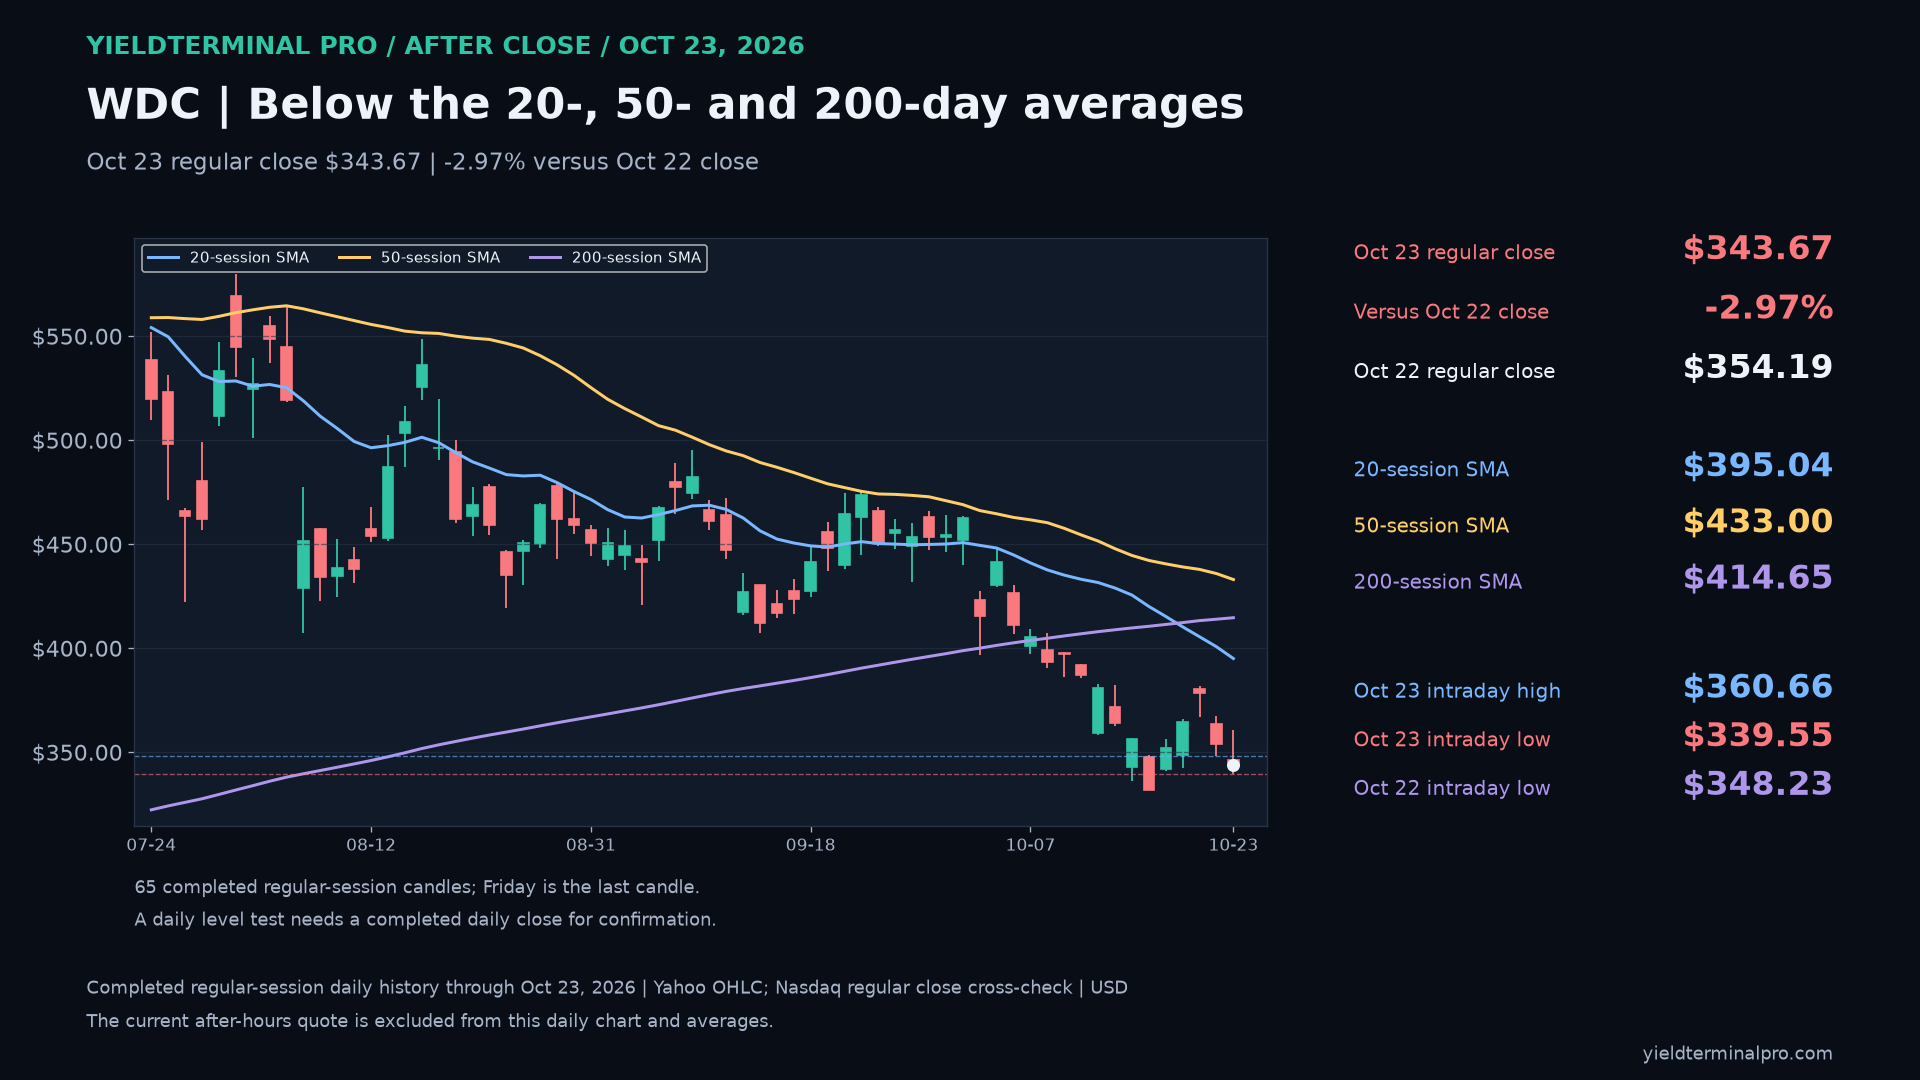
WDC completed October 23 regular-session daily chart: close 343.67; 20-day SMA 395.04, 50-day SMA 433.00, 200-day SMA 414.65; October 23 intraday low 339.55; October 22 intraday low 348.23.
No session has closed since this was published.
Fri, 23 Oct 2026343.67 October 23 completed regular-session close; supporting price reference
Western Digital fiscal first-quarter 2027 reported revenue and earnings; next-quarter figures are guidance.
No session has closed since this was published.
Fri, 23 Oct 2026343.67 October 23 completed regular-session close; supporting price reference
Western Digital fiscal first-quarter 2027 company-defined free cash flow and next-quarter guidance.
No session has closed since this was published.
WDC: completed October 22 regular-session daily chart, close 354.19; 20-day SMA through October 22 400.70; 50-day SMA through October 22 435.87; 200-day SMA through October 22 413.93; October 21 intraday high 381.88; October 21 intraday low 367.13.
| After | Close | vs Thu, 22 Oct 2026 close | vs published price |
|---|
| 1 session | 343.67 | — | -2.97% |
- 20-day SMA through October 22 400.70 — published below, latest close below
- 50-day SMA through October 22 435.87 — published below, latest close below
- 200-day SMA through October 22 413.93 — published below, latest close below
- October 21 intraday high 381.88 — published below, latest close below
- October 21 intraday low 367.13 — published below, latest close below

Thu, 22 Oct 2026354.19 October 22 completed regular-session close; supporting price reference
WDC: full closing-price decline and any separately labeled rebound through October 22; completed regular-session closes only, excluding after-hours observations.
| After | Close | vs Thu, 22 Oct 2026 close | vs published price |
|---|
| 1 session | 343.67 | — | -2.97% |

Thu, 22 Oct 2026354.19 October 22 completed regular-session close; supporting price reference
WDC: actual fiscal first quarter ended October 2 reported revenue, GAAP and separate adjusted earnings, and operating margin.
| After | Close | vs Thu, 22 Oct 2026 close | vs published price |
|---|
| 1 session | 343.67 | — | -2.97% |

Thu, 22 Oct 2026354.19 October 22 completed regular-session close; supporting price reference
WDC: fiscal first-quarter operating cash flow less net capital spending equals company-reported free cash flow; repurchases and financing are separate. Next-quarter revenue and adjusted earnings guidance are forward-looking.
| After | Close | vs Thu, 22 Oct 2026 close | vs published price |
|---|
| 1 session | 343.67 | — | -2.97% |

Thu, 22 Oct 2026354.19 October 22 completed regular-session close; supporting price reference
WDC: October 22 completed regular close compared with separate recorded after-hours observations; the after-hours observation is not a daily candle or a continuously live quote.
| After | Close | vs Thu, 22 Oct 2026 close | vs published price |
|---|
| 1 session | 343.67 | — | -2.97% |

October 16 close $332.00 was below the 50-session SMA ($442.18) and below the 200-session SMA ($410.52). Earnings preview for October 19-23; historical levels do not bound an earnings gap.
| After | Close | vs Sat, 17 Oct 2026 close | vs published price |
|---|
| 1 session | 352.21 | — | +6.09% |
| 5 sessions | 343.67 | — | +3.52% |
- 50-session SMA 442.183 — published below, latest close below
- 200-session SMA 410.524 — published below, latest close below

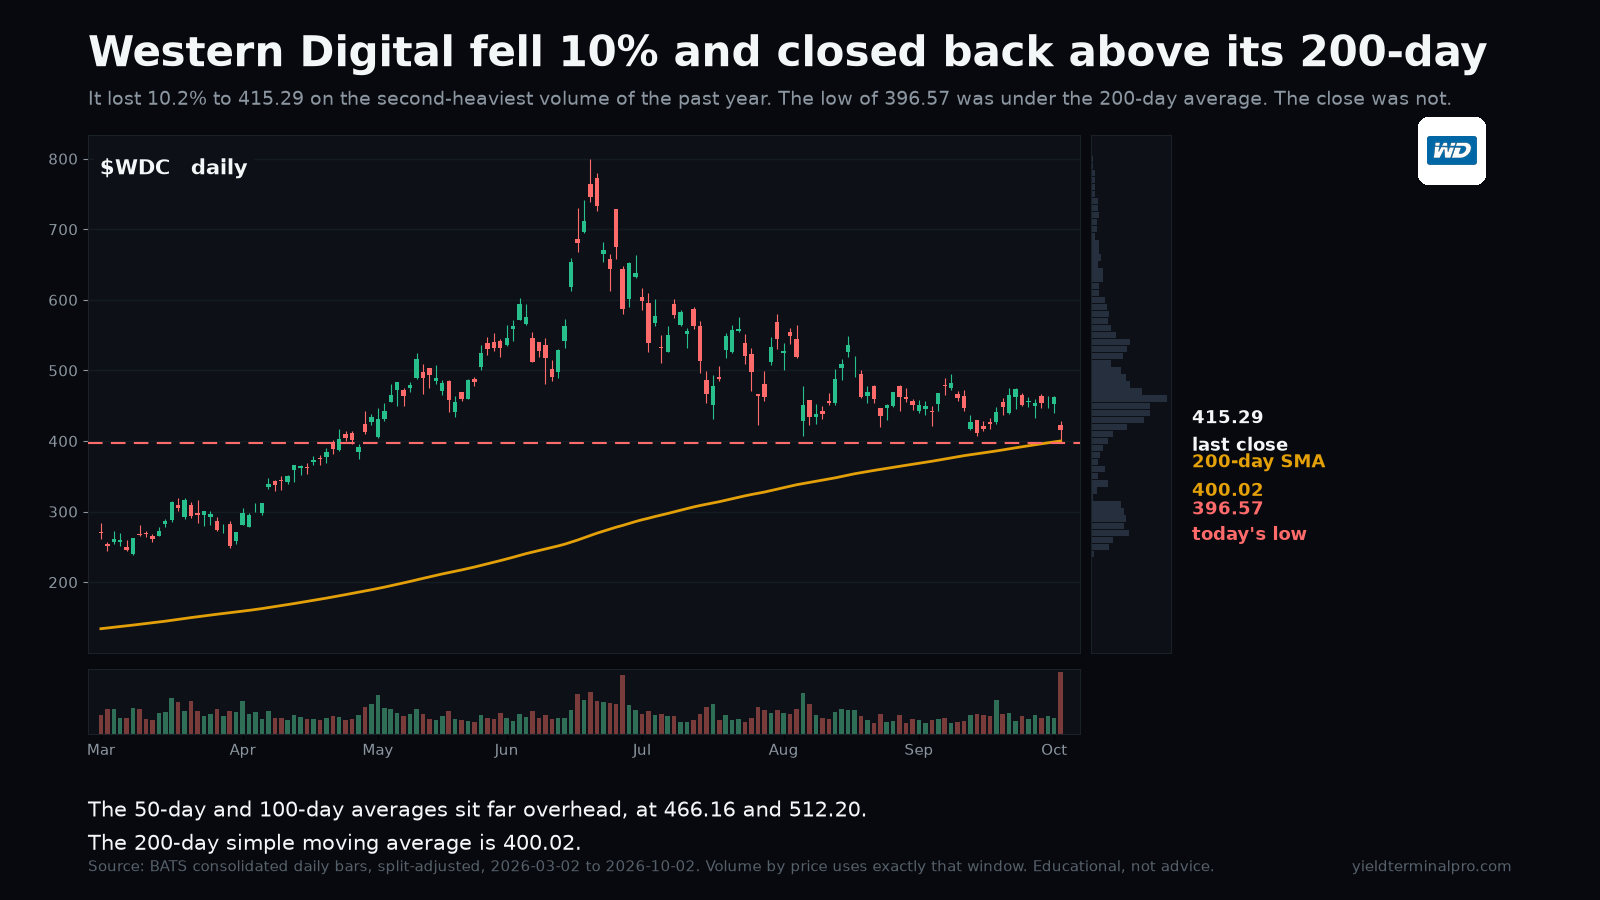
Friday's low went through the 200-day average and the close came back above it, on the second-heaviest volume of the past year. One session above a line is a hold, not a repair, and the 50-day and 100-day both sit far overhead.
| After | Close | vs Sat, 3 Oct 2026 close | vs published price |
|---|
| 1 session | 441.64 | — | +6.34% |
| 5 sessions | 397.28 | — | -4.34% |
- 200-day simple moving average 400.02 — published above, latest close belowcrossed
- 2 October session low 396.57 — published above, latest close belowcrossed
- 50-day simple moving average 466.16 — published below, latest close below
- 100-day simple moving average 512.20 — published below, latest close below