← All daily levels$NFLX support and resistance levels, and what followed
Netflix, Inc. — October 23 earnings review
Each note as it was published, with the price that followed. We publish where price sits against its own levels, not where it is going, so nothing here is scored as right or wrong. Educational commentary, not investment advice.
23 notes, newest first, back to Fri, 2 Oct 2026.
Get the week in one email
Every level we marked, and what price did next. Free, Sundays.
Subscribing signs you up for the free YieldTerminal Sunday recap, one email a week. Educational only, not financial advice. Unsubscribe any time.
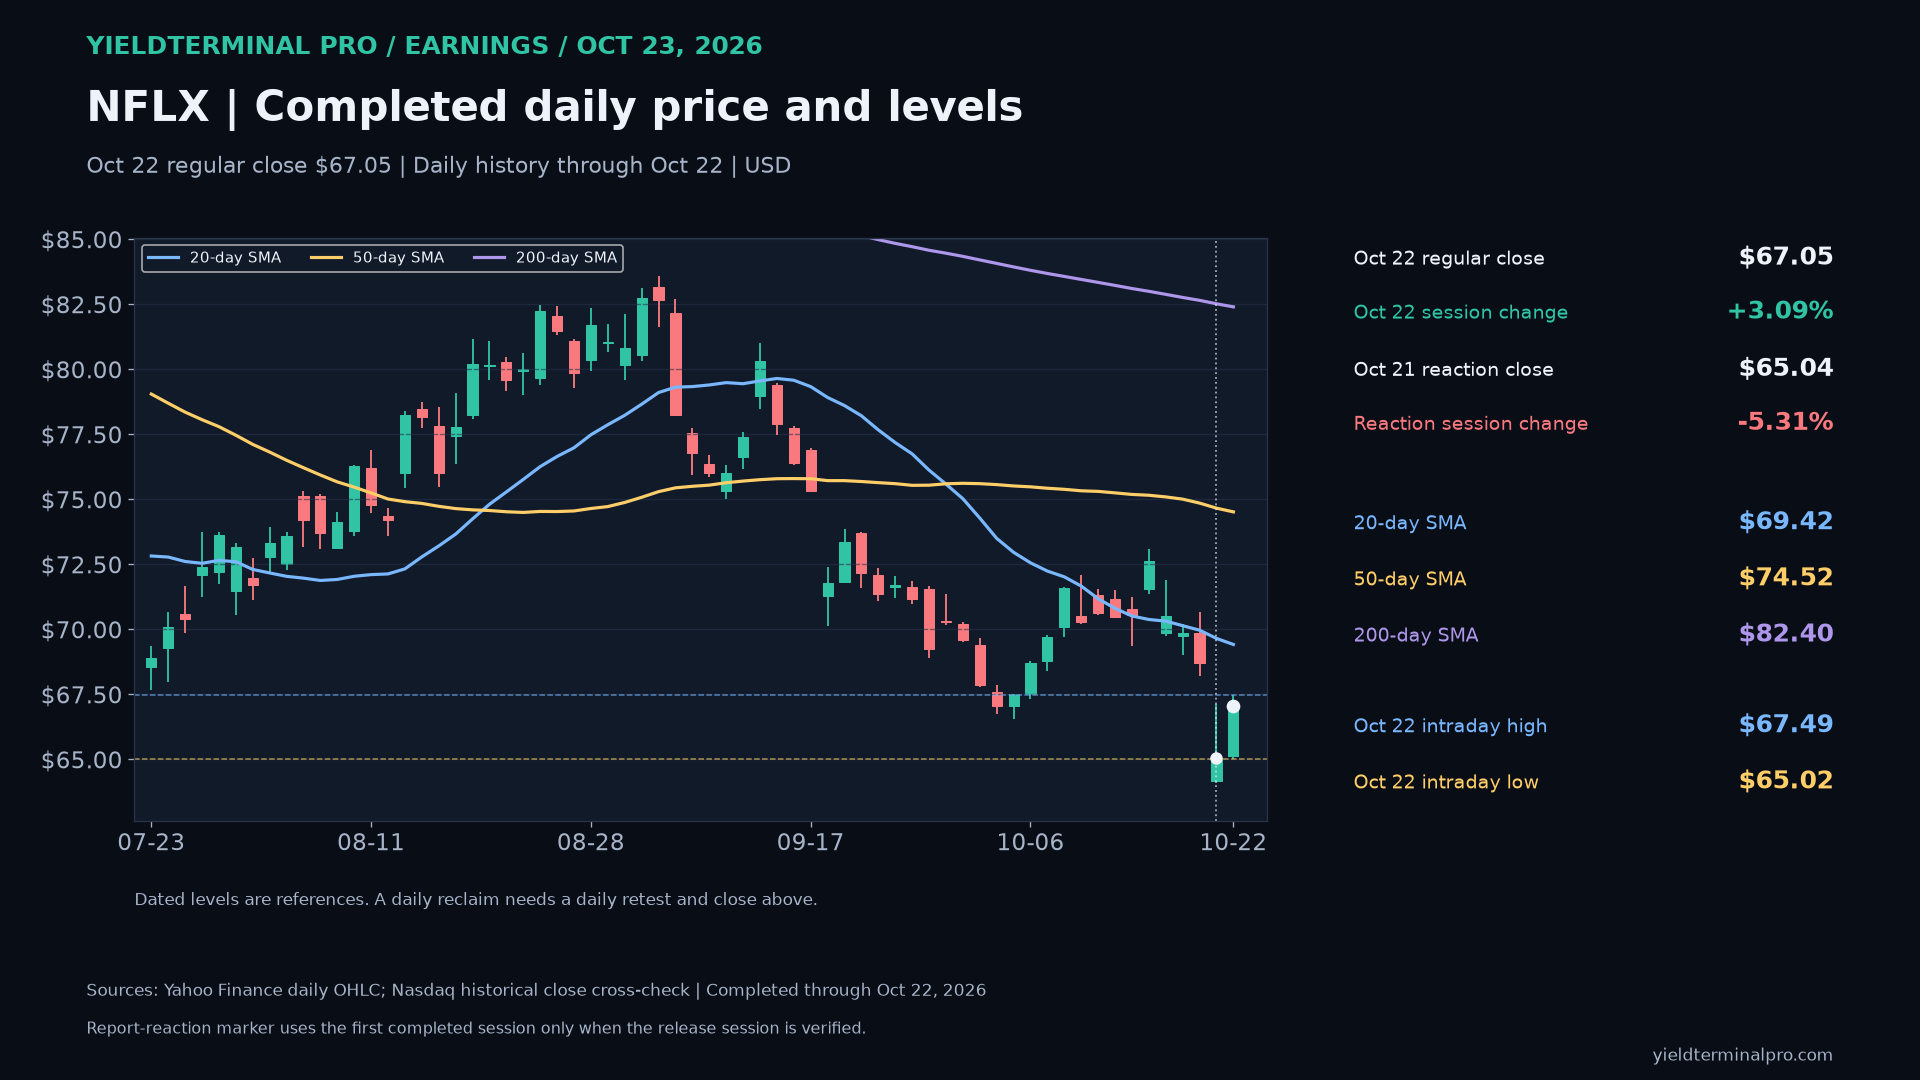
NFLX closed October 22 at $67.05, below its 50-day average ($74.52) and below its 200-day average ($82.40). The October 22 high ($67.49) and low ($65.02) are dated reference levels. This is completed daily history, not an October 23 quote.
No session has closed since this was published.
Separate October 21 premarket $64.22 (-6.51%) against completed October 20 daily references.
| After | Close | vs Wed, 21 Oct 2026 close | vs published price |
|---|
| 1 session | 67.05 | +3.09% | +4.41% |
This note was marked to a October 21 premarket observation, not a close. The like-for-like column is the one measured from the Wed, 21 Oct 2026 close.
- October 20 high 70.66 — published below, latest close below
- October 20 low 68.20 — published below, latest close below
- 20-day SMA through October 20 69.967 — published below, latest close below
- 50-day SMA through October 20 74.854 — published below, latest close below
- 200-day SMA through October 20 82.649 — published below, latest close below

Wed, 21 Oct 202668.69 October 20 completed regular-session close; supporting chart uses its stated historical or financial period
Completed closing peak-to-subsequent-low decline and separate low-to-October 20 rebound; excludes October 21 premarket observations.
| After | Close | vs Wed, 21 Oct 2026 close | vs published price |
|---|
| 1 session | 67.05 | — | -2.39% |

Wed, 21 Oct 202668.69 October 20 completed regular-session close; supporting chart uses its stated historical or financial period
Q3 actual profits and revised full-year advertising/free-cash-flow forecasts are distinct; forecast cash is not cash already generated.
| After | Close | vs Wed, 21 Oct 2026 close | vs published price |
|---|
| 1 session | 67.05 | — | -2.39% |

Completed regular close $65.04, -5.31% versus October 20. 20-day SMA $69.65; 50-day SMA $74.66; 200-day SMA $82.52. October 21 high $67.12, low $64.10.
| After | Close | vs Wed, 21 Oct 2026 close | vs published price |
|---|
| 1 session | 67.05 | — | — |

Closing peak $133.91 (2025-06-30) to subsequent closing low $65.04 (2026-10-21): -51.43%. October 21 is the latest closing low; no later completed-session rebound yet.
| After | Close | vs Wed, 21 Oct 2026 close | vs published price |
|---|
| 1 session | 67.05 | — | — |

Rank 4 among qualifying-watchlist falls; completed regular close $65.04, -5.31%. 50-day SMA $74.66; 200-day SMA $82.52.
| After | Close | vs Wed, 21 Oct 2026 close | vs published price |
|---|
| 1 session | 67.05 | — | — |

Tue, 20 Oct 202670.13 October 20 dated premarket observation / separate from completed daily candles
The dated October 20 premarket observation $70.13 was near the $70.14 20-day average. The $75.01 50-day and $82.76 200-day remain overhead ahead of the October 20 after-close report; chart recovery does not remove earnings-gap risk.
| After | Close | vs Tue, 20 Oct 2026 close | vs published price |
|---|
| 1 session | 65.04 | -5.31% | -7.26% |
This note was marked to a October 20 dated premarket observation / separate from completed daily candles, not a close. The like-for-like column is the one measured from the Tue, 20 Oct 2026 close.
- 20-session SMA through October 19 70.14 — published below, latest close below
- 50-session SMA through October 19 75.01 — published below, latest close below
- 200-session SMA through October 19 82.76 — published below, latest close below
- Oct 19 intraday high 70.22 — published below, latest close below
- Oct 19 intraday low 69.02 — published above, latest close belowcrossed
- Oct 16 intraday high 71.90 — published below, latest close below

Tue, 20 Oct 202669.85 October 19 completed regular-session close / separate historical context
The full closing-price decline from 2025-06-30 to 2026-10-02 was -49.92%; the separate low-to-October 19 closing rebound was +4.16%. The rebound does not erase the preceding decline.
| After | Close | vs Tue, 20 Oct 2026 close | vs published price |
|---|
| 1 session | 65.04 | — | -6.89% |
- 2025-06-30 peak close 133.91 — published below, latest close below
- 2026-10-02 later low 67.06 — published above, latest close belowcrossed
- Oct 19 regular close 69.85 — published below, latest close below

Completed regular close $68.69, -1.66%. 20-day SMA $69.97, 50-day $74.85, 200-day $82.65. A daily retest and close above a reclaimed level remains the confirmation rule.
| After | Close | vs Tue, 20 Oct 2026 close | vs published price |
|---|
| 1 session | 65.04 | — | -5.31% |
- 20-session SMA 69.97 — published below, latest close below
- 50-session SMA 74.85 — published below, latest close below
- 200-session SMA 82.65 — published below, latest close below
- Oct 20 intraday high 70.66 — published below, latest close below
- Oct 20 intraday low 68.20 — published above, latest close belowcrossed
- Oct 2 closing low 67.06 — published above, latest close belowcrossed

Full closing peak-to-subsequent-low decline -49.92%; separate low-to-October 20 rebound 2.43%. Closing extremes remain distinct from intraday extremes.
| After | Close | vs Tue, 20 Oct 2026 close | vs published price |
|---|
| 1 session | 65.04 | — | -5.31% |
- 2025-06-30 peak close 133.91 — published below, latest close below
- 2026-10-02 later low 67.06 — published above, latest close belowcrossed

Tue, 20 Oct 202666.42 October 20 dated after-hours observation / separate from regular-session close
Separate October 20 after-hours observation $66.42 (-3.30% versus completed regular close $68.69); a changing snapshot, not a completed daily candle or continuously live quote.
| After | Close | vs Tue, 20 Oct 2026 close | vs published price |
|---|
| 1 session | 65.04 | — | -2.08% |
- Oct 20 regular close 68.69 — published below, latest close below
- 20-session SMA 69.97 — published below, latest close below
- 50-session SMA 74.85 — published below, latest close below
- 200-session SMA 82.65 — published below, latest close below
- Oct 2 closing low 67.06 — published below, latest close below

Netflix Q3 revenue $12.87 billion, GAAP diluted EPS $0.87 versus $0.59, and operating margin 34.6%. Full-year advertising forecast reduced to about $2.7 billion from $3.0 billion and free-cash-flow forecast to about $12.0 billion from $12.5 billion. Company expense-timing and expected real-estate transaction caveats apply.
| After | Close | vs Tue, 20 Oct 2026 close | vs published price |
|---|
| 1 session | 65.04 | — | — |
This note was marked to a Reported financial comparison; no stock price mark asserted, not a close. The like-for-like column is the one measured from the Tue, 20 Oct 2026 close.

Premarket is near the 20-session average but below the 50- and 200-session averages. October 20 after-close earnings remain upcoming.
| After | Close | vs Mon, 19 Oct 2026 close | vs published price |
|---|
| 1 session | 68.69 | -1.66% | -2.58% |
This note was marked to a October 19 premarket Morning Watch edition, not a close. The like-for-like column is the one measured from the Mon, 19 Oct 2026 close.
- October 16 regular close 70.53 — published below, latest close below
- 20-session SMA 70.32 — published above, latest close belowcrossed
- 50-session SMA 75.09 — published below, latest close below
- 200-session SMA 82.88 — published below, latest close below
- October 16 intraday high 71.90 — published below, latest close below
- October 16 intraday low 69.76 — published above, latest close belowcrossed

June 30, 2025 closing peak $133.91 to October 2, 2026 closing low $67.06: -49.92%. Separate low-to-October 16 close rebound: +5.17%. These arithmetic moves do not establish a cause or predicted replay.
| After | Close | vs Mon, 19 Oct 2026 close | vs published price |
|---|
| 1 session | 68.69 | — | -2.61% |
- June 30, 2025 closing peak 133.91 — published below, latest close below
- October 2, 2026 subsequent closing low 67.06 — published above, latest close belowcrossed
- October 16 regular close 70.53 — published below, latest close below

Netflix traded below Friday’s $69.76 low, then closed back above that low while remaining beneath the updated 20-day. The decline from the June 30, 2025 closing peak to the October 2, 2026 closing low was 49.92%; the separate rebound to October 19 was 4.16%. Results remain upcoming after the close on October 20.
| After | Close | vs Mon, 19 Oct 2026 close | vs published price |
|---|
| 1 session | 68.69 | — | -1.66% |
- October 19 regular close 69.85 — published below, latest close below
- October 16 regular close 70.53 — published below, latest close below
- 20-session SMA through October 19 70.14 — published below, latest close below
- 50-session SMA through October 19 75.01 — published below, latest close below
- 200-session SMA through October 19 82.76 — published below, latest close below
- Oct 16 intraday low 69.76 — published above, latest close belowcrossed
- Oct 19 intraday low 69.02 — published above, latest close belowcrossed
- Oct 16 intraday high 71.90 — published below, latest close below

The June 30, 2025 closing peak to October 2, 2026 closing low decline was 49.92%; the separate rebound to October 19 was 4.16%.
| After | Close | vs Mon, 19 Oct 2026 close | vs published price |
|---|
| 1 session | 68.69 | — | -1.66% |
- 2025-06-30 peak close 133.91 — published below, latest close below
- 2026-10-02 subsequent closing low 67.06 — published above, latest close belowcrossed
- October 19 regular close 69.85 — published below, latest close below

October 16 close $70.53 was below the 50-session SMA ($75.09) and below the 200-session SMA ($82.88). Earnings preview for October 19-23; historical levels do not bound an earnings gap.
| After | Close | vs Sat, 17 Oct 2026 close | vs published price |
|---|
| 1 session | 69.85 | — | -0.96% |
| 5 sessions | 65.85 | — | -6.64% |
- 50-session SMA 75.092 — published below, latest close below
- 200-session SMA 82.881 — published below, latest close below

The retained premarket mark is below the October 15 daily gap; that range is a reclaim reference rather than support assumed to hold.
| After | Close | vs Fri, 16 Oct 2026 close | vs published price |
|---|
| 1 session | 69.85 | -0.96% | -1.31% |
| 5 sessions | 65.85 | -6.64% | -6.97% |
This note was marked to a October 16 premarket - Morning Watch edition, not a close. The like-for-like column is the one measured from the Fri, 16 Oct 2026 close.
- 20-session SMA 70.38 — published above, latest close belowcrossed
- 50-session SMA 75.16 — published below, latest close below
- 200-session SMA 83.00 — published below, latest close below
- Oct 15 high 73.07 — published below, latest close below
- Oct 15 daily gap 71.26 — published below, latest close below
- Jul 30 low 70.55 — published above, latest close belowcrossed
- Sep 18 low 70.11 — published above, latest close belowcrossed

October 16 written research edition, using the completed October 15 close and moving averages. This chart is a distinct version from the morning premarket edition.
| After | Close | vs Fri, 16 Oct 2026 close | vs published price |
|---|
| 1 session | 69.85 | — | -3.80% |
| 5 sessions | 65.85 | — | -9.31% |
- 20-session SMA 70.38 — published above, latest close belowcrossed
- 50-session SMA 75.16 — published below, latest close below
- 200-session SMA 83.00 — published below, latest close below
- Oct 15 intraday high 73.07 — published below, latest close below
- Oct 15 intraday low 71.34 — published above, latest close belowcrossed
- 2026-10-15 remaining daily gap 71.26 — published above, latest close belowcrossed

The full recent closing decline and the subsequent rebound use different starting points; they do not cancel arithmetically.
| After | Close | vs Fri, 16 Oct 2026 close | vs published price |
|---|
| 1 session | 69.85 | — | -3.80% |
| 5 sessions | 65.85 | — | -9.31% |
- Jun 30, 2025 closing peak 133.91 — published below, latest close below
- Oct 2, 2026 closing trough 67.06 — published above, latest close belowcrossed

NFLX — A small recovery within a weaker chart
| After | Close | vs Fri, 16 Oct 2026 close | vs published price |
|---|
| 1 session | 69.85 | — | -0.96% |
| 5 sessions | 65.85 | — | -6.64% |
- 20-day SMA 70.316 — published above, latest close belowcrossed
- 50-day SMA 75.092 — published below, latest close below
- 200-day SMA 82.881 — published below, latest close below
- Oct 16 low 69.82 — published above, latest close belowcrossed
- Sep 18 gap / overhead 73.87 — published below, latest close below
- Oct 16 high / reclaim 71.90 — published below, latest close below
- October 16 intraday low 69.82 — published above, latest close belowcrossed
- October 16 intraday high 71.90 — published below, latest close below

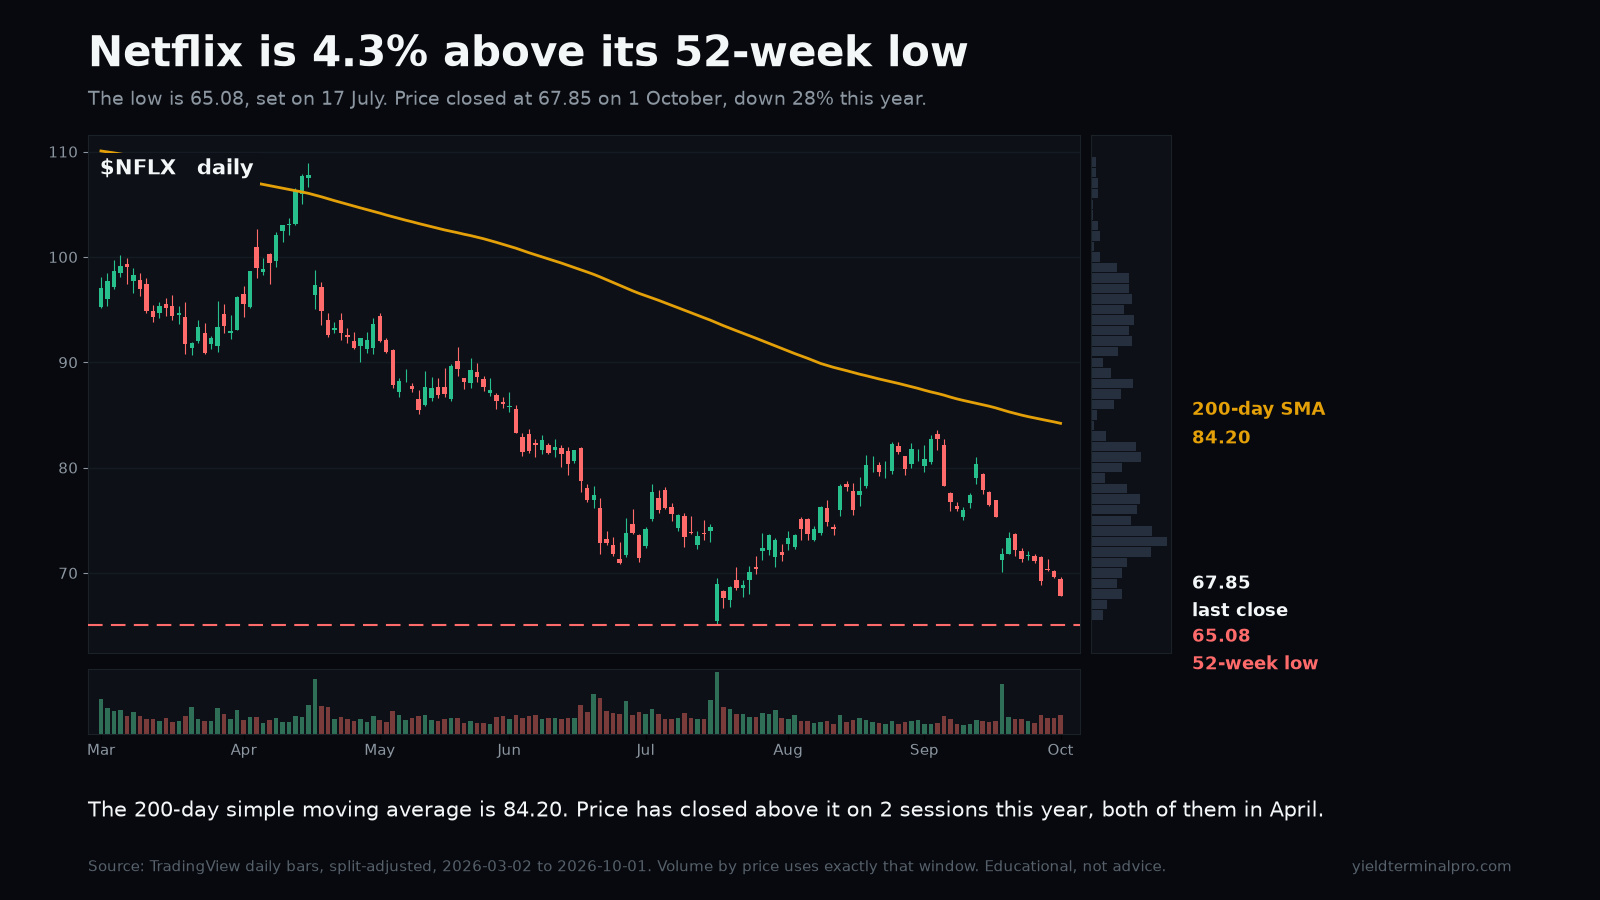
The 200-day now sits above every high of the last 30 sessions, which makes the lift off July's low a move inside the downtrend rather than out of it.
| After | Close | vs Fri, 2 Oct 2026 close | vs published price |
|---|
| 1 session | 67.50 | — | -0.52% |
| 5 sessions | 70.30 | — | +3.61% |
- 200-day simple moving average 84.20 — published below, latest close below
- Highest high, last 30 sessions 83.60 — published below, latest close below
- 52-week low 65.08 — published above, latest close above