Fri, 9 Oct 2026
333.81 premarket print, 06:18 ET
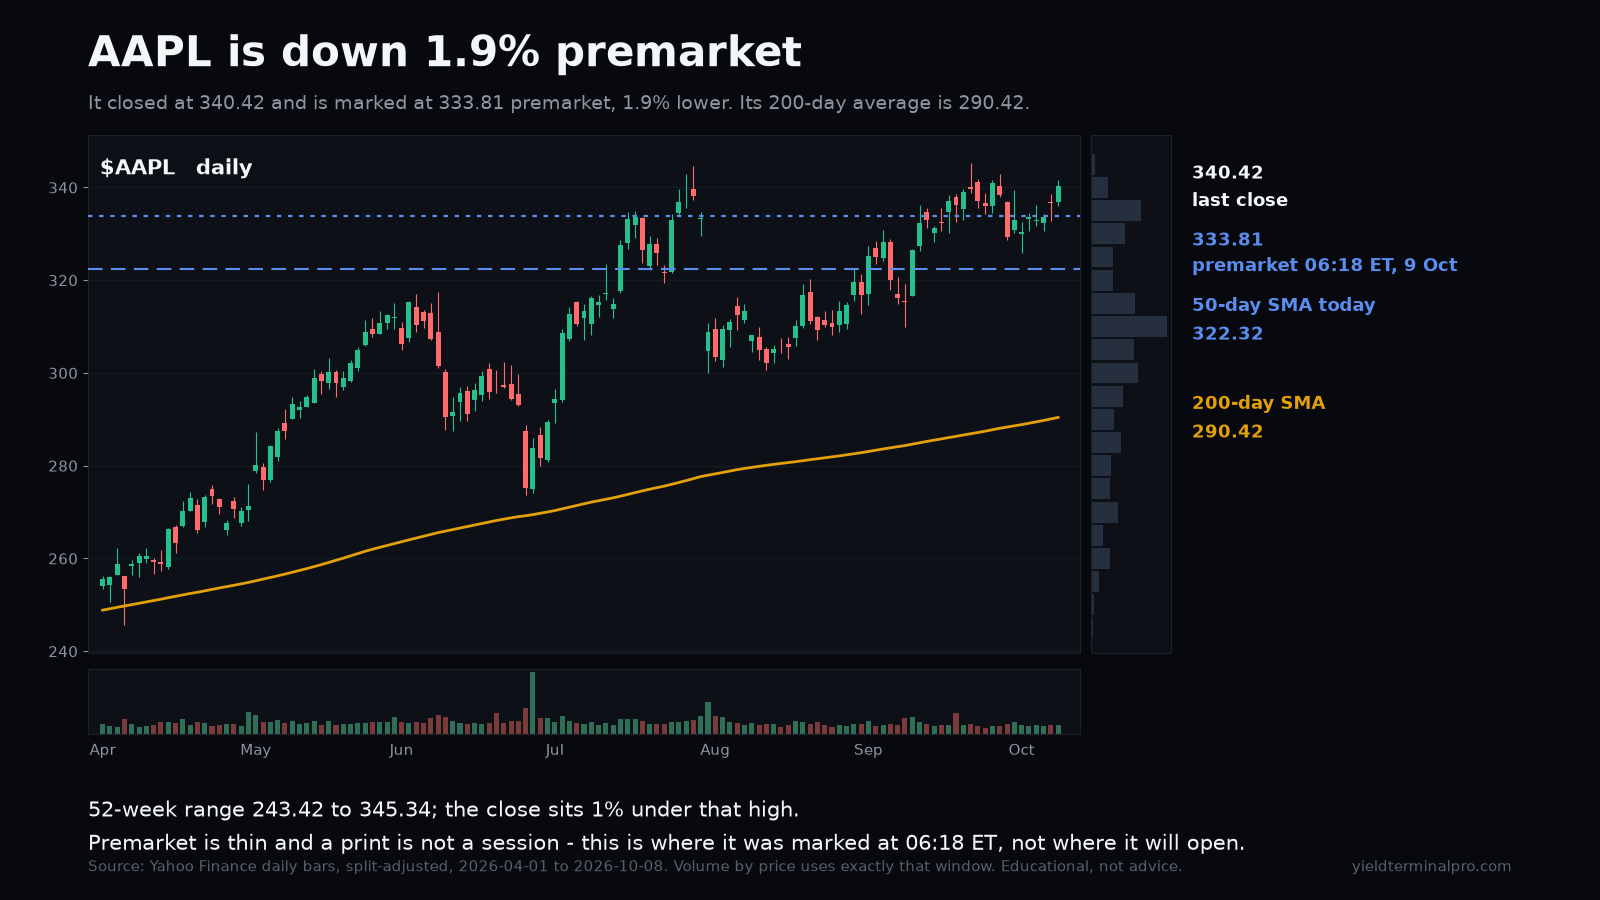
AAPL is 1.9% lower premarket, marked at 333.81 against a 340.42 close.
| After | Close | vs Fri, 9 Oct 2026 close | vs published price |
|---|---|---|---|
| 1 session | 340.97 | +1.29% | +2.14% |
| 5 sessions | 343.46 | +2.03% | +2.89% |
This note was marked to a premarket print, 06:18 ET, not a close. The like-for-like column is the one measured from the Fri, 9 Oct 2026 close.
- 50-day simple moving average 322.32 — published above, latest close above
- 200-day simple moving average 290.42 — published above, latest close above
- 52-week high 345.34 — published below, latest close abovecrossed
- 52-week low 243.42 — published above, latest close above