Fri, 23 Oct 2026
175.91 23 October 2026 close
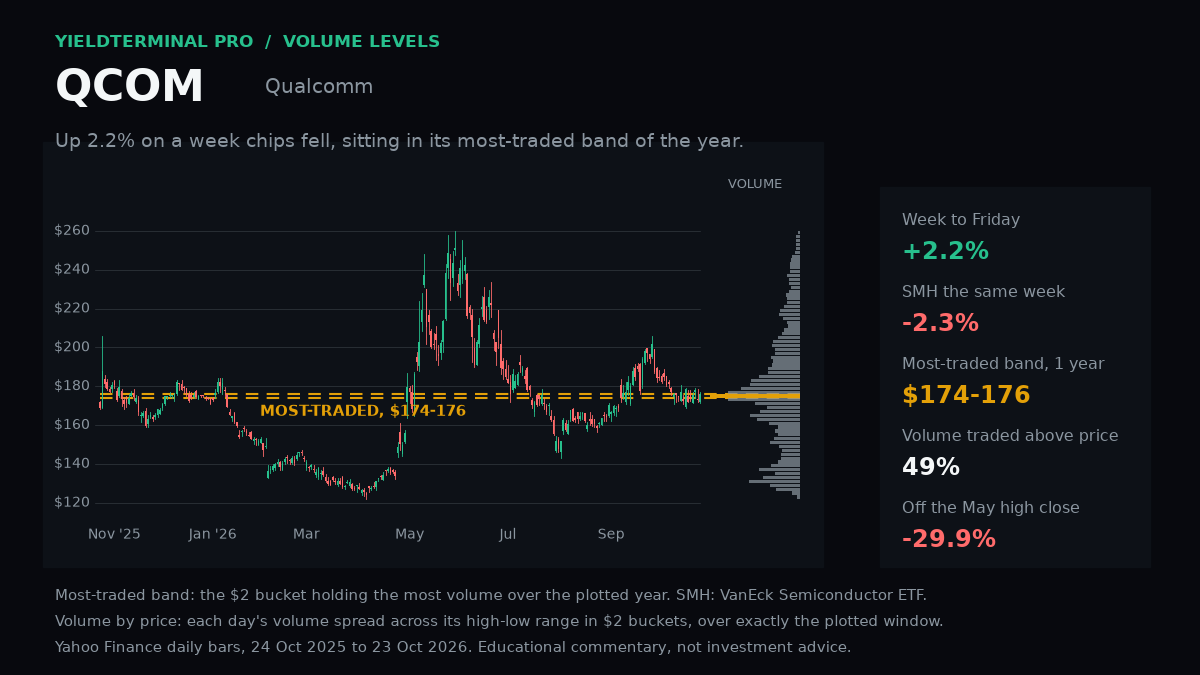
QCOM closed at 175.91 on 23 October, inside its most-traded $2 band of the year, $174-176. It rose 2.2% on the week while SMH fell 2.3%.
No session has closed since this was published.
QUALCOMM Incorporated - October 25 volume levels
Each note as it was published, with the price that followed. We publish where price sits against its own levels, not where it is going, so nothing here is scored as right or wrong. Educational commentary, not investment advice.
8 notes, newest first, back to Fri, 2 Oct 2026.
Every level we marked, and what price did next. Free, Sundays.
Subscribing signs you up for the free YieldTerminal Sunday recap, one email a week. Educational only, not financial advice. Unsubscribe any time.
175.91 23 October 2026 close
QCOM closed at 175.91 on 23 October, inside its most-traded $2 band of the year, $174-176. It rose 2.2% on the week while SMH fell 2.3%.
No session has closed since this was published.
175.22 October 15 regular-session snapshot 2026-10-15T10:45:06-04:00
QCOM: $175.22 (+1.51% versus October 14 regular close) at the October 15 10:45 a.m. ET regular-session snapshot.
| After | Close | vs Thu, 15 Oct 2026 close | vs published price |
|---|---|---|---|
| 1 session | 172.11 | -3.53% | -1.77% |
| 5 sessions | 172.83 | -3.12% | -1.36% |
This note was marked to a October 15 regular-session snapshot 2026-10-15T10:45:06-04:00, not a close. The like-for-like column is the one measured from the Thu, 15 Oct 2026 close.

176.255 October 15 regular-session observation (refreshed Version 2)
QCOM: $176.26 (+2.11% versus October 14 regular close). Refreshed October 15 regular-session snapshot, Version 2.
| After | Close | vs Thu, 15 Oct 2026 close | vs published price |
|---|---|---|---|
| 1 session | 172.11 | — | -2.35% |
| 5 sessions | 172.83 | — | -1.94% |
This note was marked to a October 15 regular-session observation (refreshed Version 2), not a close. The like-for-like column is the one measured from the Thu, 15 Oct 2026 close.

176.14 October 15 regular-session observation — research edition
QCOM: $176.14 (+2.04% versus October 14 close). Research edition with dated reference levels.
| After | Close | vs Thu, 15 Oct 2026 close | vs published price |
|---|---|---|---|
| 1 session | 172.11 | — | -2.29% |
| 5 sessions | 172.83 | — | -1.88% |
This note was marked to a October 15 regular-session observation — research edition, not a close. The like-for-like column is the one measured from the Thu, 15 Oct 2026 close.

172.62 October 14 regular close
QCOM: closing decline -41.20%; separate rebound from the trough to October 14 +16.94%.
| After | Close | vs Thu, 15 Oct 2026 close | vs published price |
|---|---|---|---|
| 1 session | 172.11 | — | -0.30% |
| 5 sessions | 172.83 | — | +0.12% |

172.62 October 14 regular close
Matched price returns: QCOM +6.70%, ARM +38.43%, SPY +16.07%.
| After | Close | vs Thu, 15 Oct 2026 close | vs published price |
|---|---|---|---|
| 1 session | 172.11 | — | -0.30% |
| 5 sessions | 172.83 | — | +0.12% |

181.82 last trade, 13:33 ET
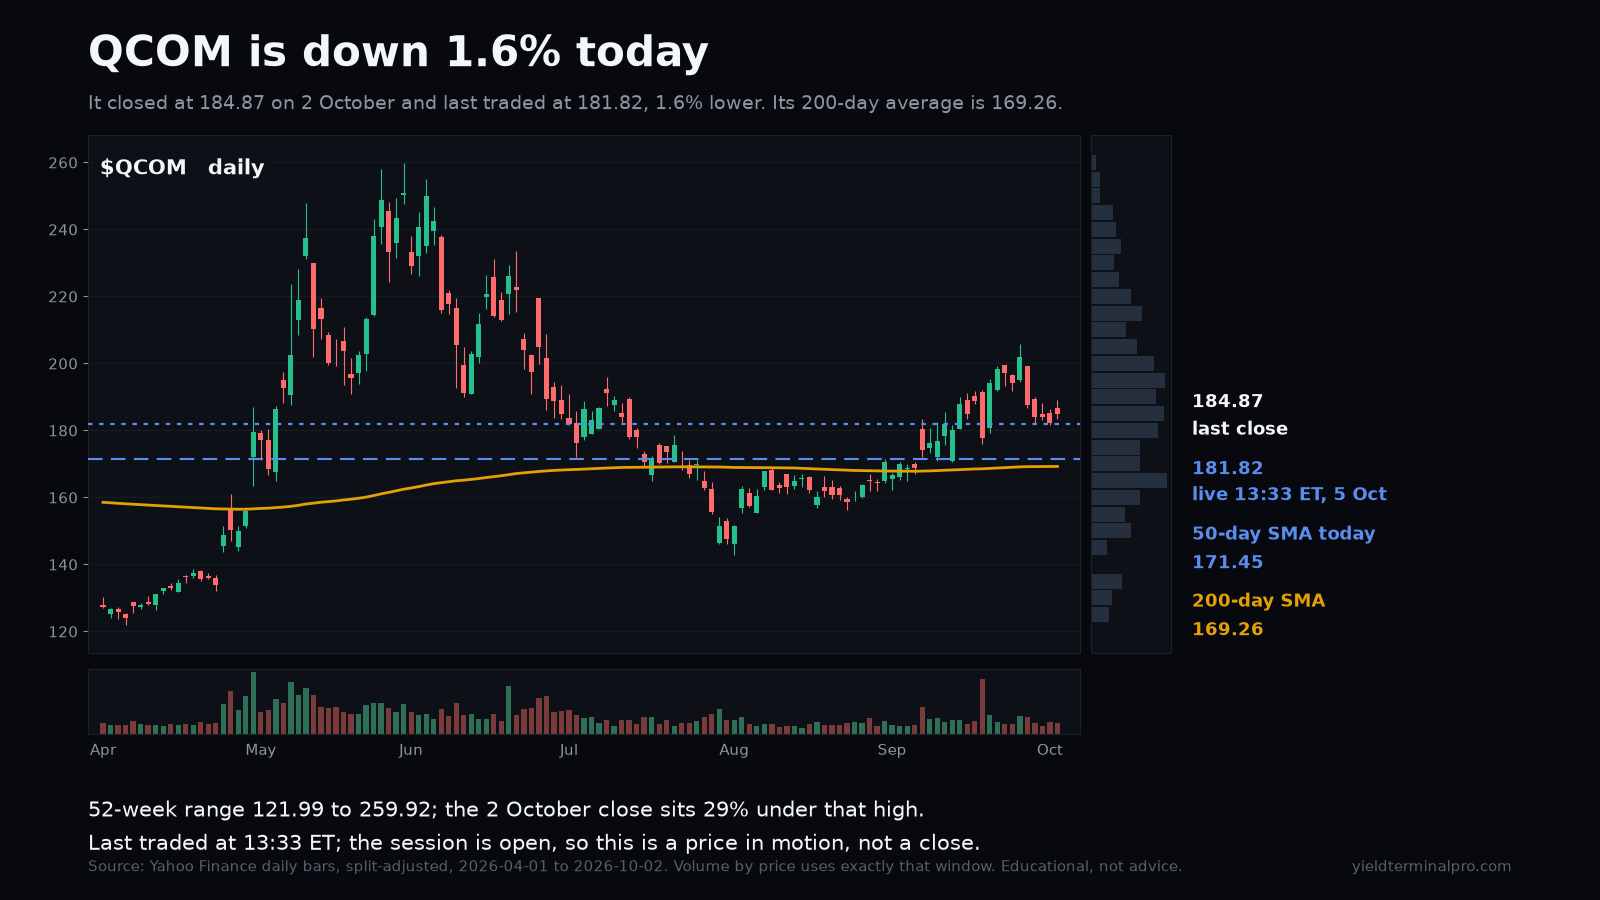
QCOM is 1.6% lower in the session, last traded at 181.82 against a 184.87 close on 2 October.
| After | Close | vs Mon, 5 Oct 2026 close | vs published price |
|---|---|---|---|
| 1 session | 181.03 | +0.13% | -0.43% |
| 5 sessions | 174.43 | -3.52% | -4.06% |
This note was marked to a last trade, 13:33 ET, not a close. The like-for-like column is the one measured from the Mon, 5 Oct 2026 close.
182.09 1 Oct close
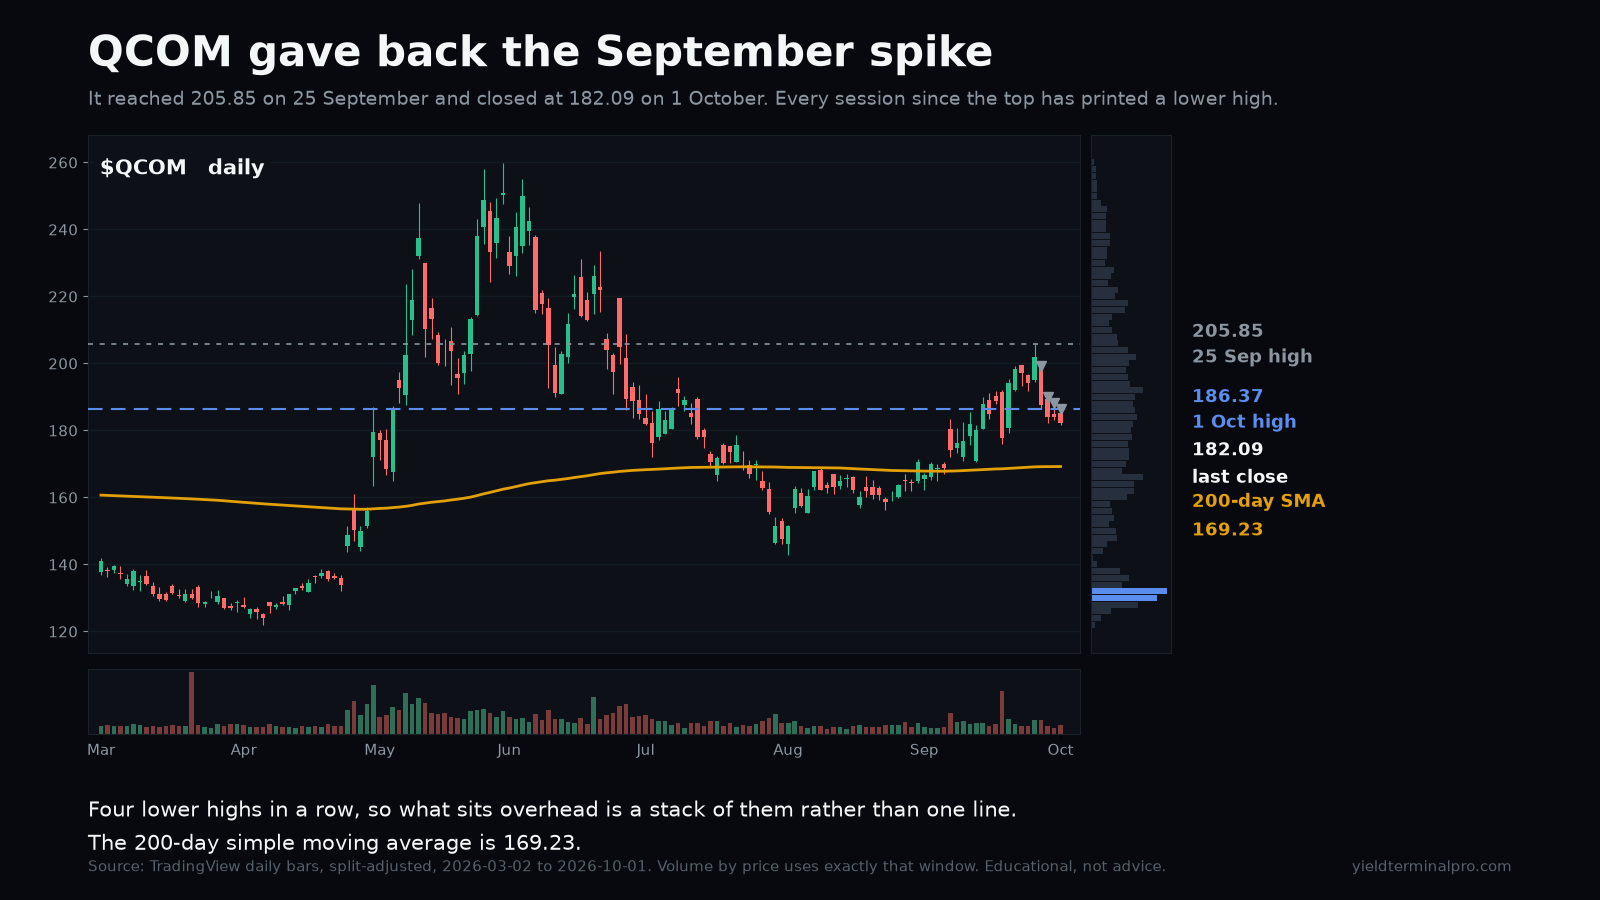
Qualcomm gave back the September spike in four sessions, and every one of them printed a lower high. What sits overhead is a stack of highs, not a single line to clear.
| After | Close | vs Fri, 2 Oct 2026 close | vs published price |
|---|---|---|---|
| 1 session | 180.79 | — | -0.71% |
| 5 sessions | 175.50 | — | -3.62% |
See the full disclaimer.