Tue, 6 Oct 2026
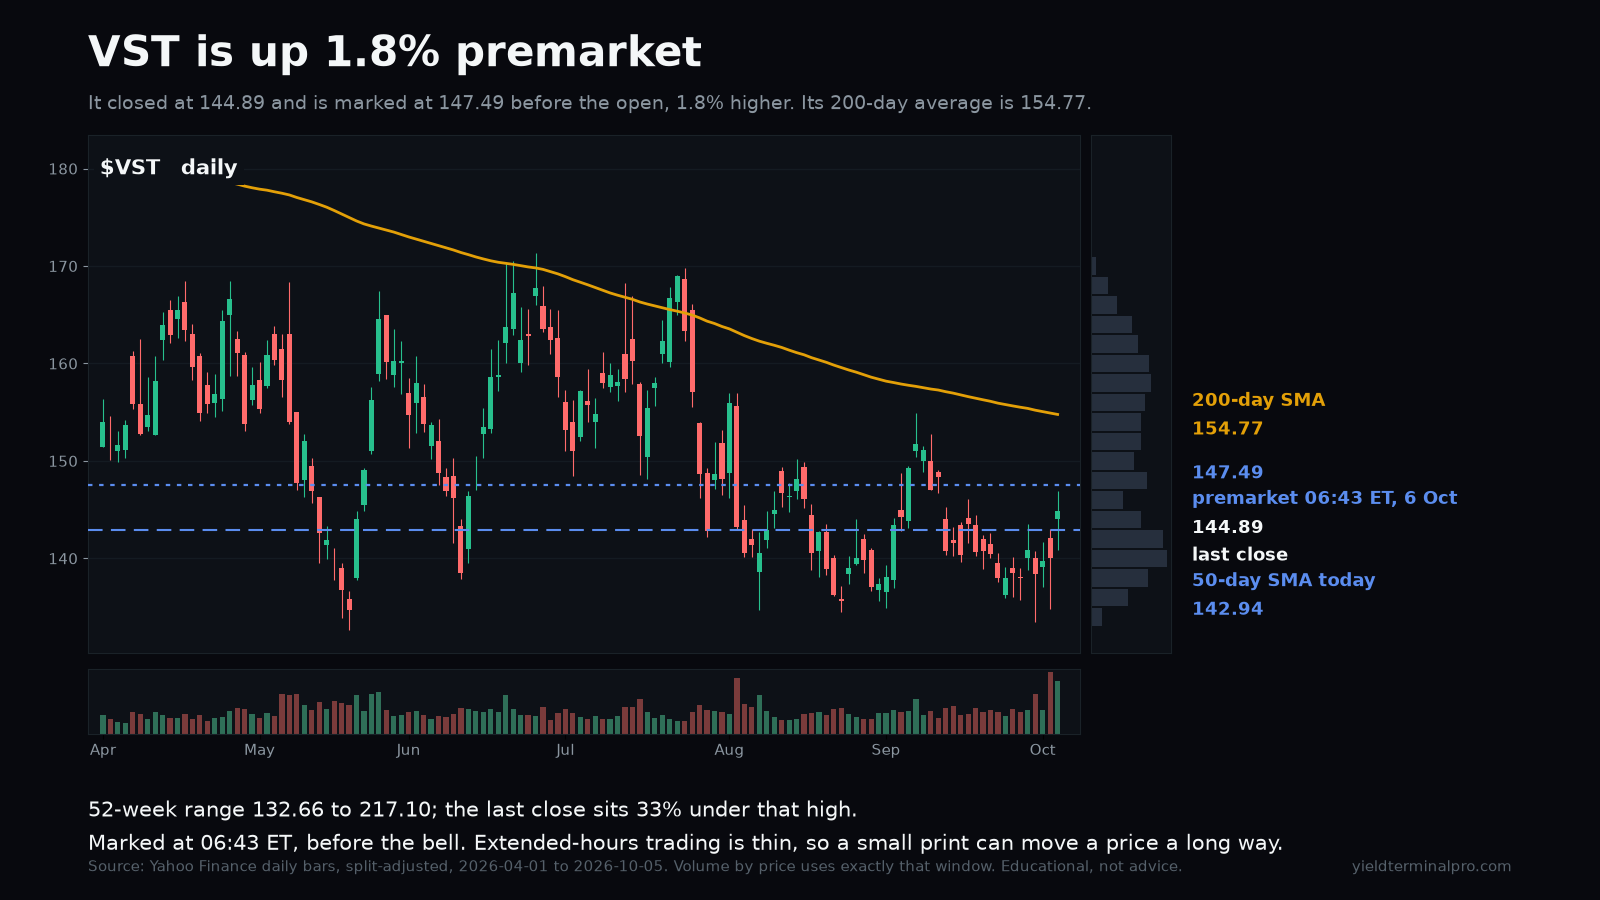
147.49 premarket print, 06:43 ET
VST is 1.8% higher premarket, marked at 147.49 against a 144.89 close.
No session has closed since this was published.
Vistra Corp.
Each note as it was published, with the price that followed. We publish where price sits against its own levels, not where it is going, so nothing here is scored as right or wrong. Educational commentary, not investment advice.
4 notes, newest first, back to Sat, 3 Oct 2026.
147.49 premarket print, 06:43 ET
VST is 1.8% higher premarket, marked at 147.49 against a 144.89 close.
No session has closed since this was published.
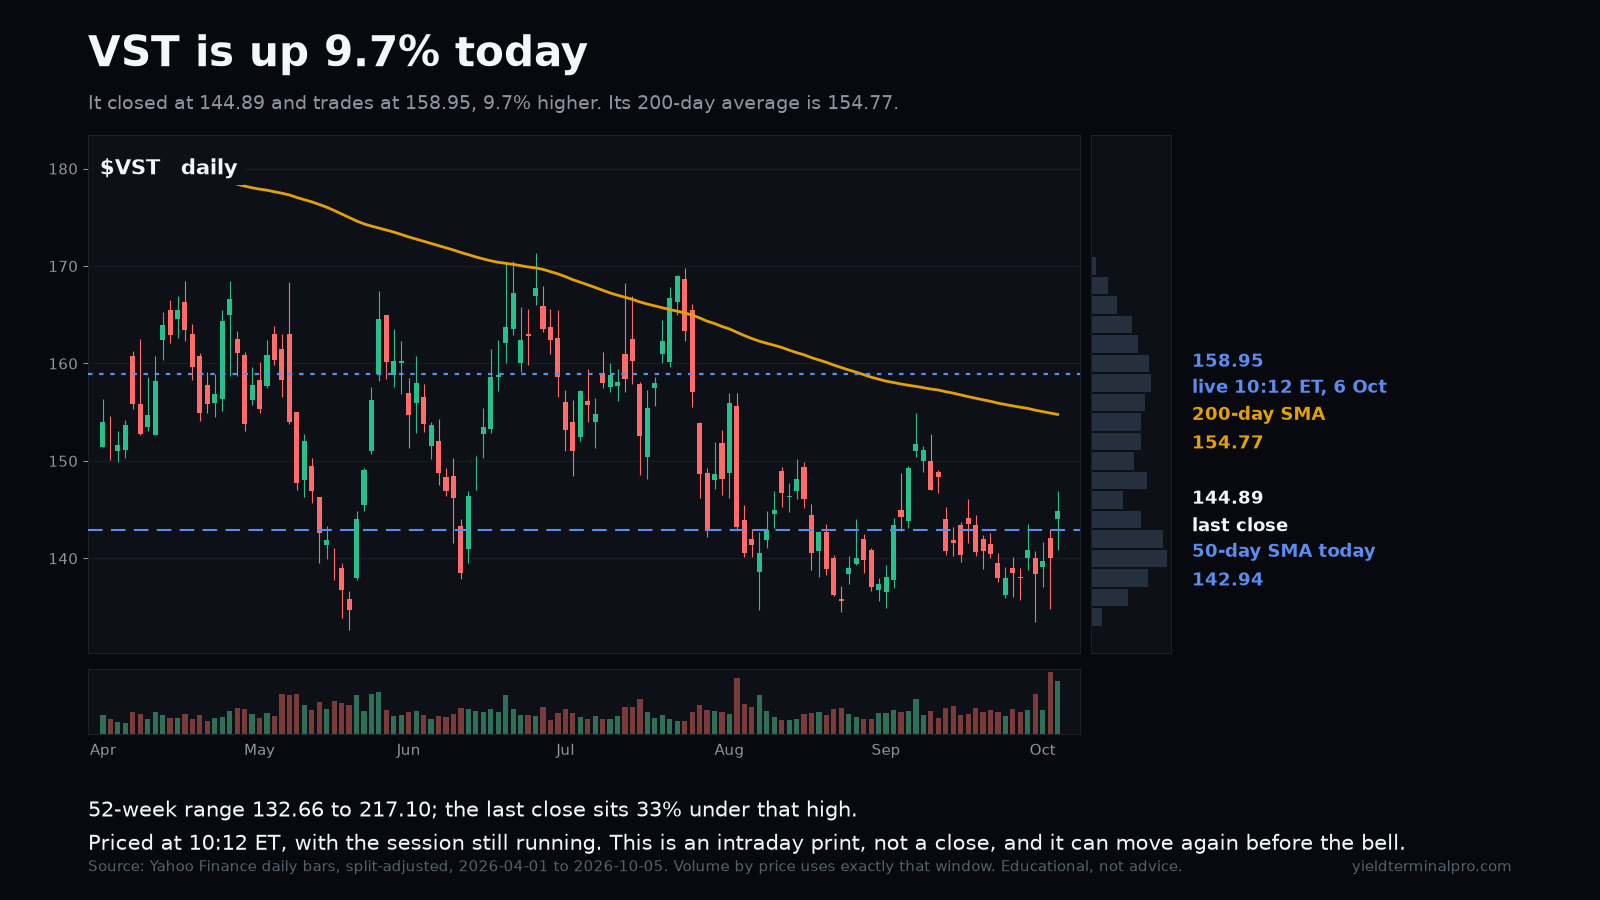
158.95 live session print, 10:12 ET
VST is 9.7% higher at 158.95 against a 144.89 close, priced at 10:12 ET with the session still running.
No session has closed since this was published.
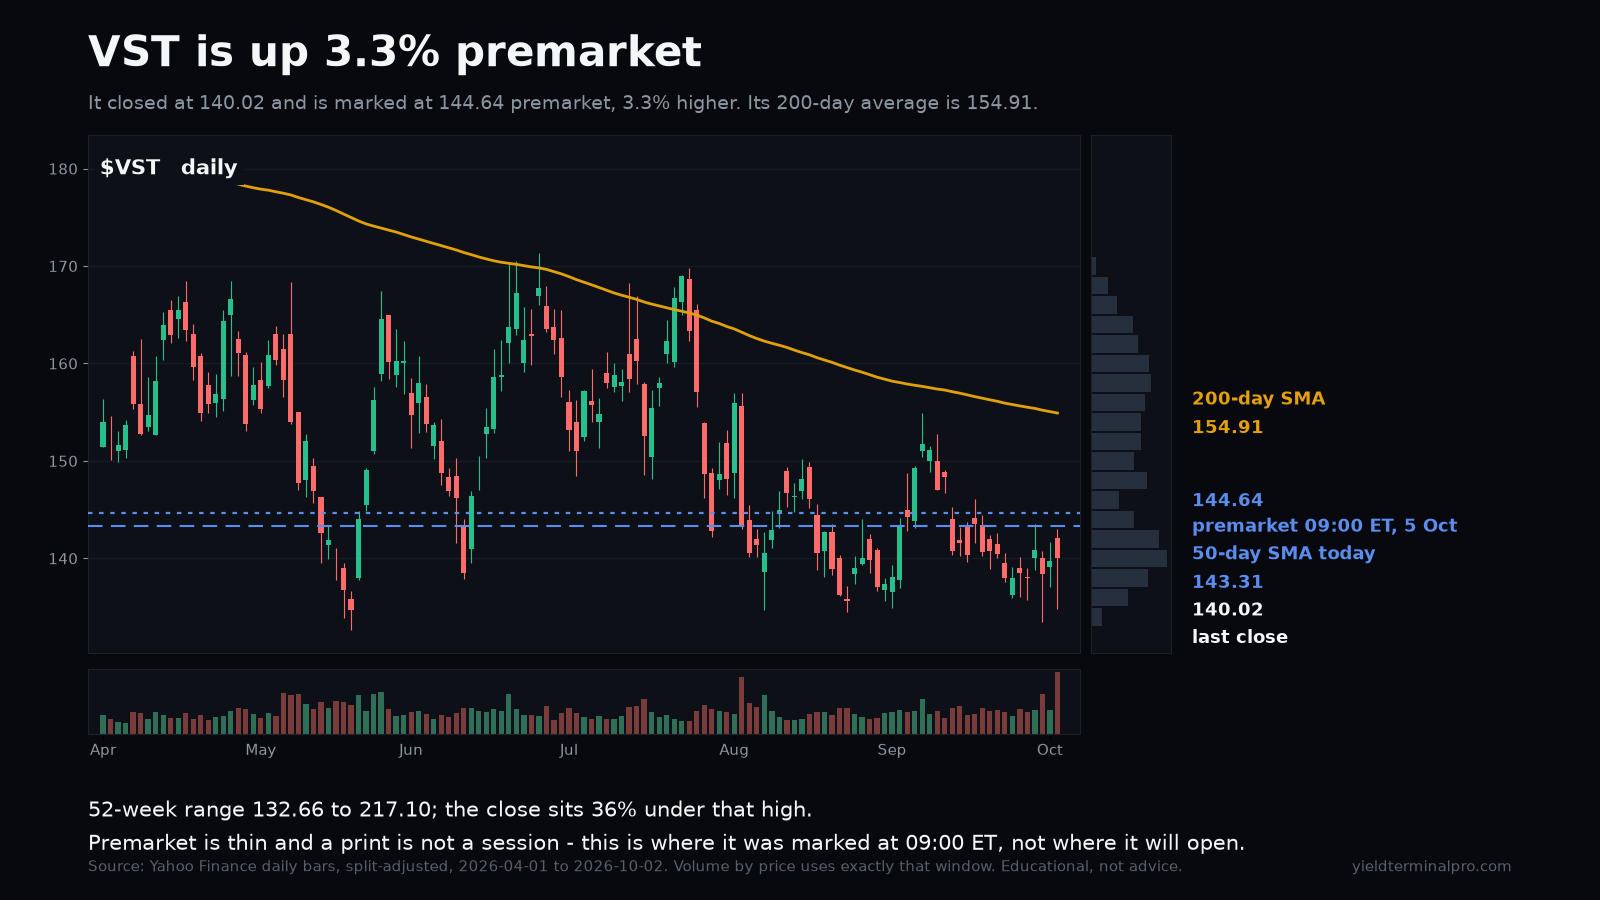
144.64 premarket print, 09:00 ET
VST is 3.3% higher premarket, marked at 144.64 against a 140.02 close.
No session has closed since this was published.
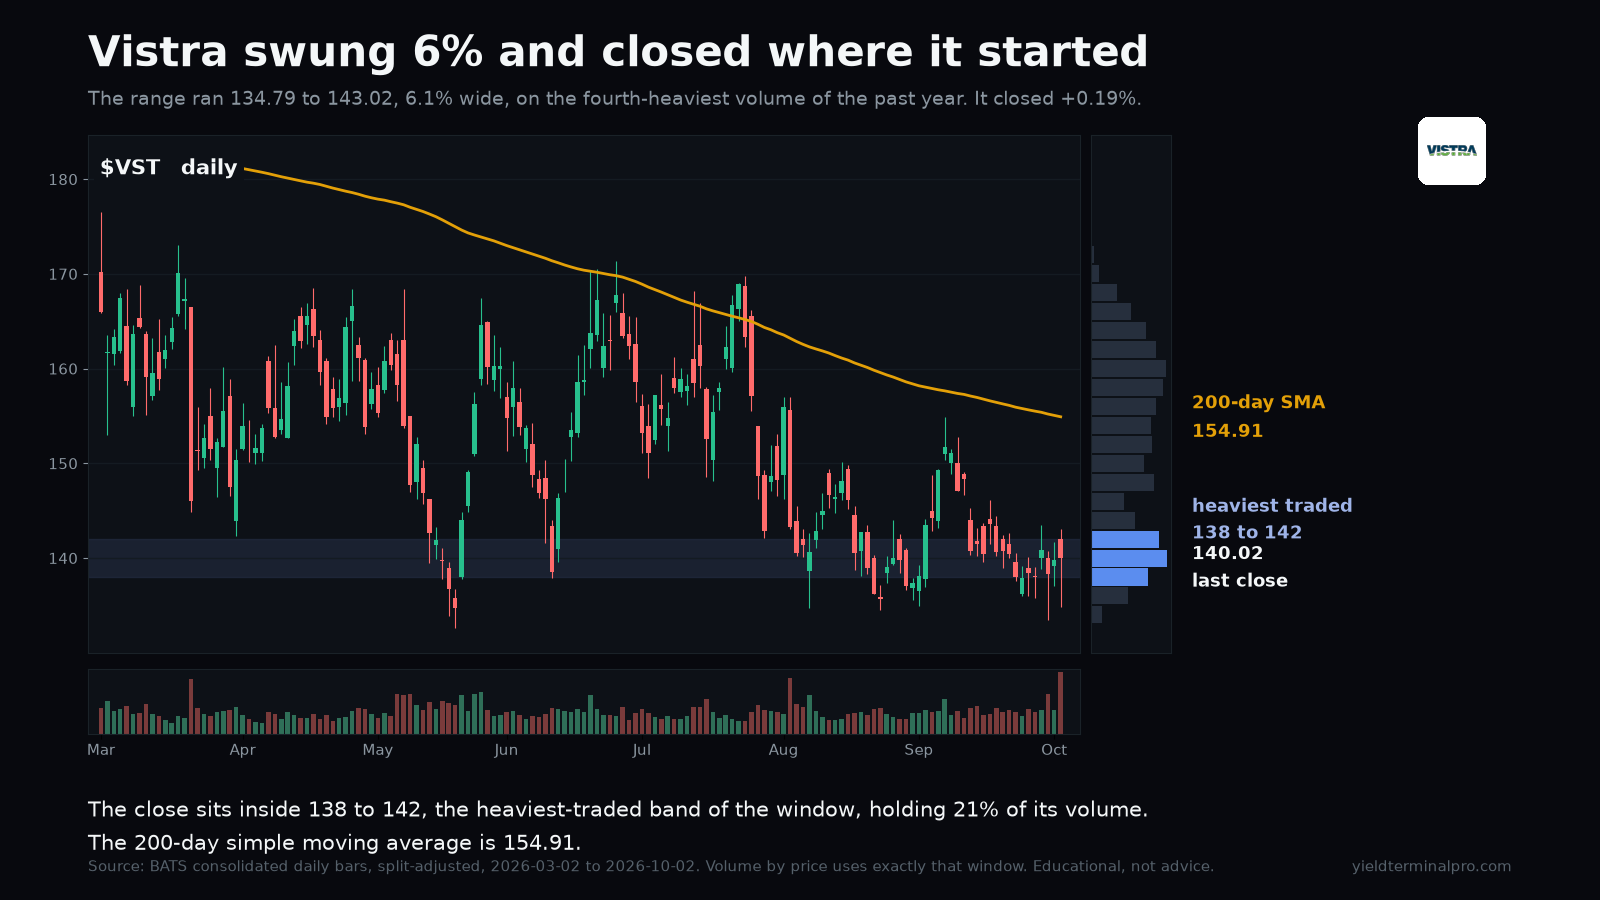
140.02 2 Oct close
Vistra travelled a 6.1% range on the fourth-heaviest volume of the past year and closed 0.19% higher, inside the heaviest-traded band of the window. All of that movement bought no net change in position.
| After | Close | vs Sat, 3 Oct 2026 close | vs published price |
|---|---|---|---|
| 1 session | 144.89 | +3.48% | +3.48% |
Every level we marked, and whether price reached it. Free, Sundays.
Subscribing signs you up for the free YieldTerminal Sunday recap, one email a week. Educational only, not financial advice. Unsubscribe any time.
See the full disclaimer.