Six Morning Watch notes are preserved alongside nine completed-session After Close charts. Dated daily candles, estimated volume context and early postmarket observations are distinguished.
Get the week in one email
Every level we marked, and what price did next. Free, Sundays.
Subscribing signs you up for the free YieldTerminal Sunday recap, one email a week. Educational only, not financial advice. Unsubscribe any time.
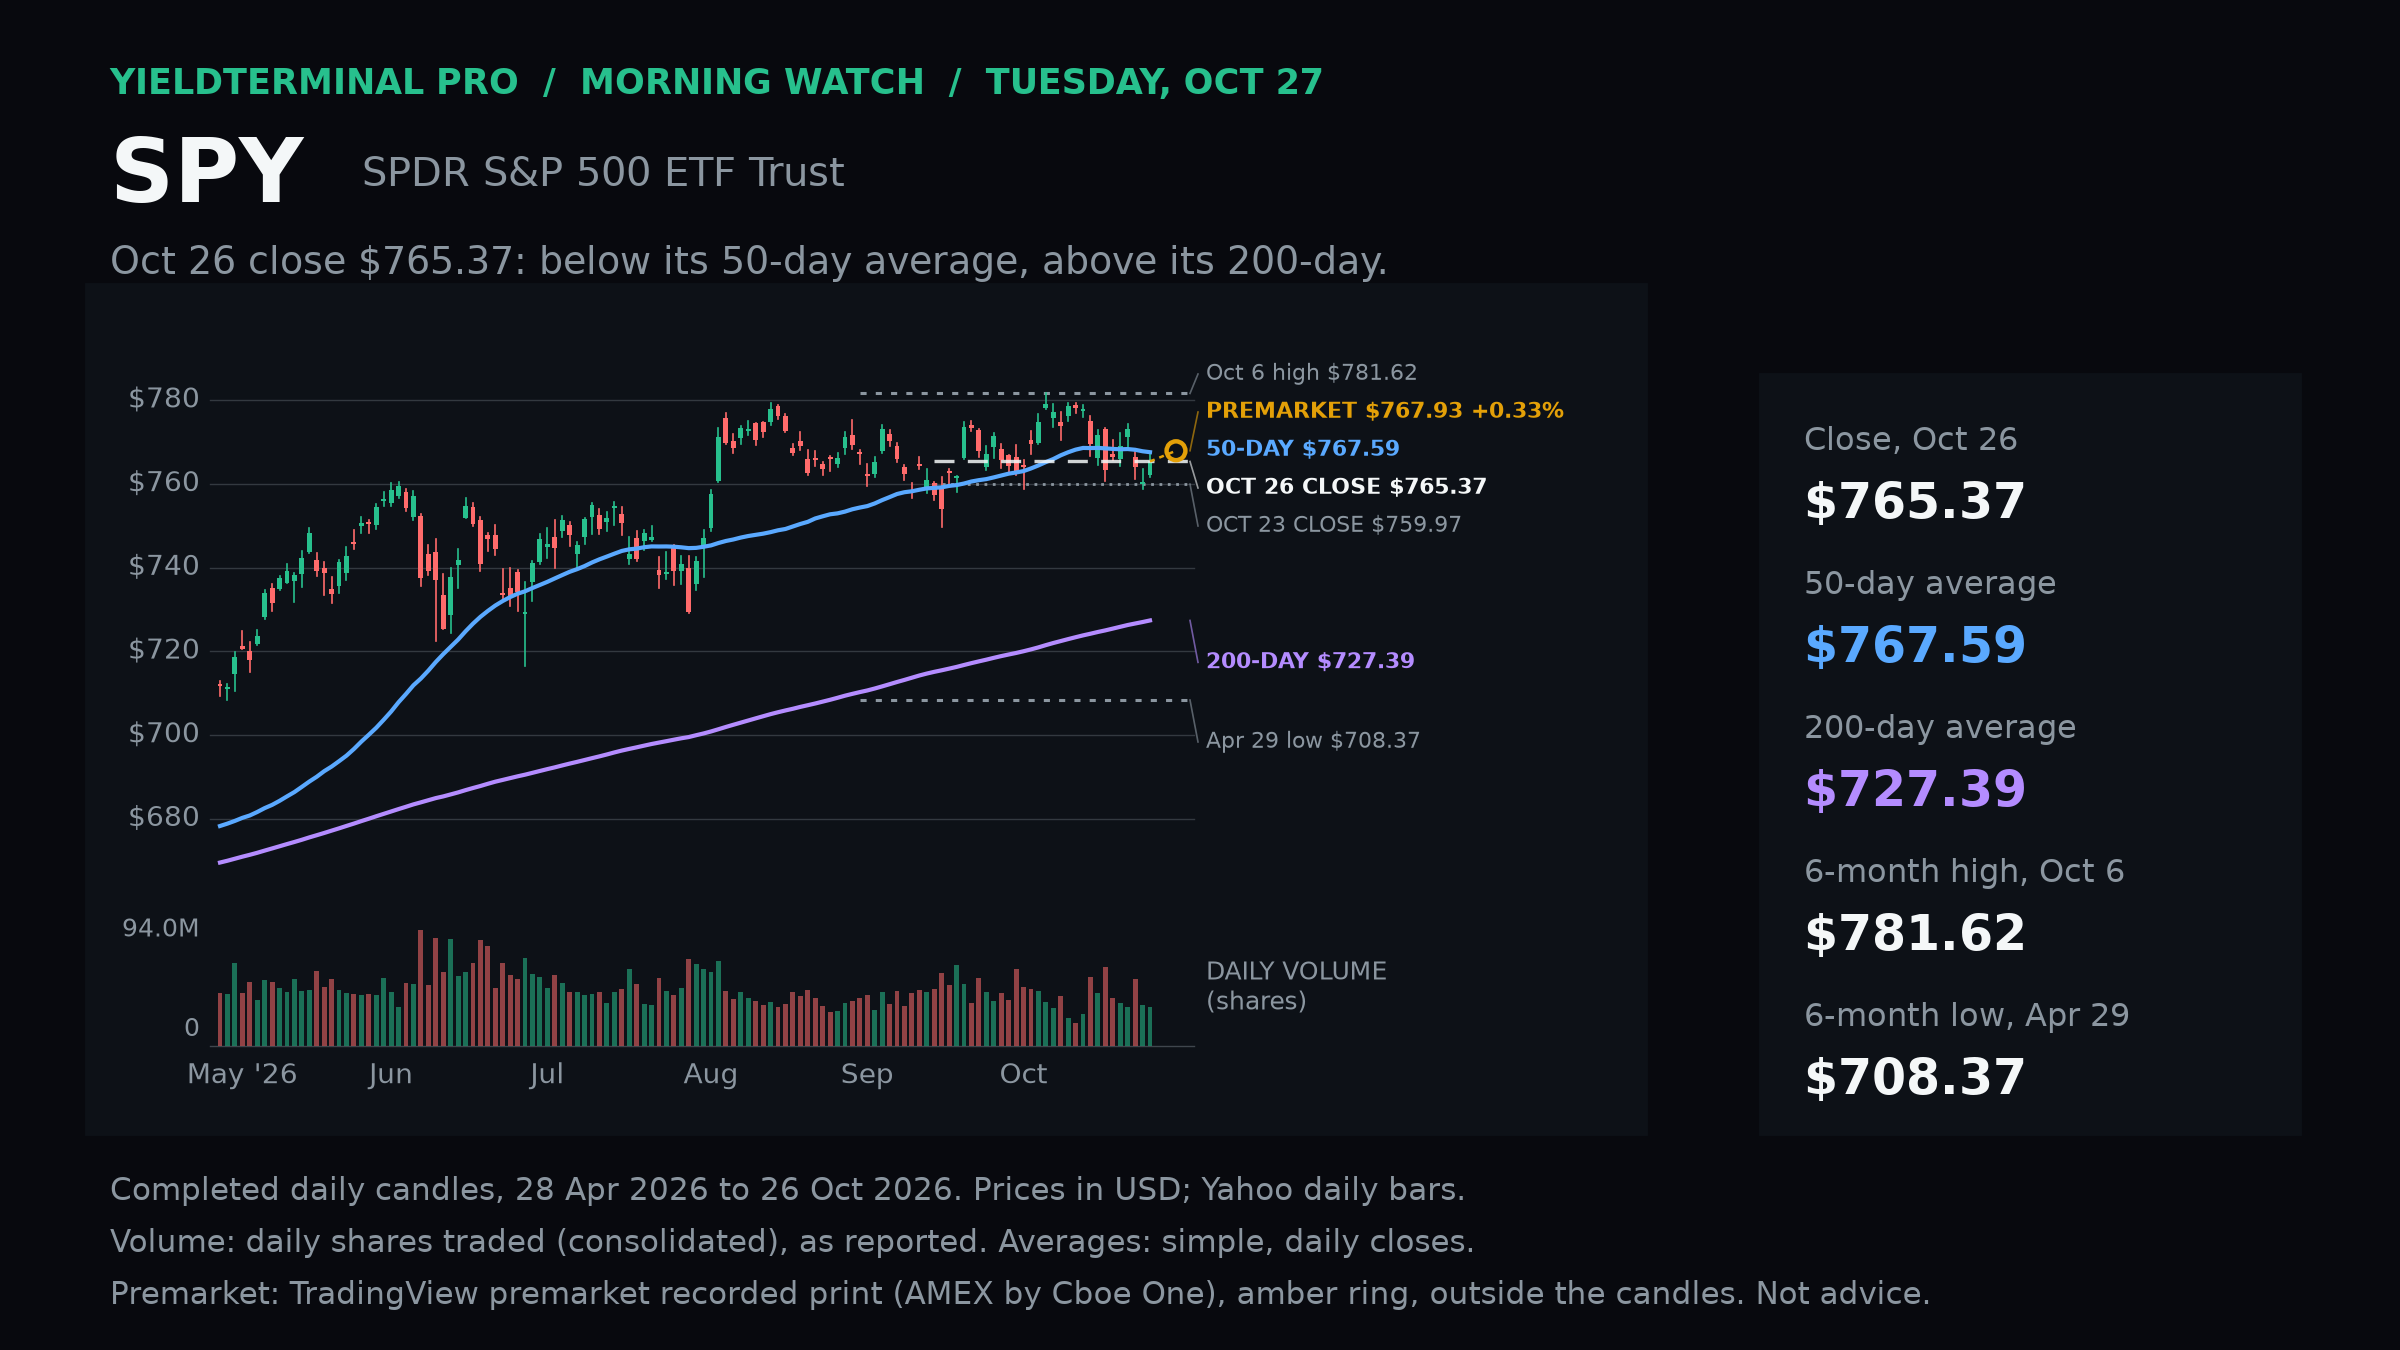
$SPYSPDR S&P 500 ETF - October 27 Morning Watch 767.93Recorded October 27 premarket observation; completed October 26 close $765.37Closed October 26 below its 50-day average; the recorded October 27 premarket print was above it.
- October 23 intraday highDated historical level from completed regular-session data.
- 763.47
- October 26 intraday lowDated historical level from completed regular-session data.
- 761.63
- 50-day SMA through October 26Dated historical level from completed regular-session data.
- 767.59
- 200-day SMA through October 26Dated historical level from completed regular-session data.
- 727.39
Levels measured over Completed U.S. regular-session daily history through October 26; recorded October 27 premarket point separately marked.. A level measured over a different window can be a different number.
 See the chart on X →
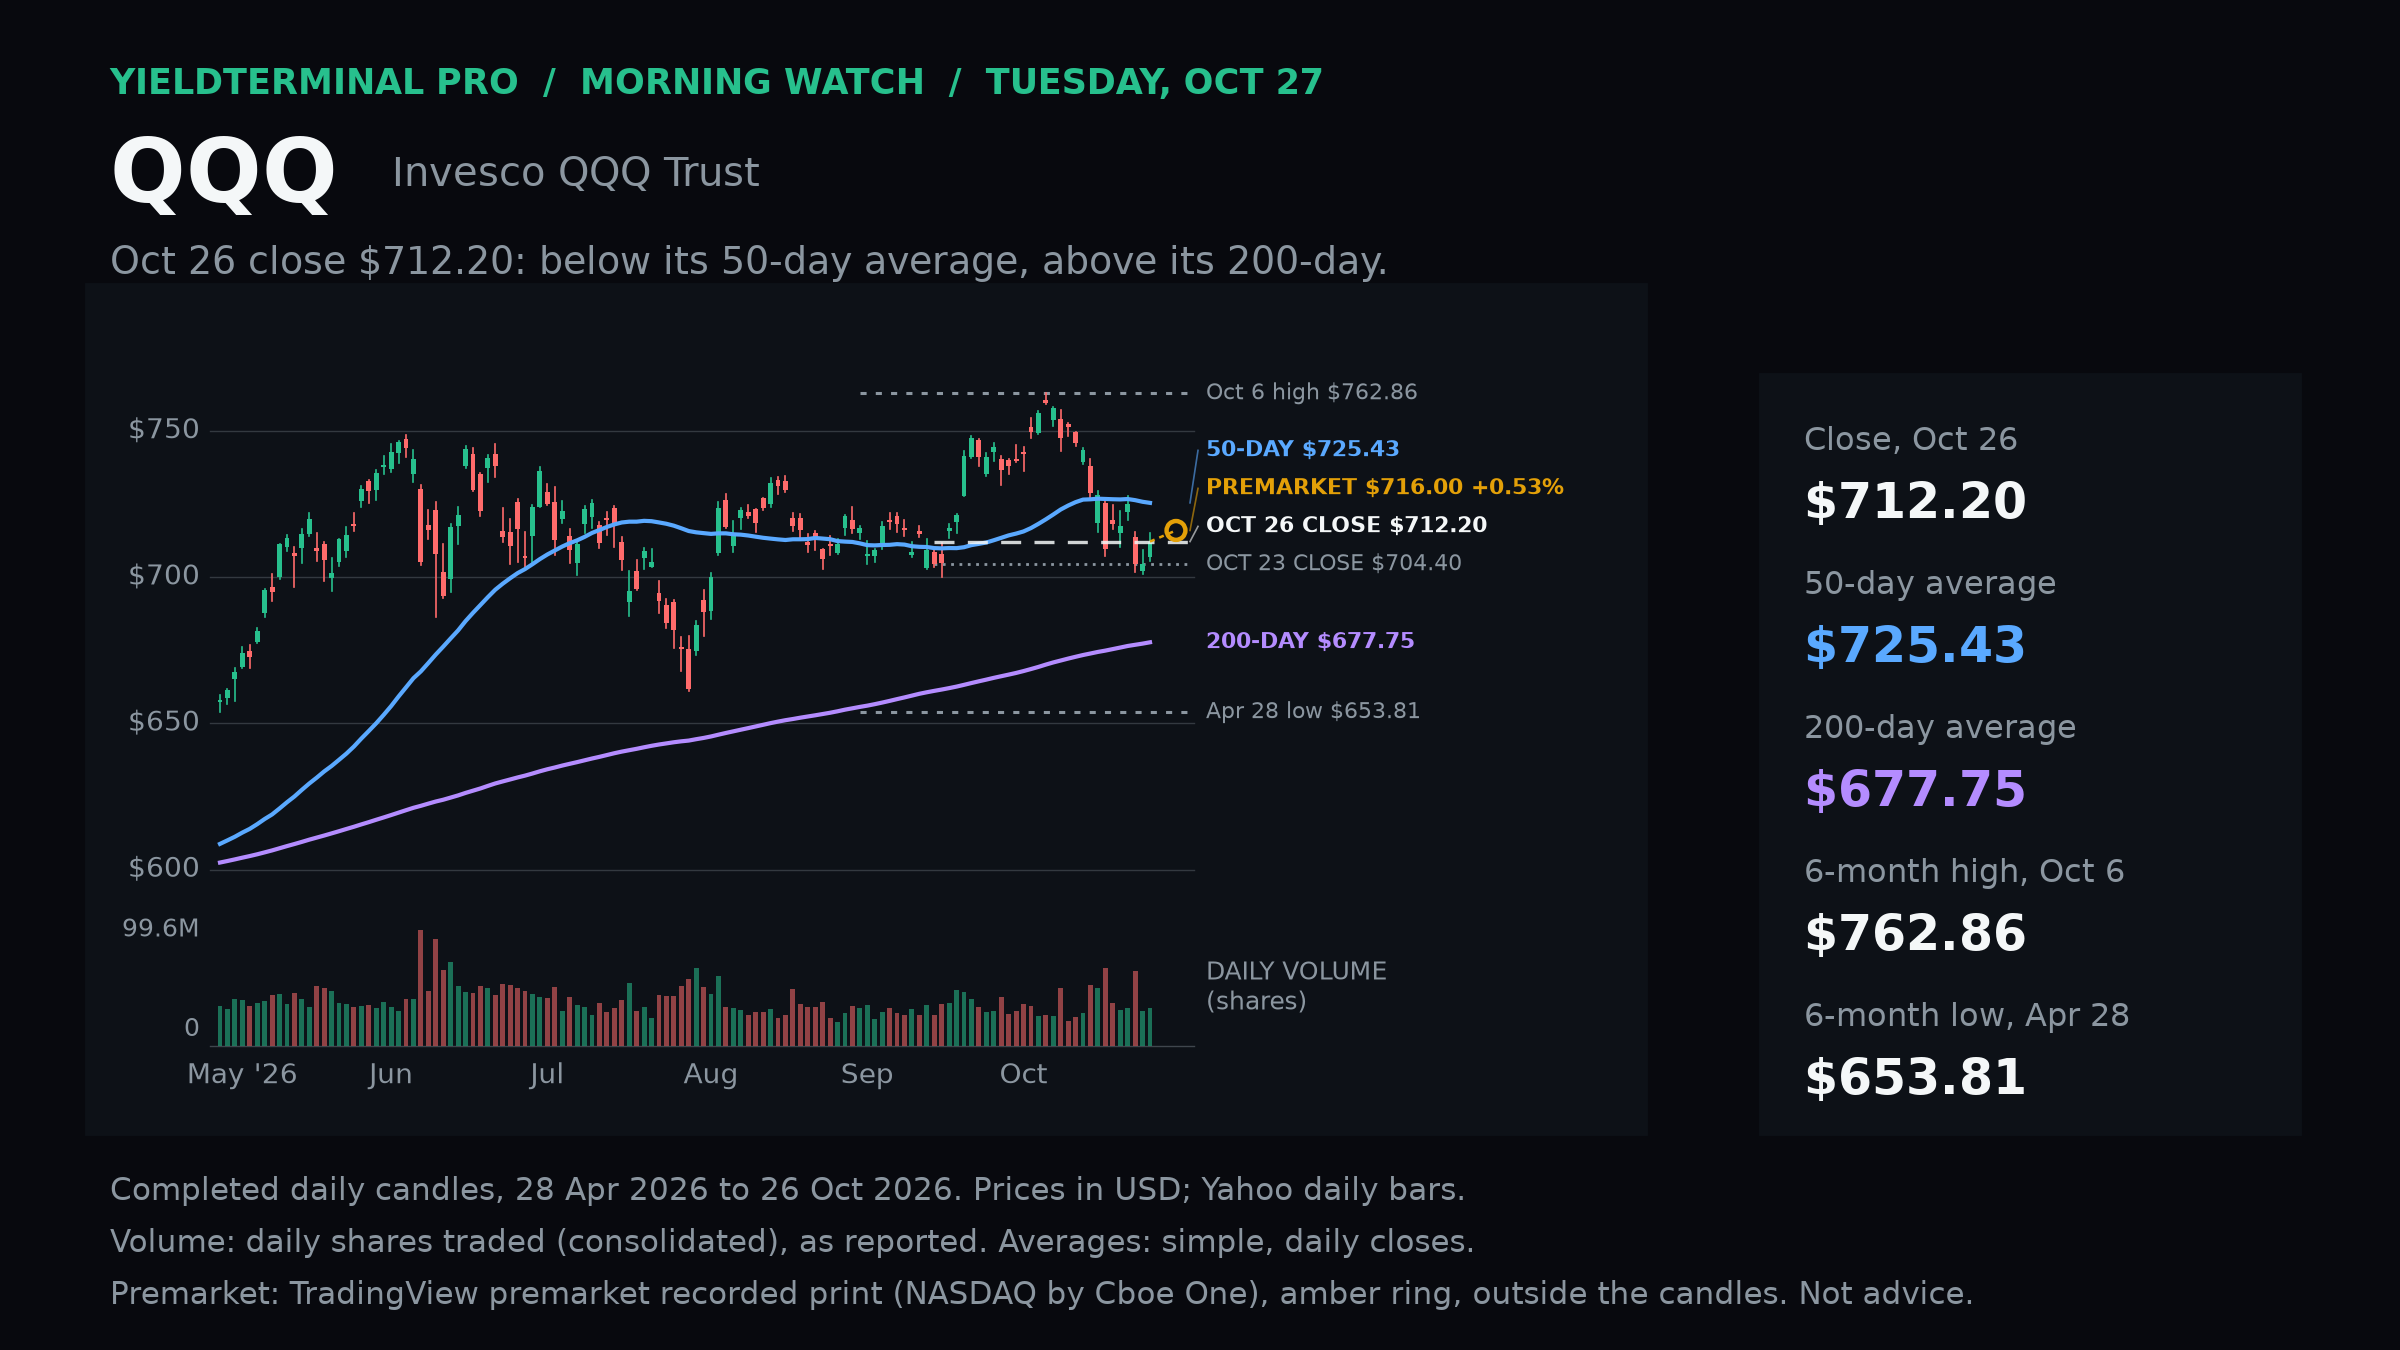
$QQQInvesco QQQ Trust - October 27 Morning Watch 716.00Recorded October 27 premarket observation; completed October 26 close $712.20Closed October 26 above the October 23 high but below its 50-day average.
- October 23 intraday highDated historical level from completed regular-session data.
- 709.30
- October 26 intraday lowDated historical level from completed regular-session data.
- 705.58
- 50-day SMA through October 26Dated historical level from completed regular-session data.
- 725.43
- 200-day SMA through October 26Dated historical level from completed regular-session data.
- 677.75
Levels measured over Completed U.S. regular-session daily history through October 26; recorded October 27 premarket point separately marked.. A level measured over a different window can be a different number.
 See the chart on X →
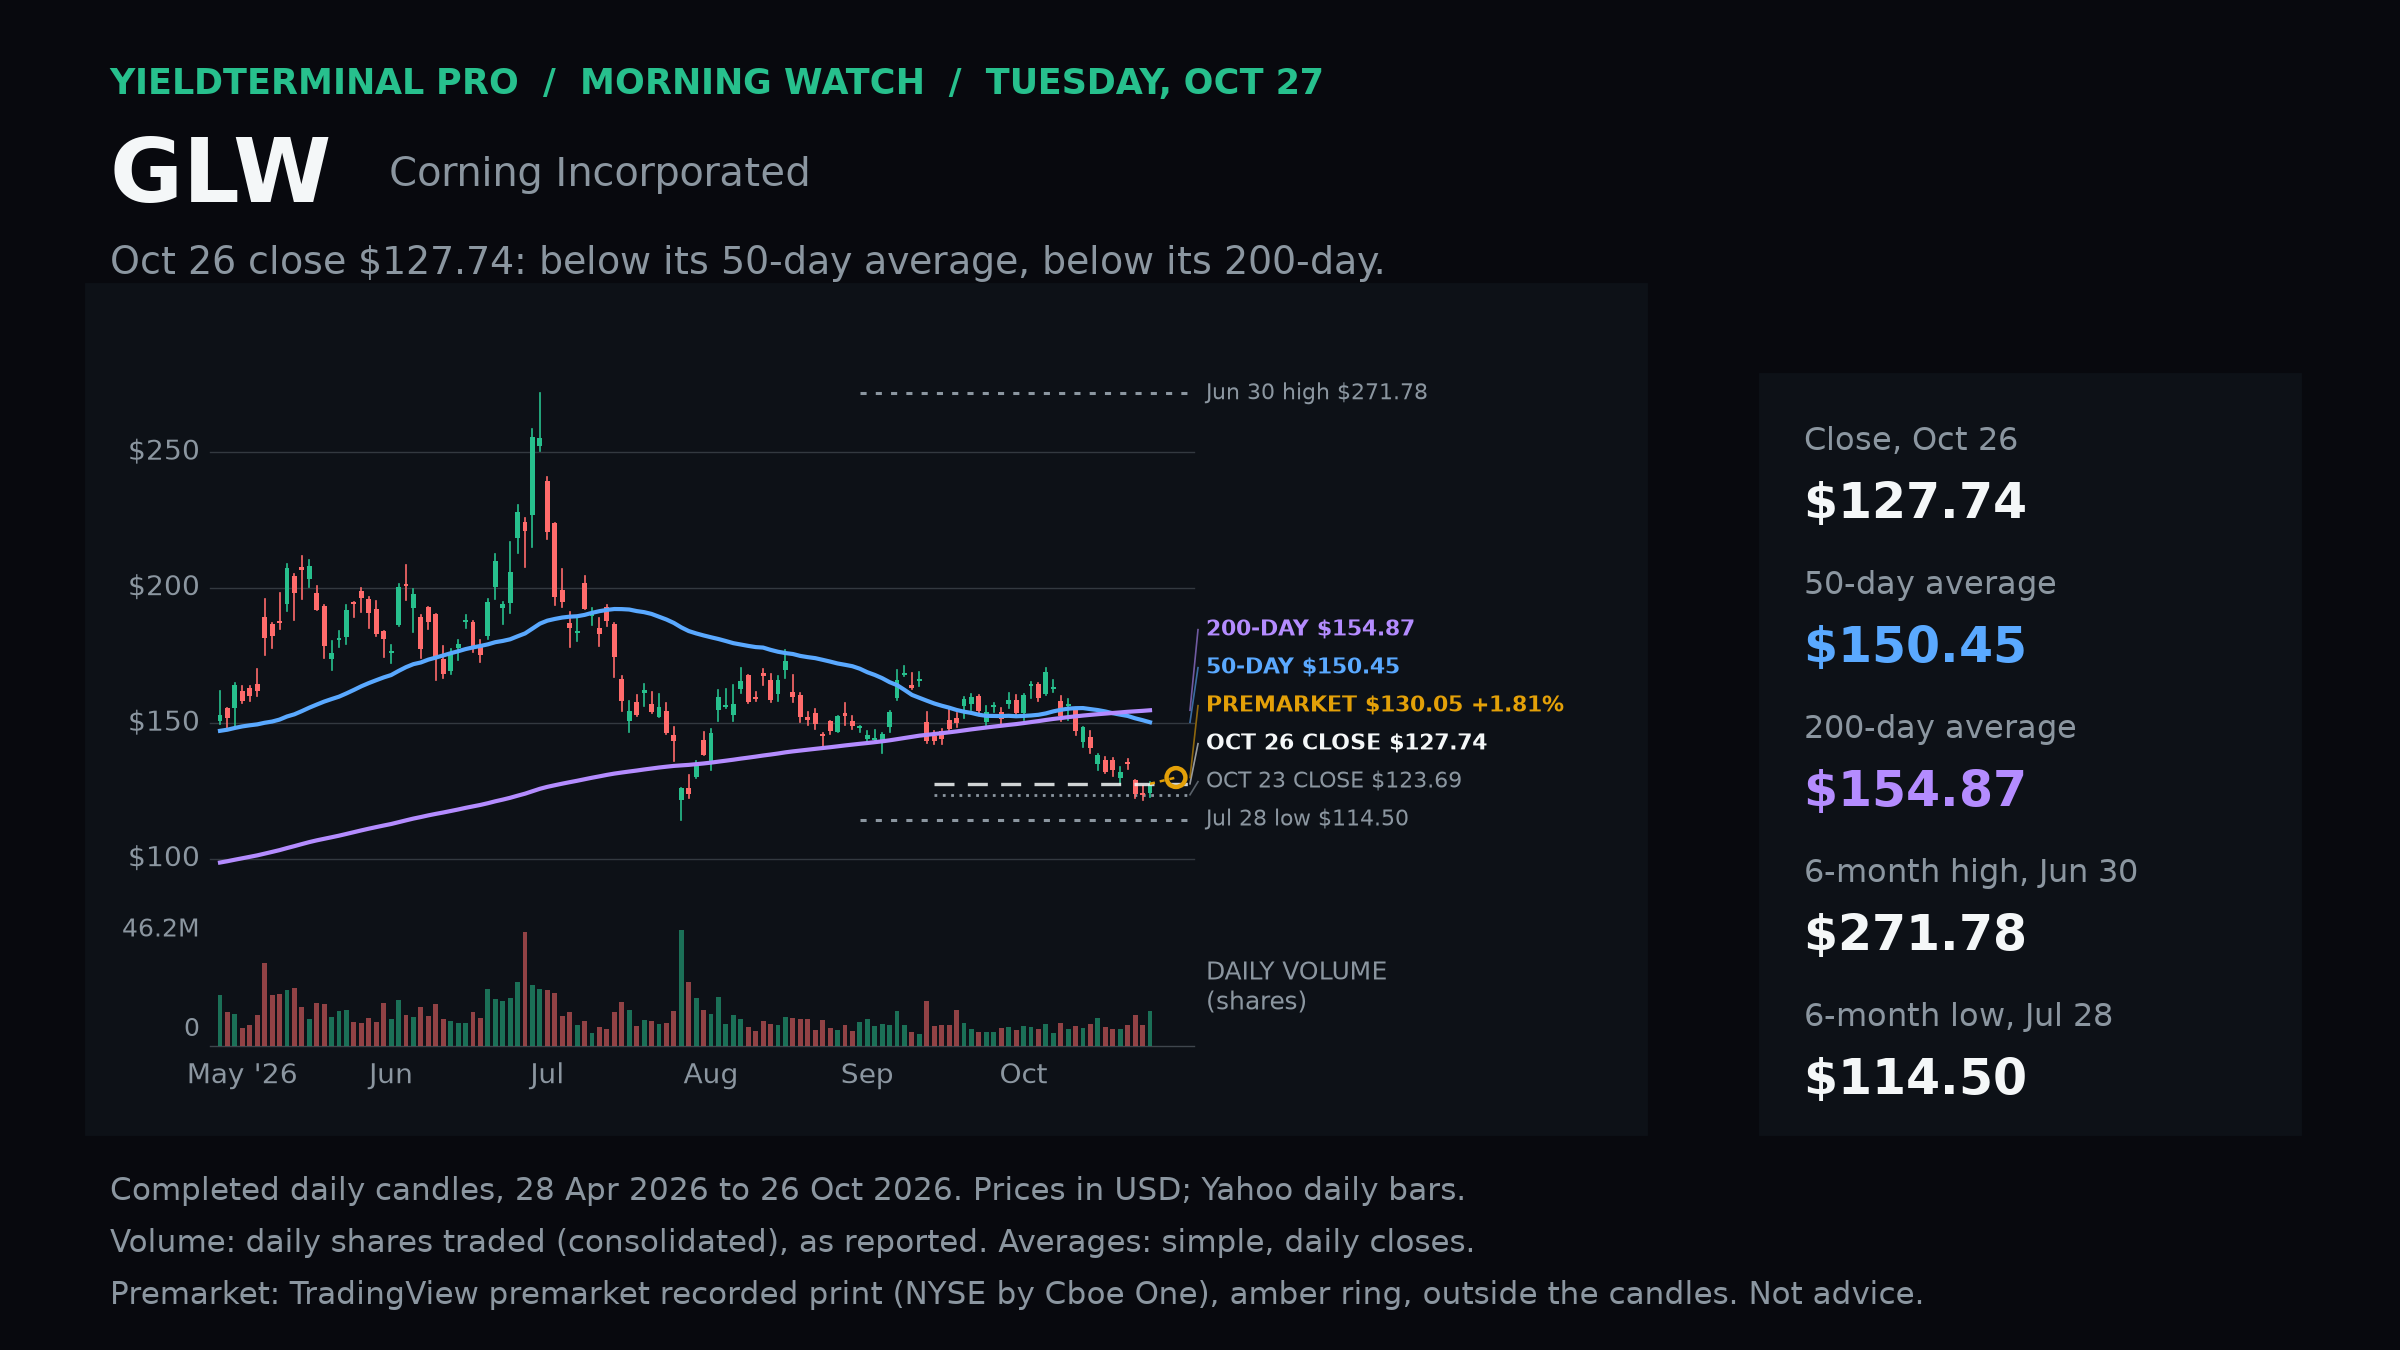
$GLWCorning - October 27 Morning Watch 130.05Recorded October 27 premarket observation; completed October 26 close $127.74Recorded October 27 premarket print cleared the October 26 intraday high; only a completed daily close can confirm.
- October 26 intraday highDated historical level from completed regular-session data.
- 128.58
- October 26 intraday lowDated historical level from completed regular-session data.
- 122.75
- 50-day SMA through October 26Dated historical level from completed regular-session data.
- 150.45
- 200-day SMA through October 26Dated historical level from completed regular-session data.
- 154.87
Levels measured over Completed U.S. regular-session daily history through October 26; recorded October 27 premarket point separately marked.. A level measured over a different window can be a different number.
 See the chart on X →
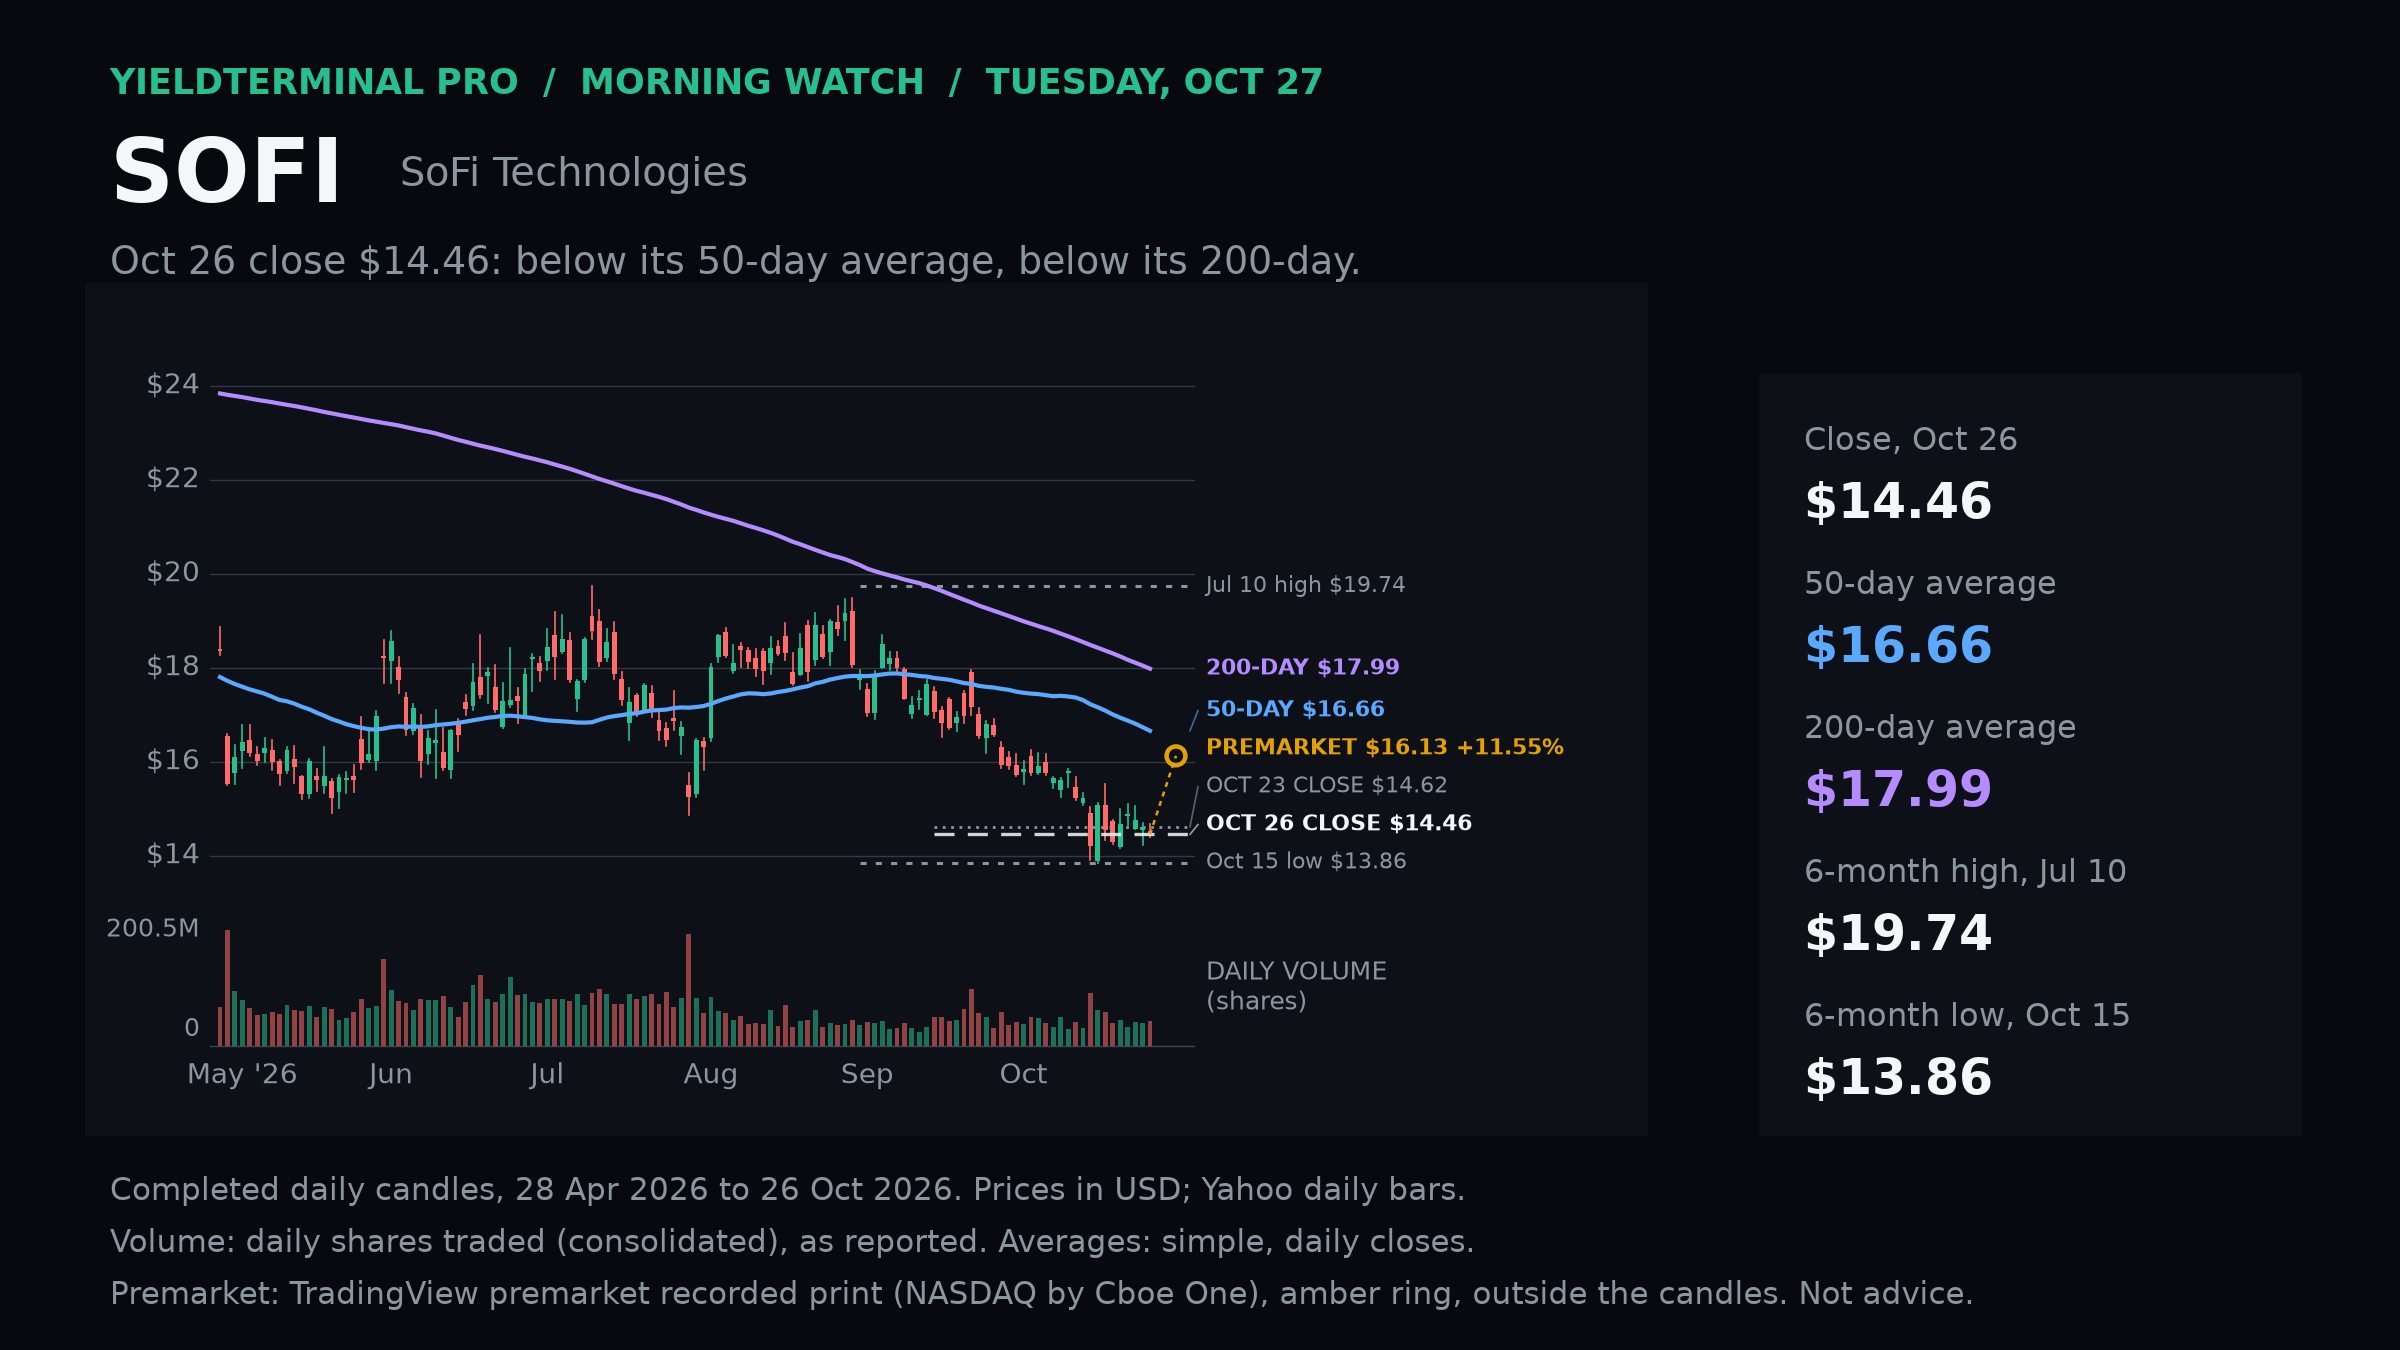
$SOFISoFi Technologies - October 27 Morning Watch 16.13Recorded October 27 premarket observation; completed October 26 close $14.46Recorded October 27 premarket print exceeded the October 26 intraday high after reported Q3 results.
- October 26 intraday highDated historical level from completed regular-session data.
- 14.67
- October 26 intraday lowDated historical level from completed regular-session data.
- 14.40
- 50-day SMA through October 26Dated historical level from completed regular-session data.
- 16.66
- 200-day SMA through October 26Dated historical level from completed regular-session data.
- 17.99
Levels measured over Completed U.S. regular-session daily history through October 26; recorded October 27 premarket point separately marked.. A level measured over a different window can be a different number.
 See the chart on X →
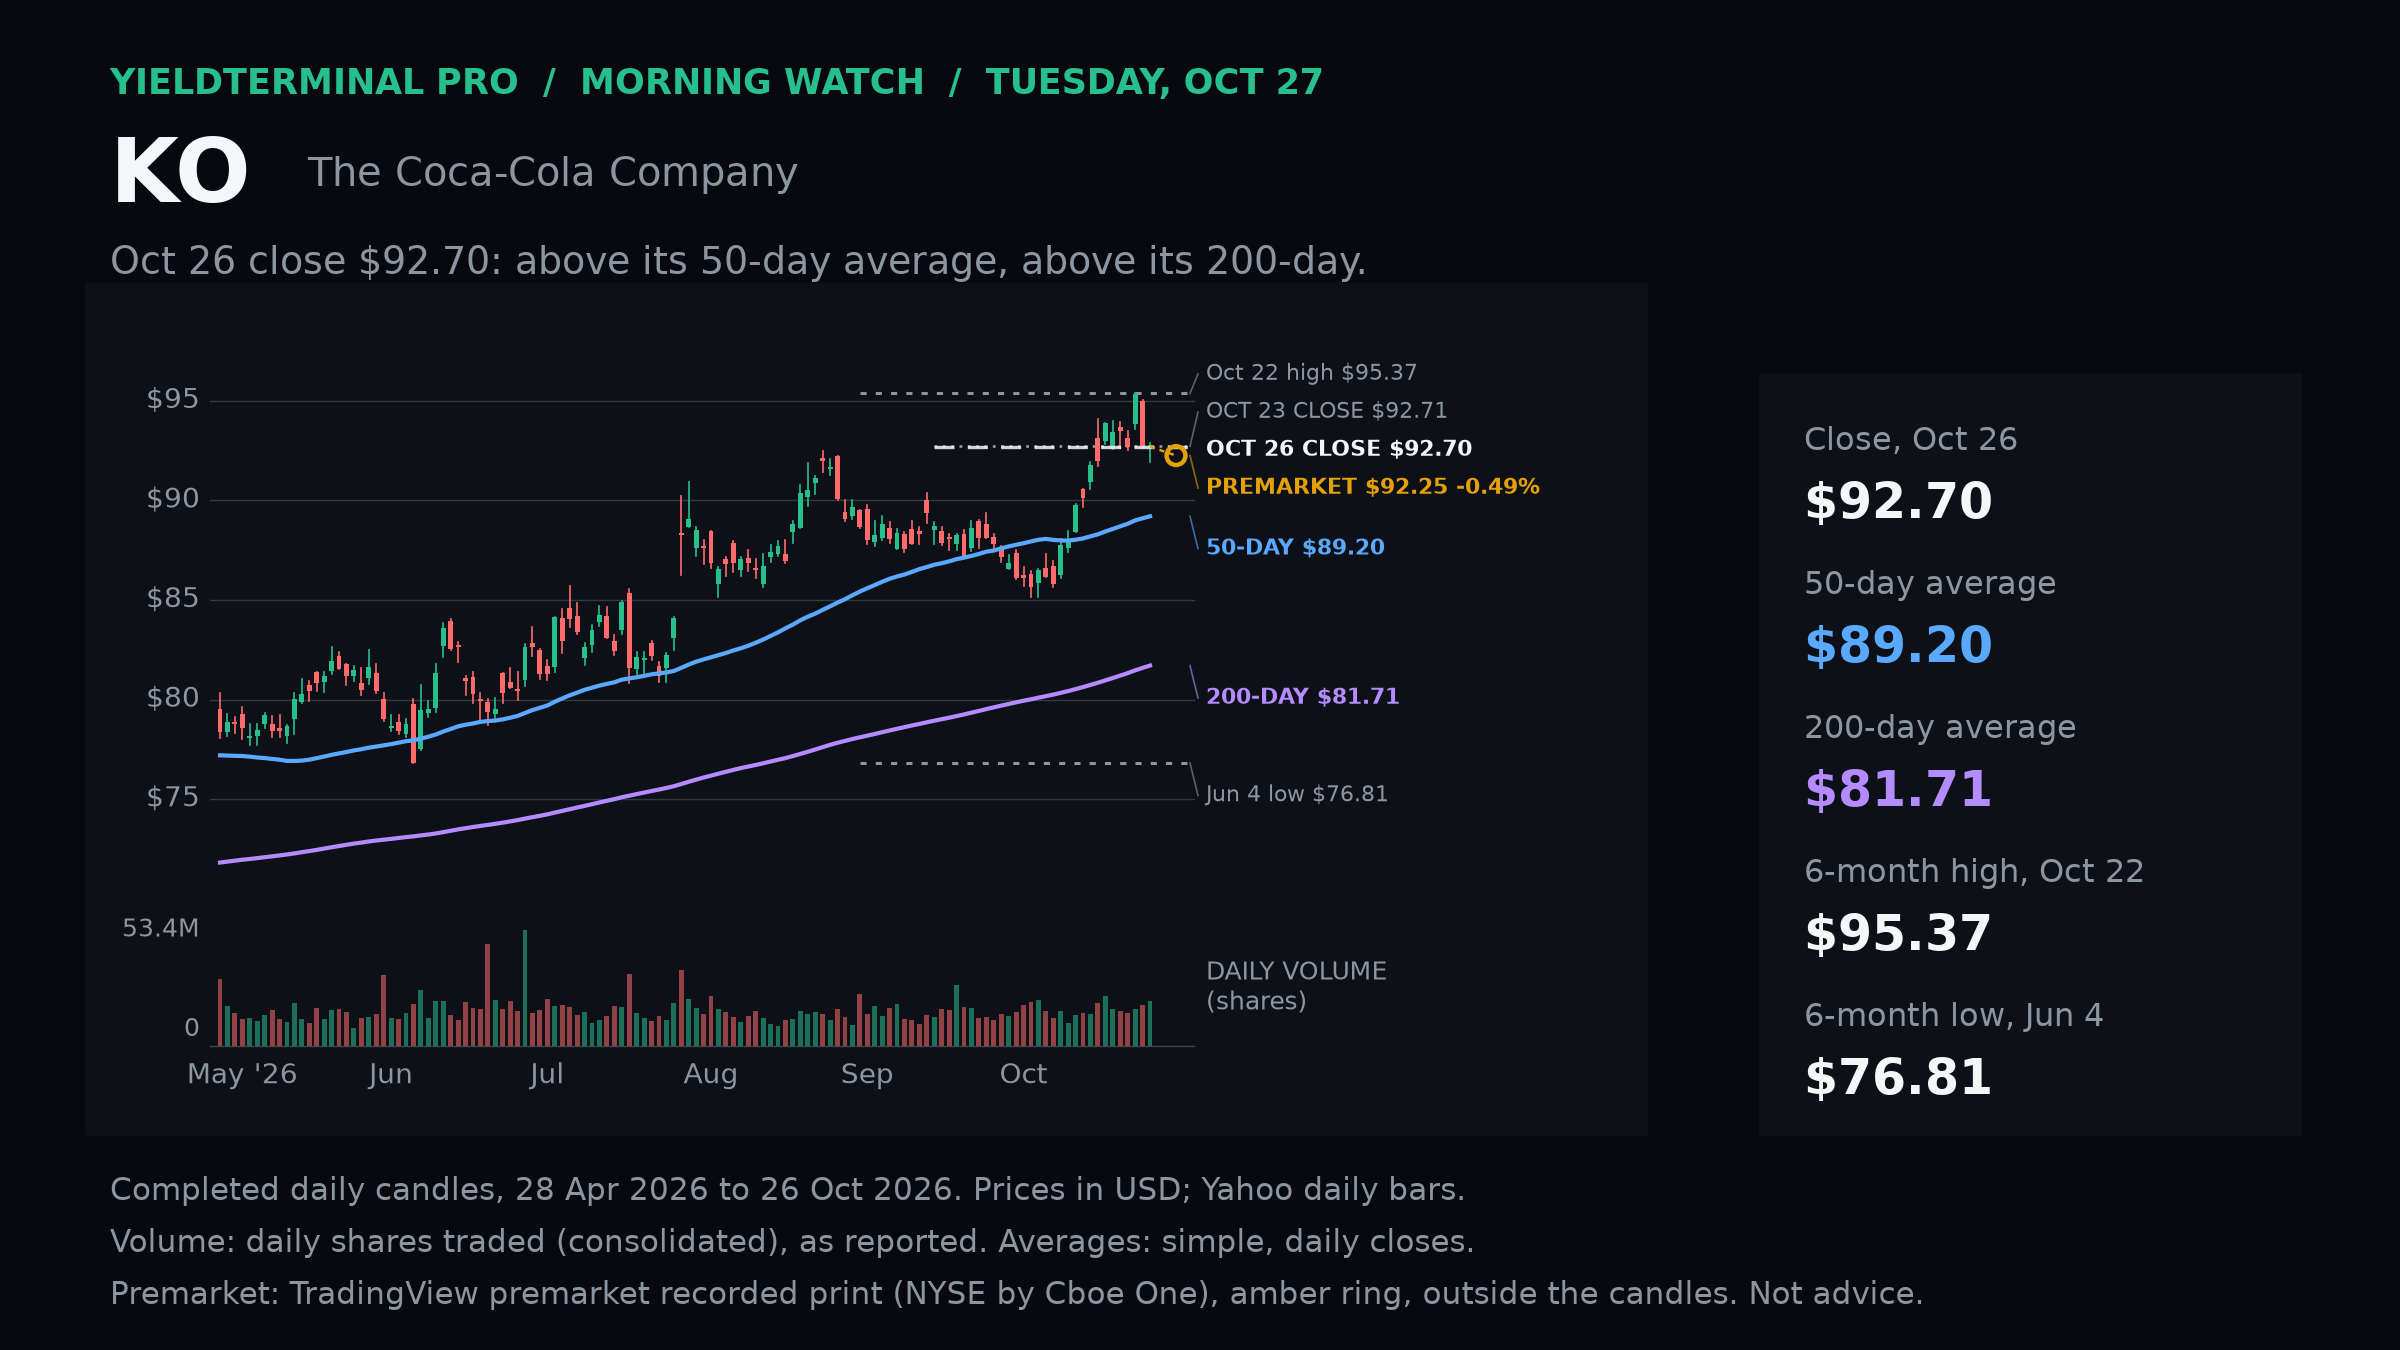
$KOCoca-Cola - October 27 Morning Watch 92.25Recorded October 27 premarket observation; completed October 26 close $92.70Recorded October 27 premarket print was below the October 26 close; October 26 low is the nearer daily test.
- October 26 intraday lowDated historical level from completed regular-session data.
- 91.94
- 50-day SMA through October 26Dated historical level from completed regular-session data.
- 89.20
- 200-day SMA through October 26Dated historical level from completed regular-session data.
- 81.71
Levels measured over Completed U.S. regular-session daily history through October 26; recorded October 27 premarket point separately marked.. A level measured over a different window can be a different number.
 See the chart on X →
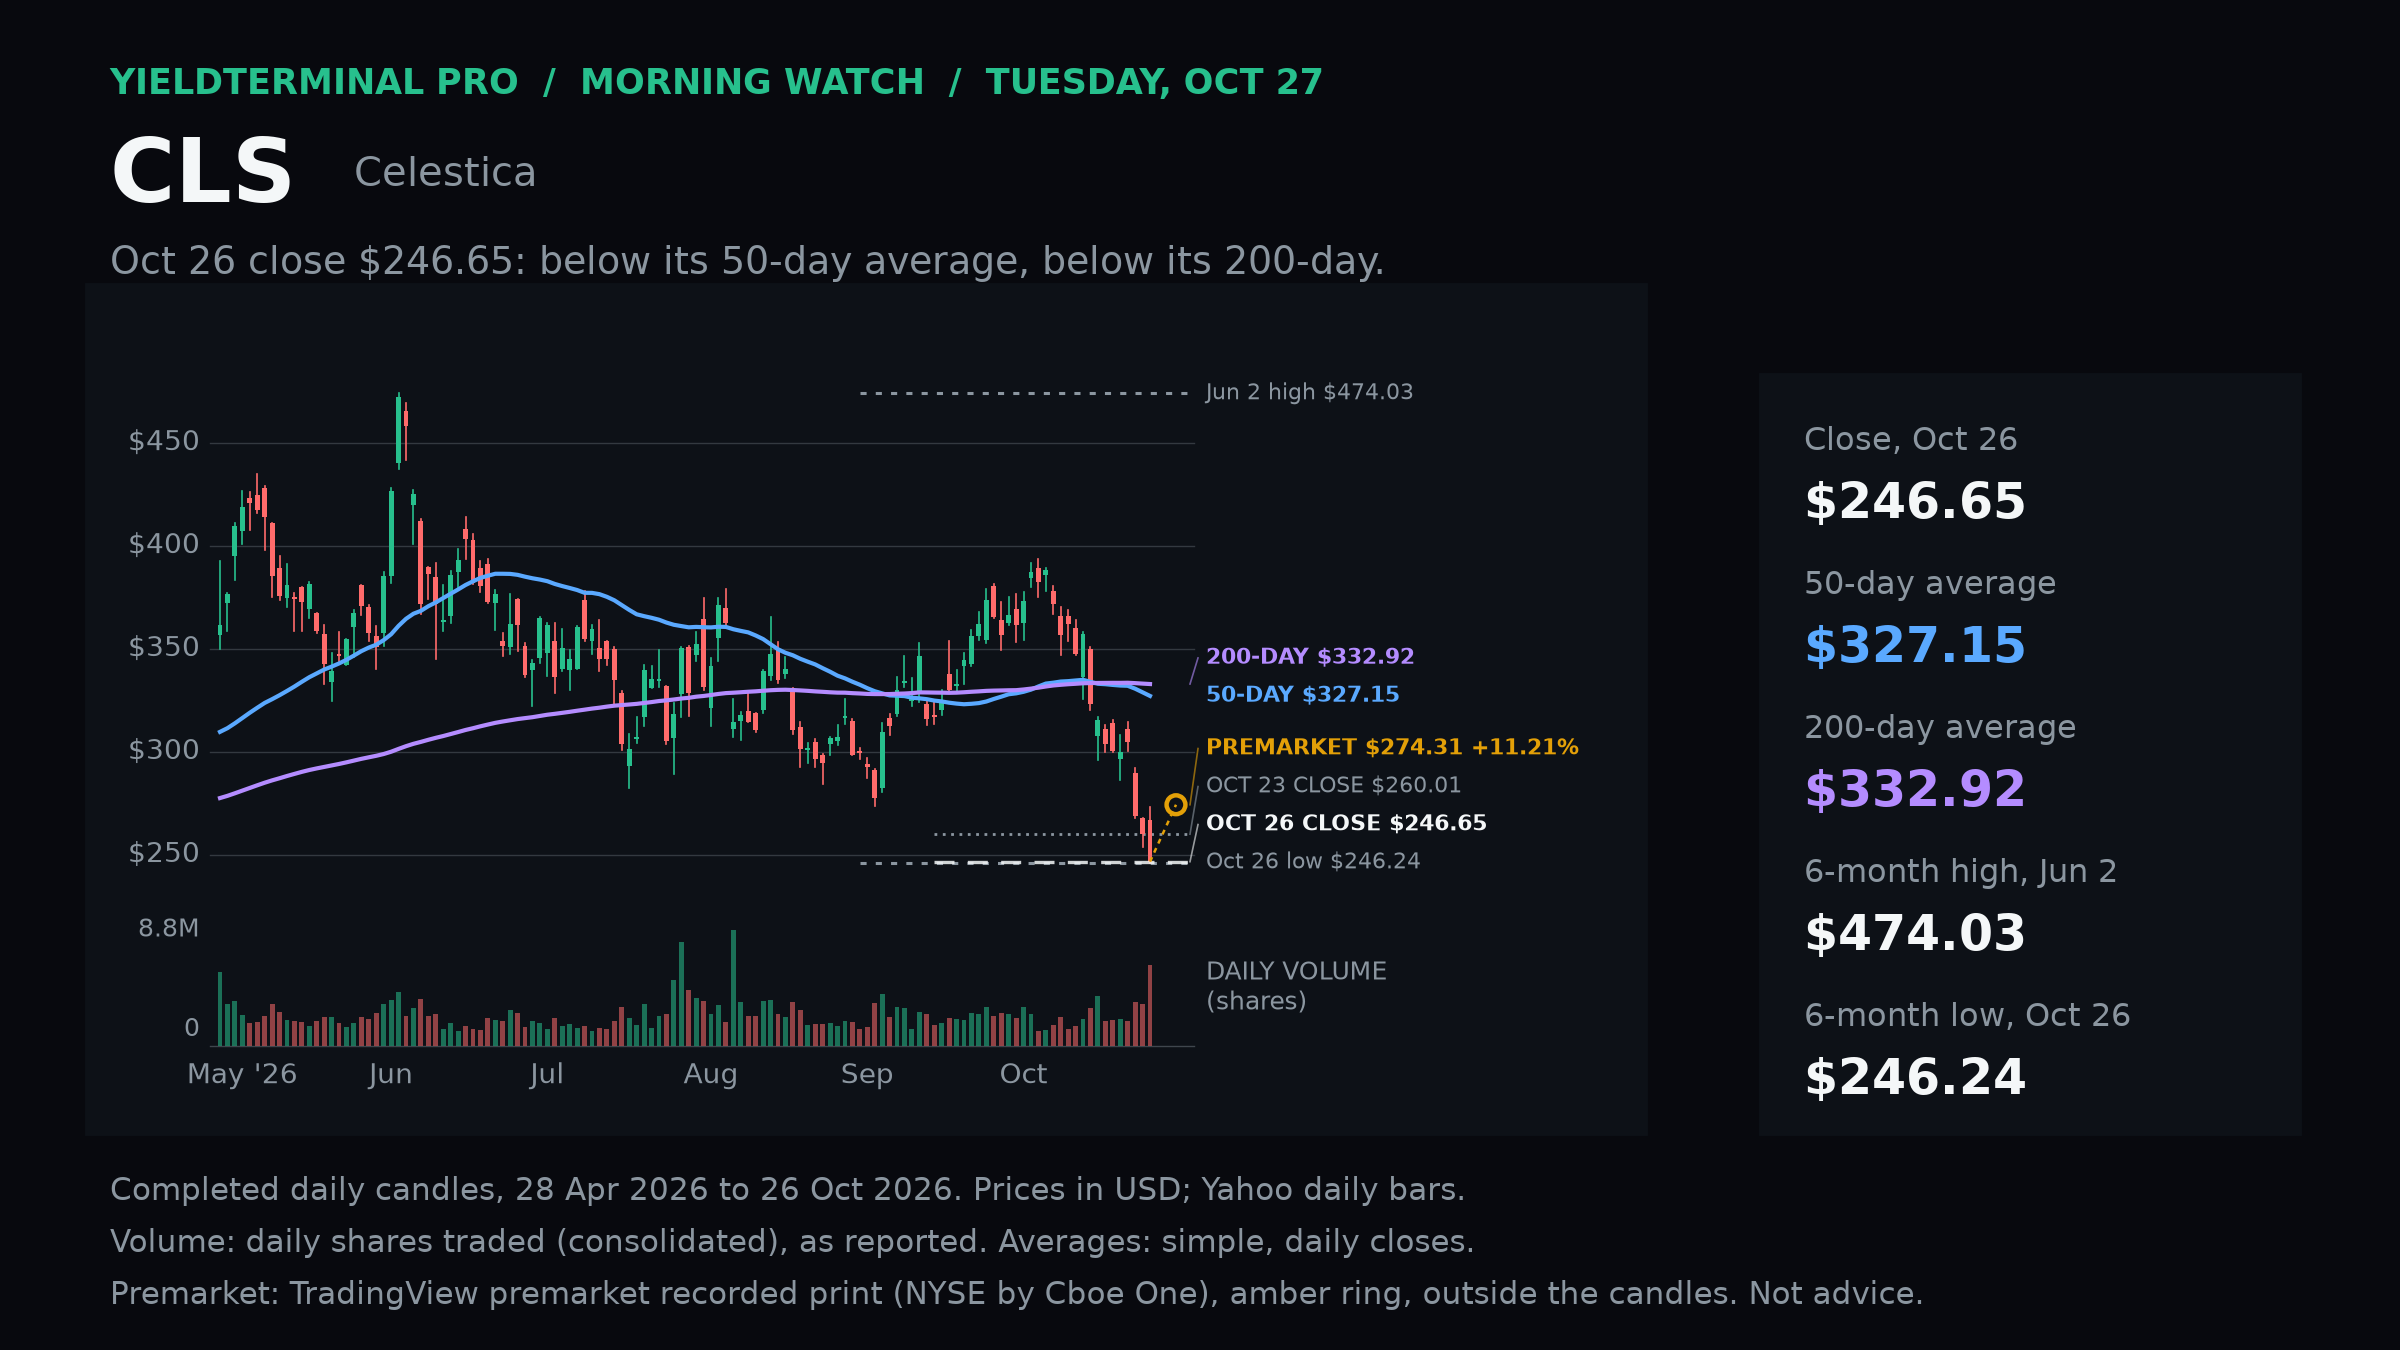
$CLSCelestica - October 27 Morning Watch 274.31Recorded October 27 premarket observation; completed October 26 close $246.65Recorded October 27 premarket print exceeded October 26 high following the reported outlook change.
- October 26 intraday highDated historical level from completed regular-session data.
- 273.14
- October 26 intraday lowDated historical level from completed regular-session data.
- 246.24
- 50-day SMA through October 26Dated historical level from completed regular-session data.
- 327.15
- 200-day SMA through October 26Dated historical level from completed regular-session data.
- 332.92
Levels measured over Completed U.S. regular-session daily history through October 26; recorded October 27 premarket point separately marked.. A level measured over a different window can be a different number.
 See the chart on X →
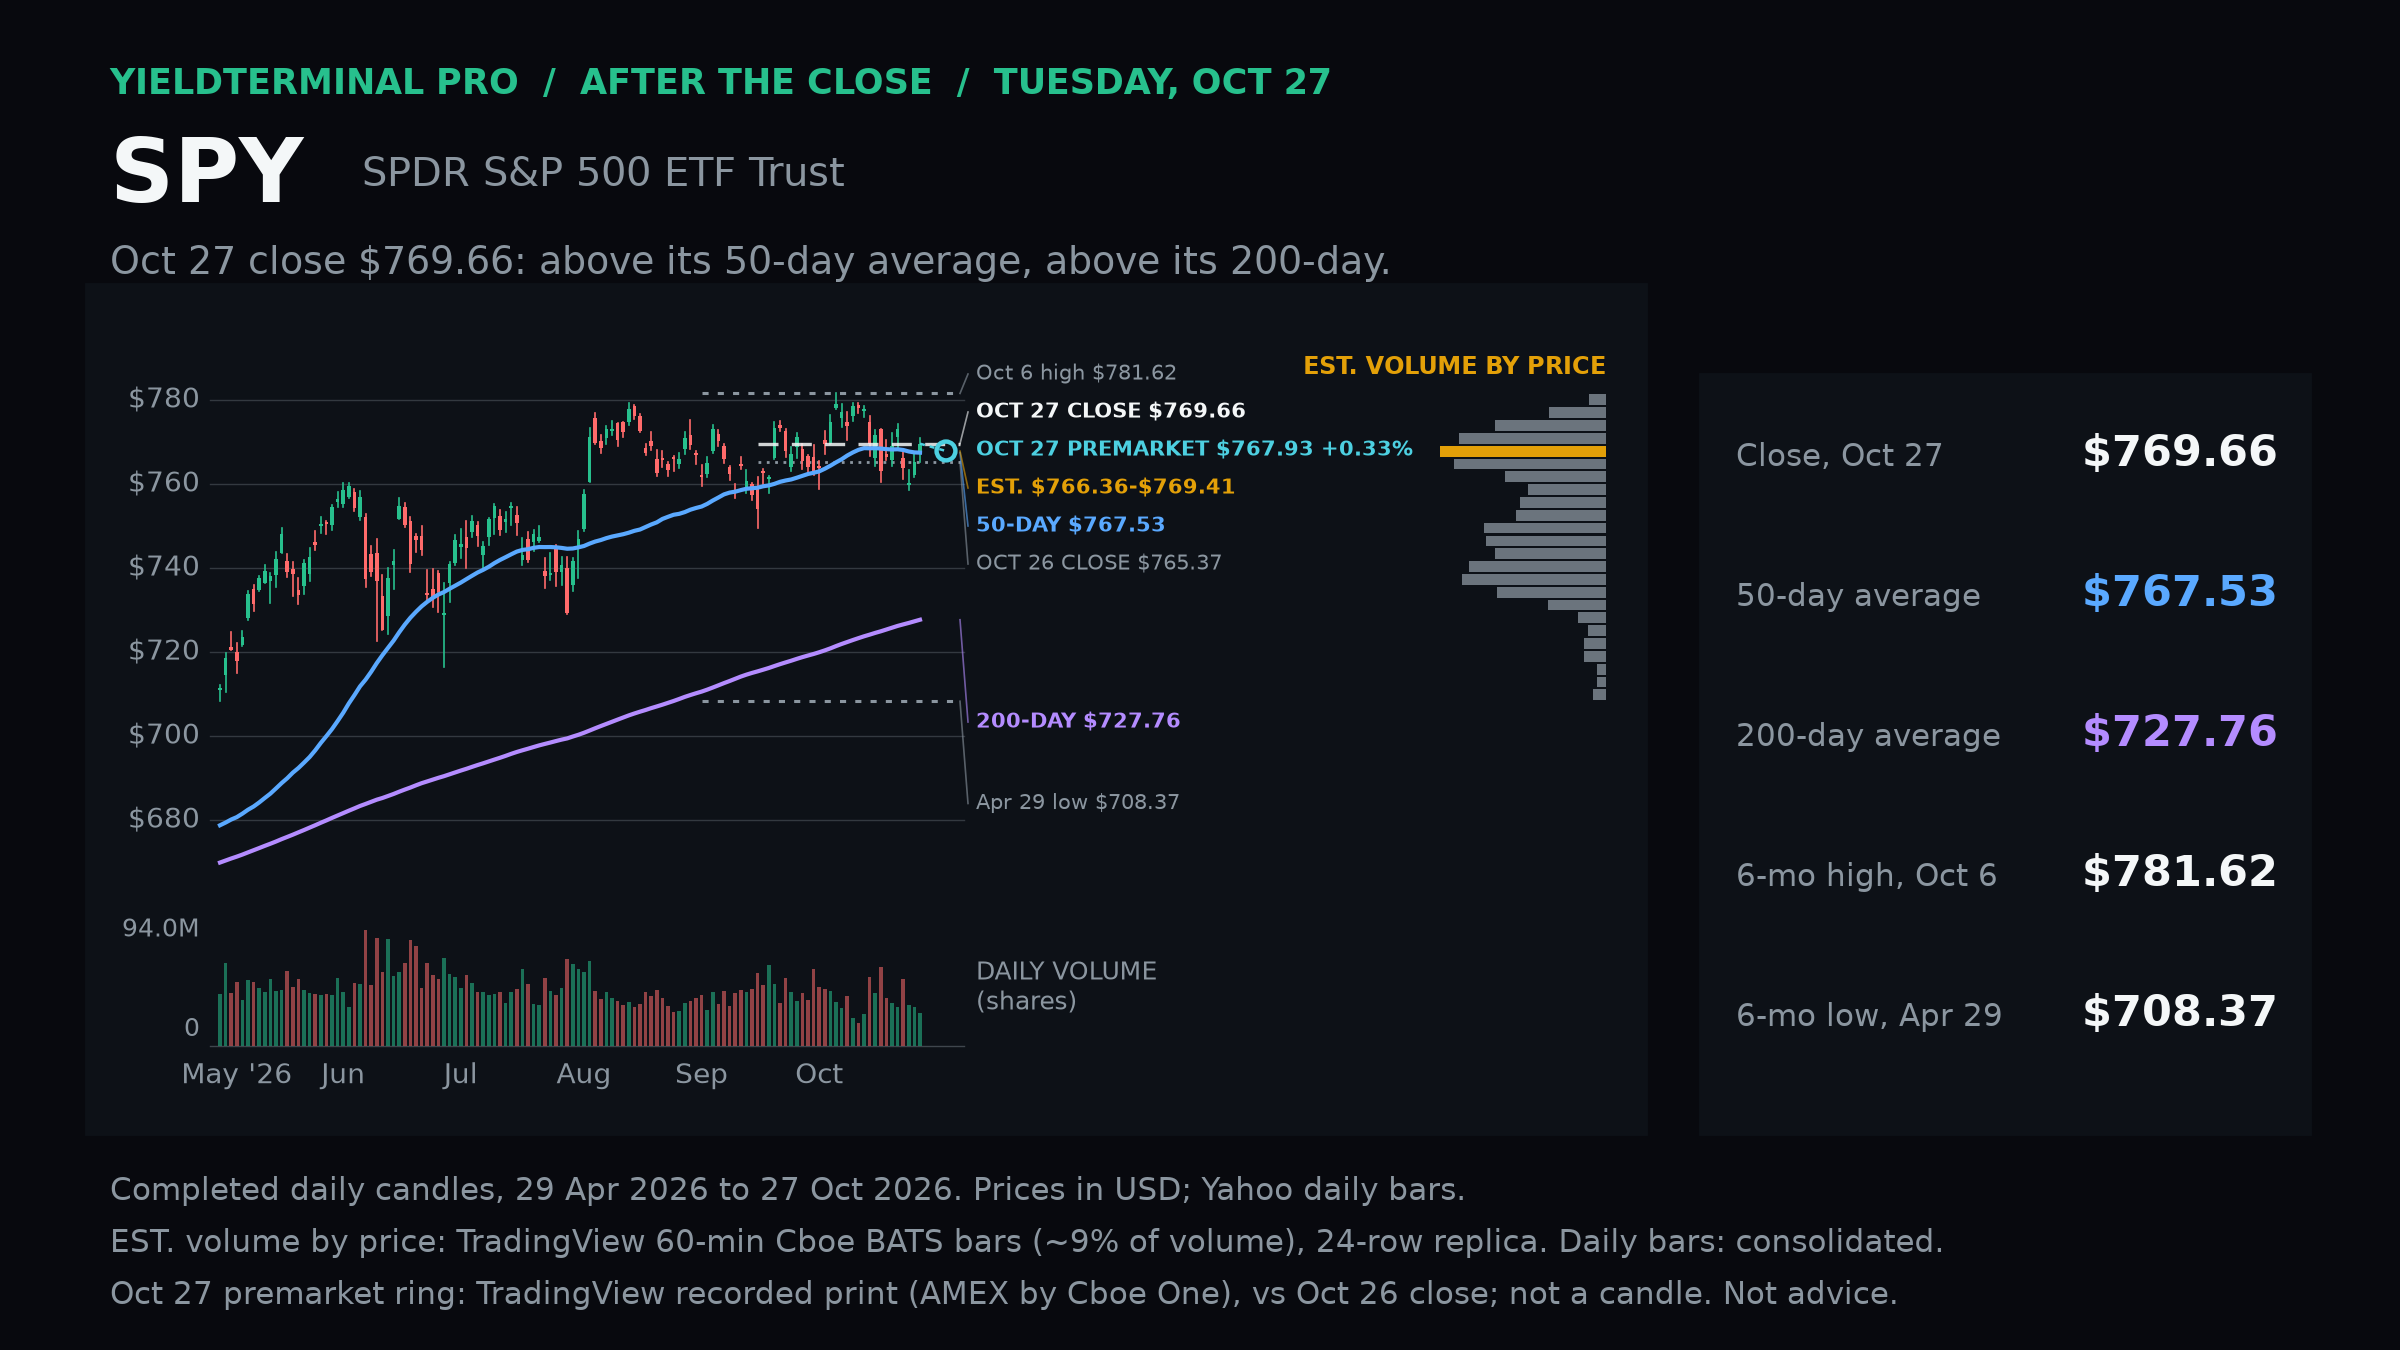
$SPYSPDR S&P 500 ETF Trust - October 27 After Close 769.66October 27 completed U.S. regular-session closeClosed above its 50-day average; a later daily close holding above it would strengthen the rebound.
- 50-day SMA through October 27Calculated from completed regular-session daily closes.
- 767.53
- 200-day SMA through October 27Calculated from completed regular-session daily closes.
- 727.76
- October 26 closePrior completed regular-session close.
- 765.37
- October 6 plotted-window intraday highHistorical intraday high, not a closing extreme.
- 781.62
Levels measured over Completed U.S. regular-session daily bars through October 27, 2026; 126-session plotted window. Right-side volume-by-price is an estimated partial-venue sample where shown.. A level measured over a different window can be a different number.
 See the chart on X →
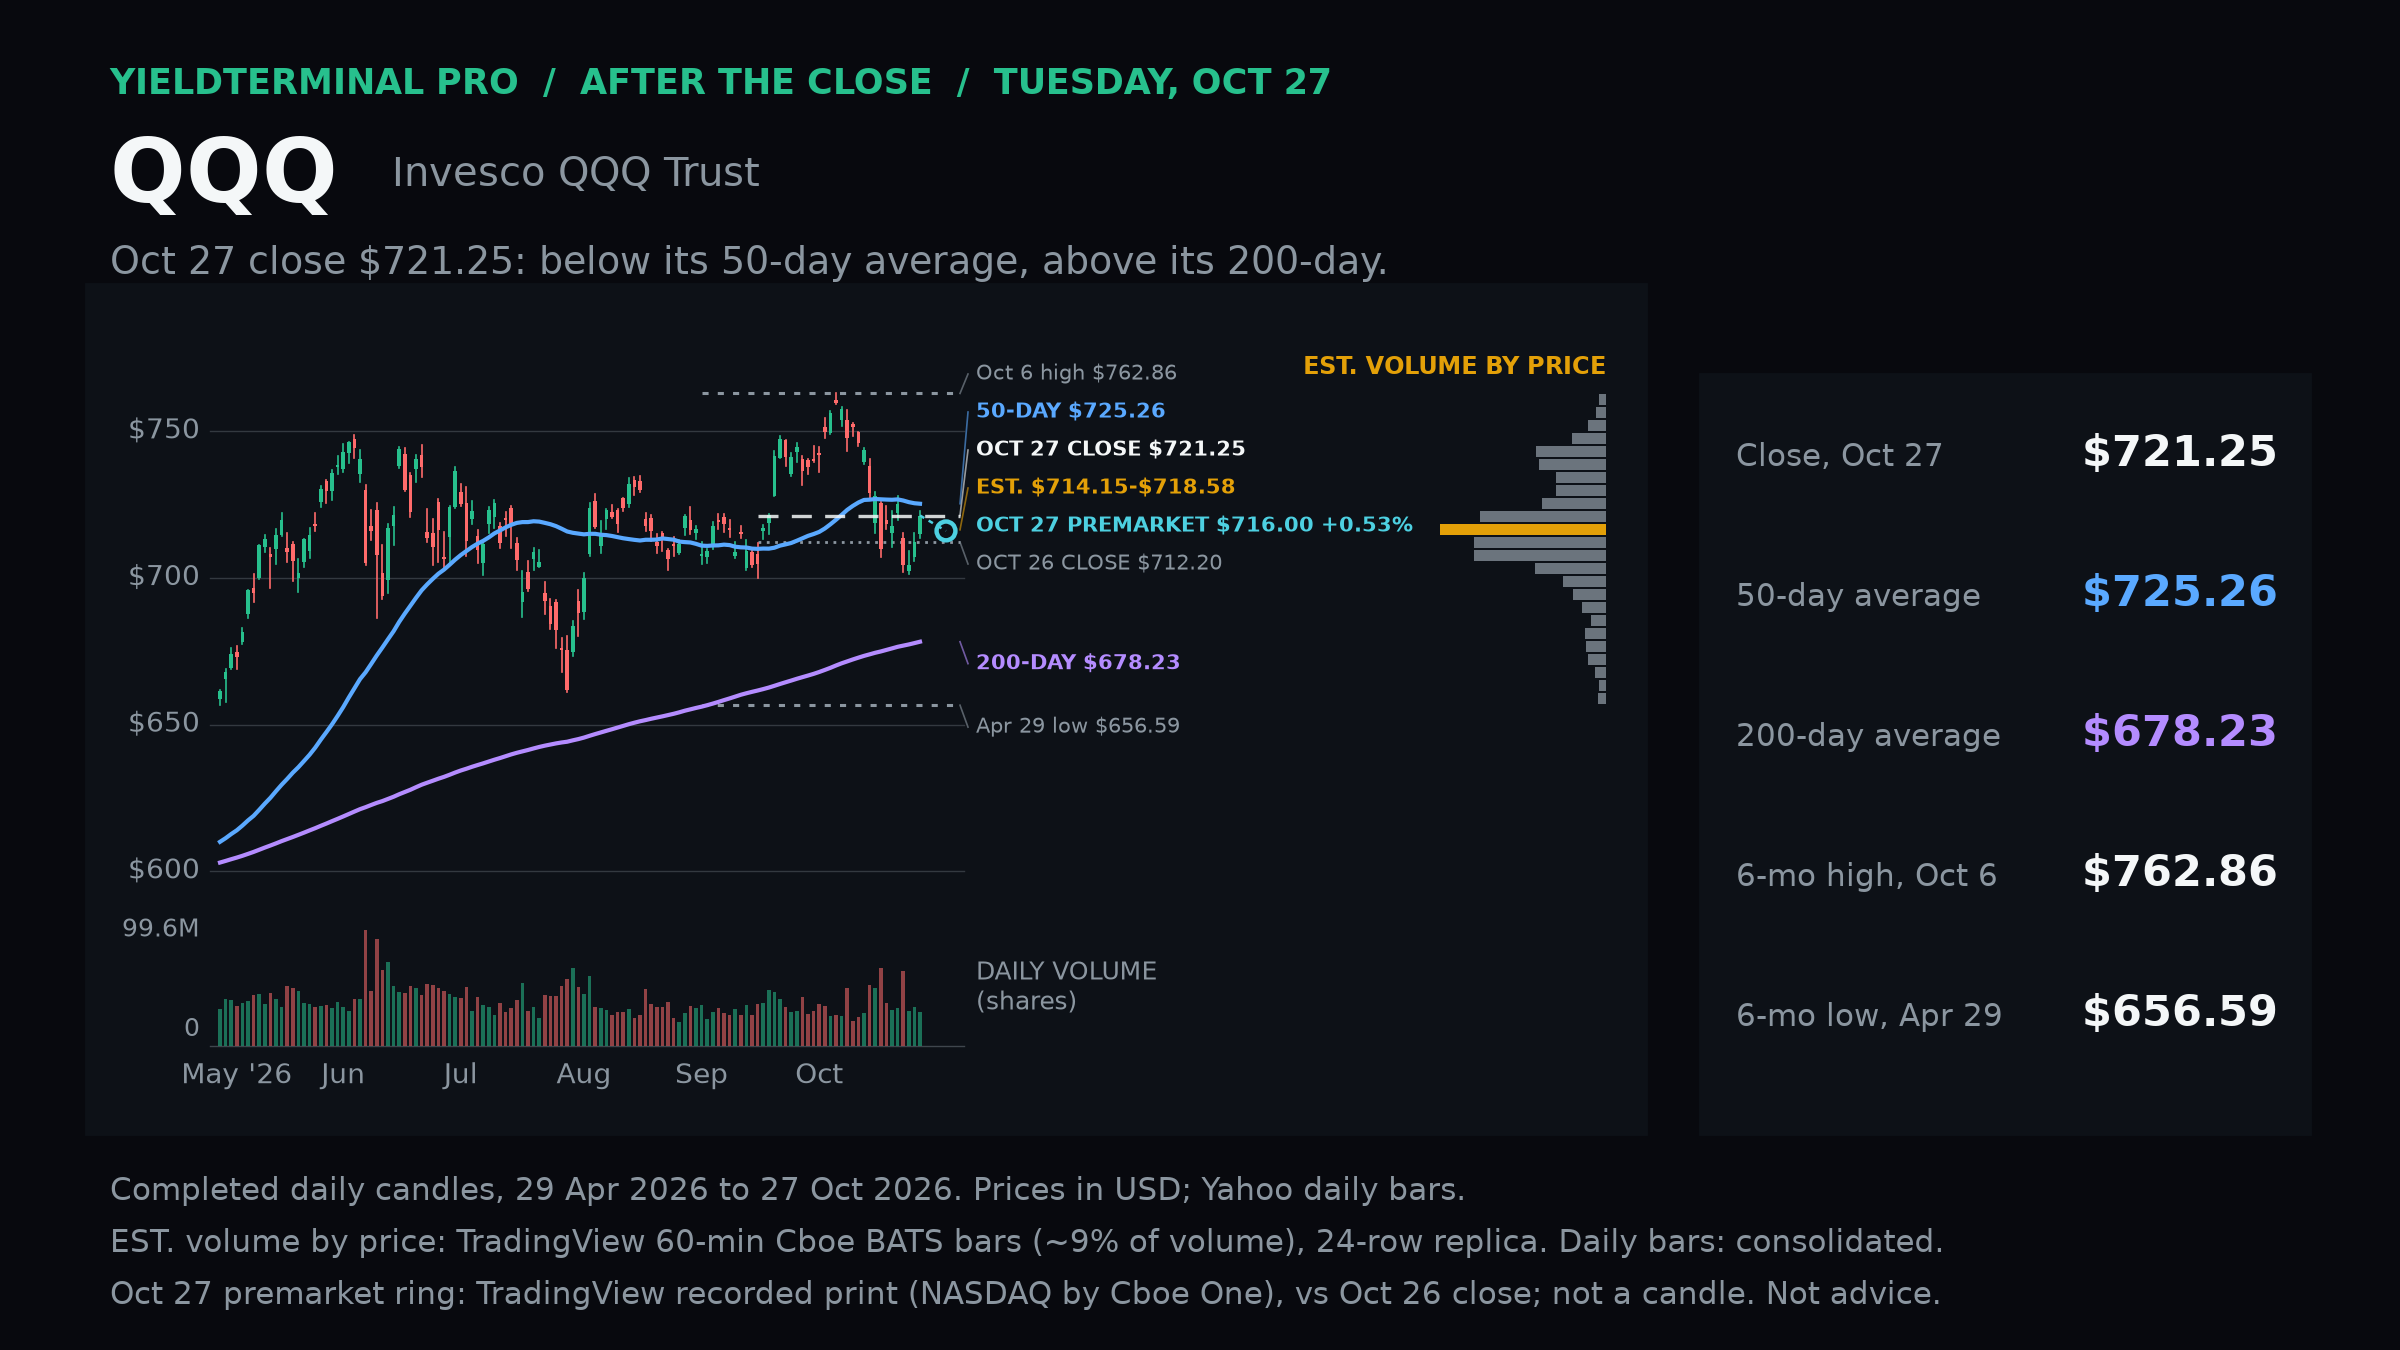
$QQQInvesco QQQ Trust - October 27 After Close 721.25October 27 completed U.S. regular-session closeRebounded but closed below its 50-day average; a daily close above it remains the next test.
- 50-day SMA through October 27Calculated from completed regular-session daily closes.
- 725.26
- 200-day SMA through October 27Calculated from completed regular-session daily closes.
- 678.23
- October 26 closePrior completed regular-session close.
- 712.20
- October 6 plotted-window intraday highHistorical intraday high, not a closing extreme.
- 762.86
Levels measured over Completed U.S. regular-session daily bars through October 27, 2026; 126-session plotted window. Right-side volume-by-price is an estimated partial-venue sample where shown.. A level measured over a different window can be a different number.
 See the chart on X →
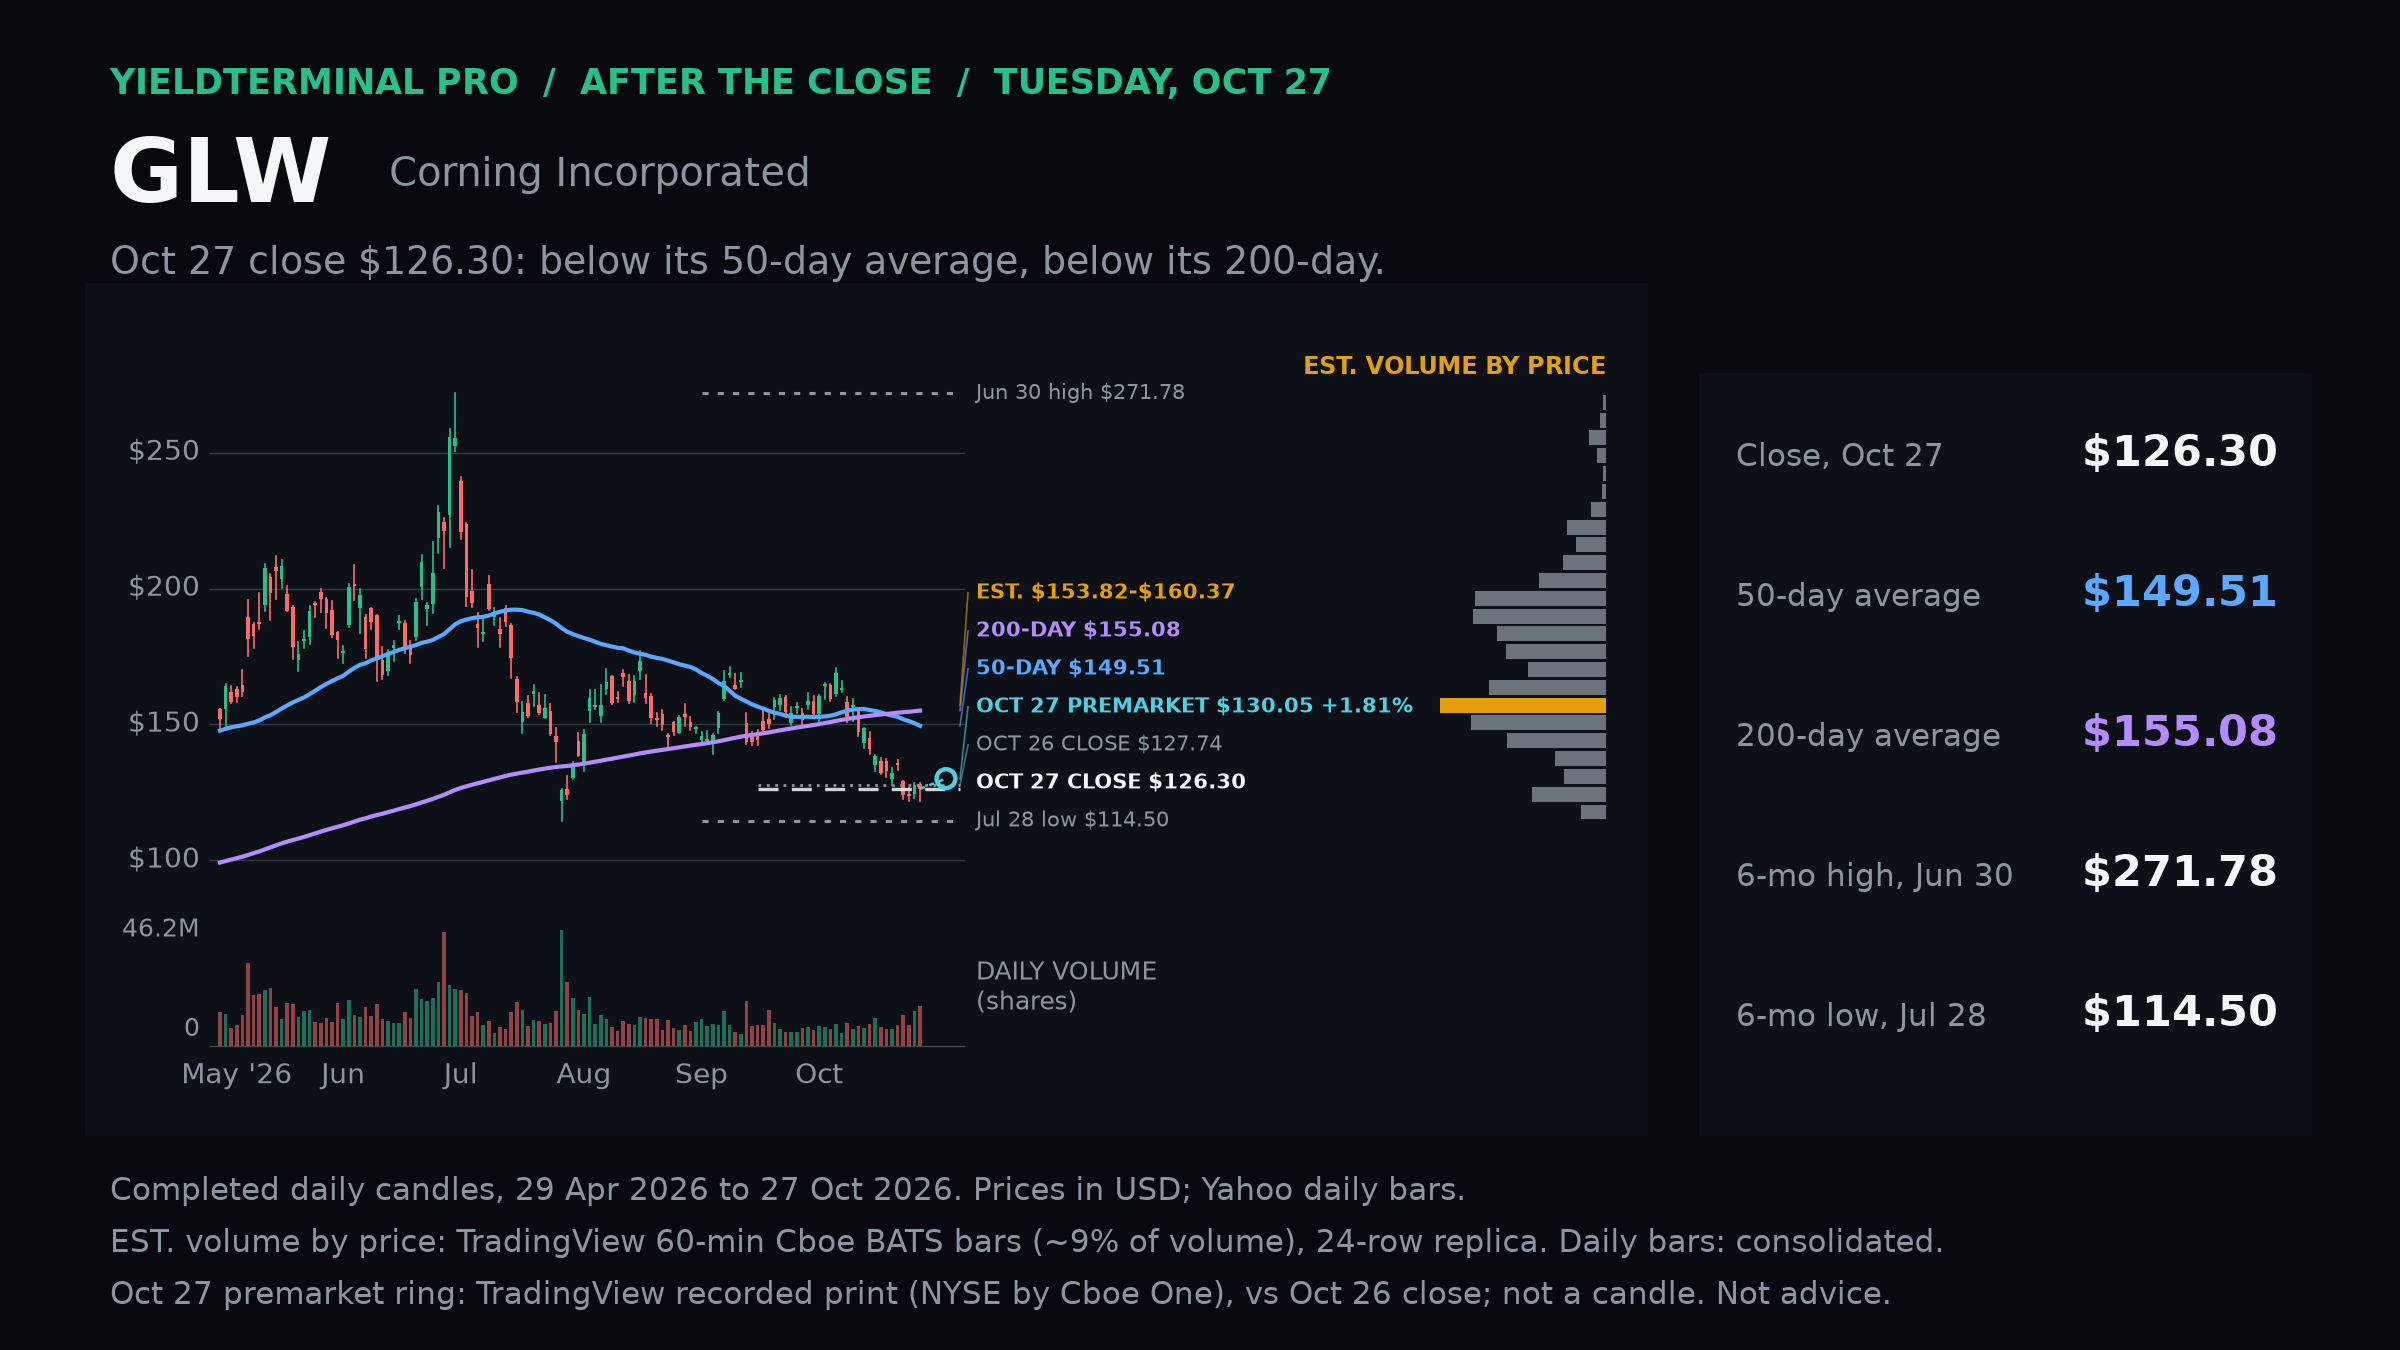
$GLWCorning - October 27 After Close 126.30October 27 completed U.S. regular-session closeClosed below Monday's close and below both moving averages after the reported quarter.
- 50-day SMA through October 27Calculated from completed regular-session daily closes.
- 149.51
- 200-day SMA through October 27Calculated from completed regular-session daily closes.
- 155.08
- October 26 closePrior completed regular-session close.
- 127.74
- June 30 plotted-window intraday highHistorical intraday high, not a closing extreme.
- 271.78
Levels measured over Completed U.S. regular-session daily bars through October 27, 2026; 126-session plotted window. Right-side volume-by-price is an estimated partial-venue sample where shown.. A level measured over a different window can be a different number.
 See the chart on X →
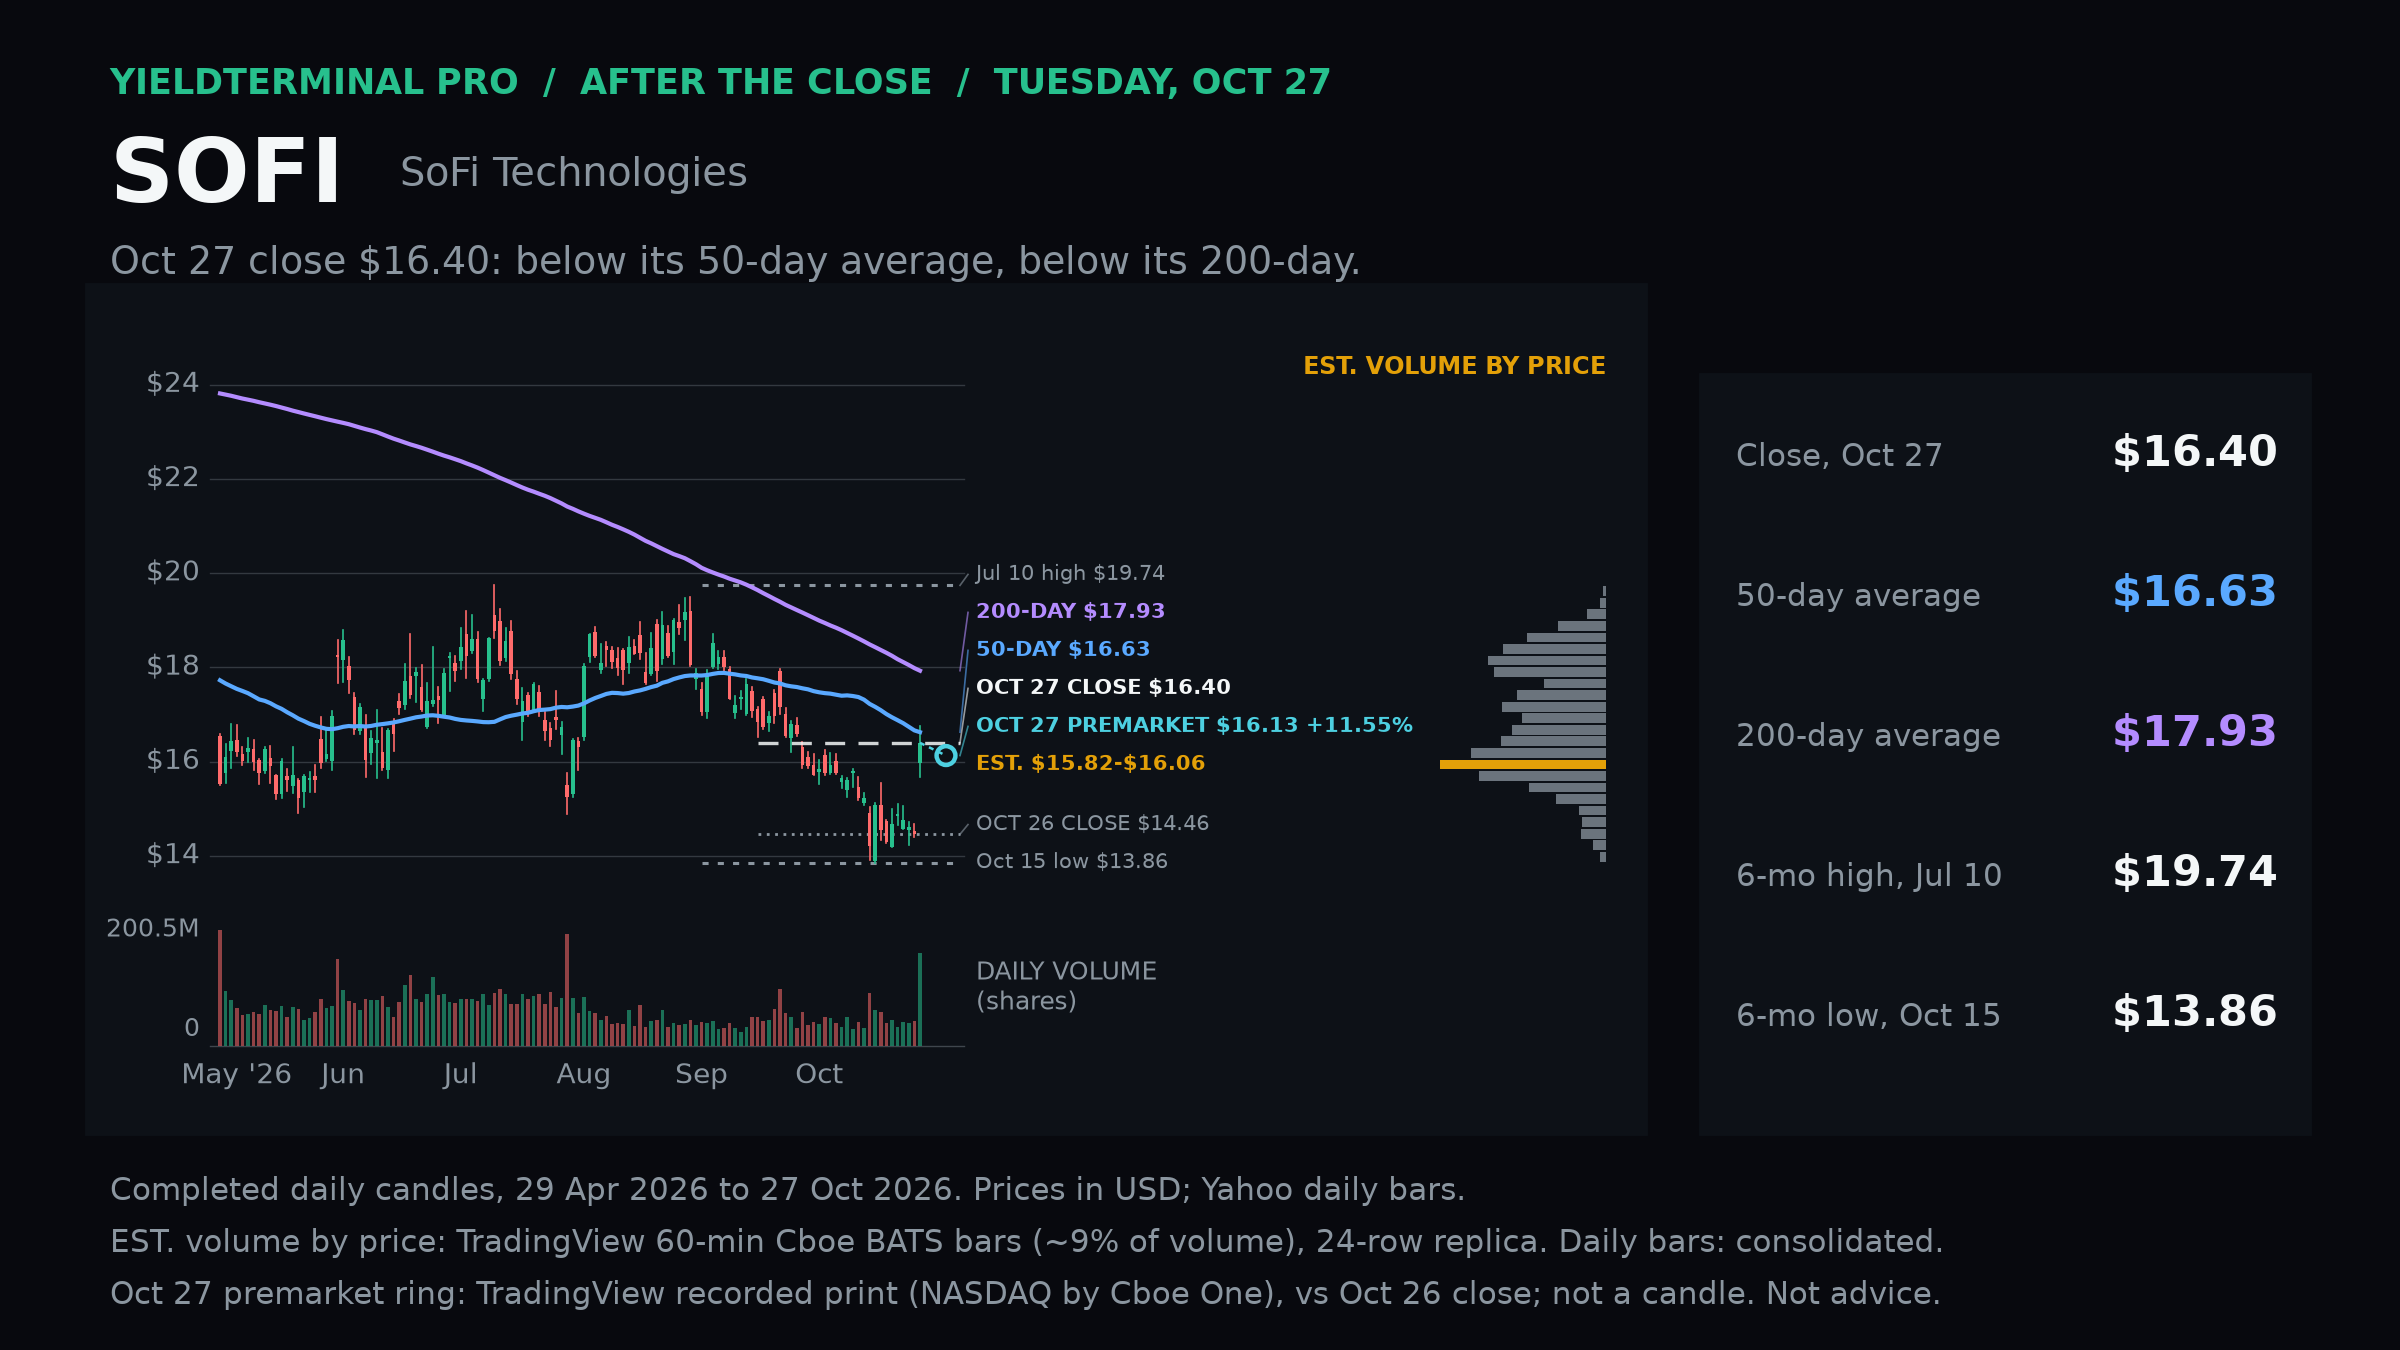
$SOFISoFi Technologies - October 27 After Close 16.40October 27 completed U.S. regular-session closeRose strongly from Monday's close but finished just below its 50-day average.
- 50-day SMA through October 27Calculated from completed regular-session daily closes.
- 16.63
- 200-day SMA through October 27Calculated from completed regular-session daily closes.
- 17.93
- October 26 closePrior completed regular-session close.
- 14.46
- July 10 plotted-window intraday highHistorical intraday high, not a closing extreme.
- 19.74
Levels measured over Completed U.S. regular-session daily bars through October 27, 2026; 126-session plotted window. Right-side volume-by-price is an estimated partial-venue sample where shown.. A level measured over a different window can be a different number.
 See the chart on X →
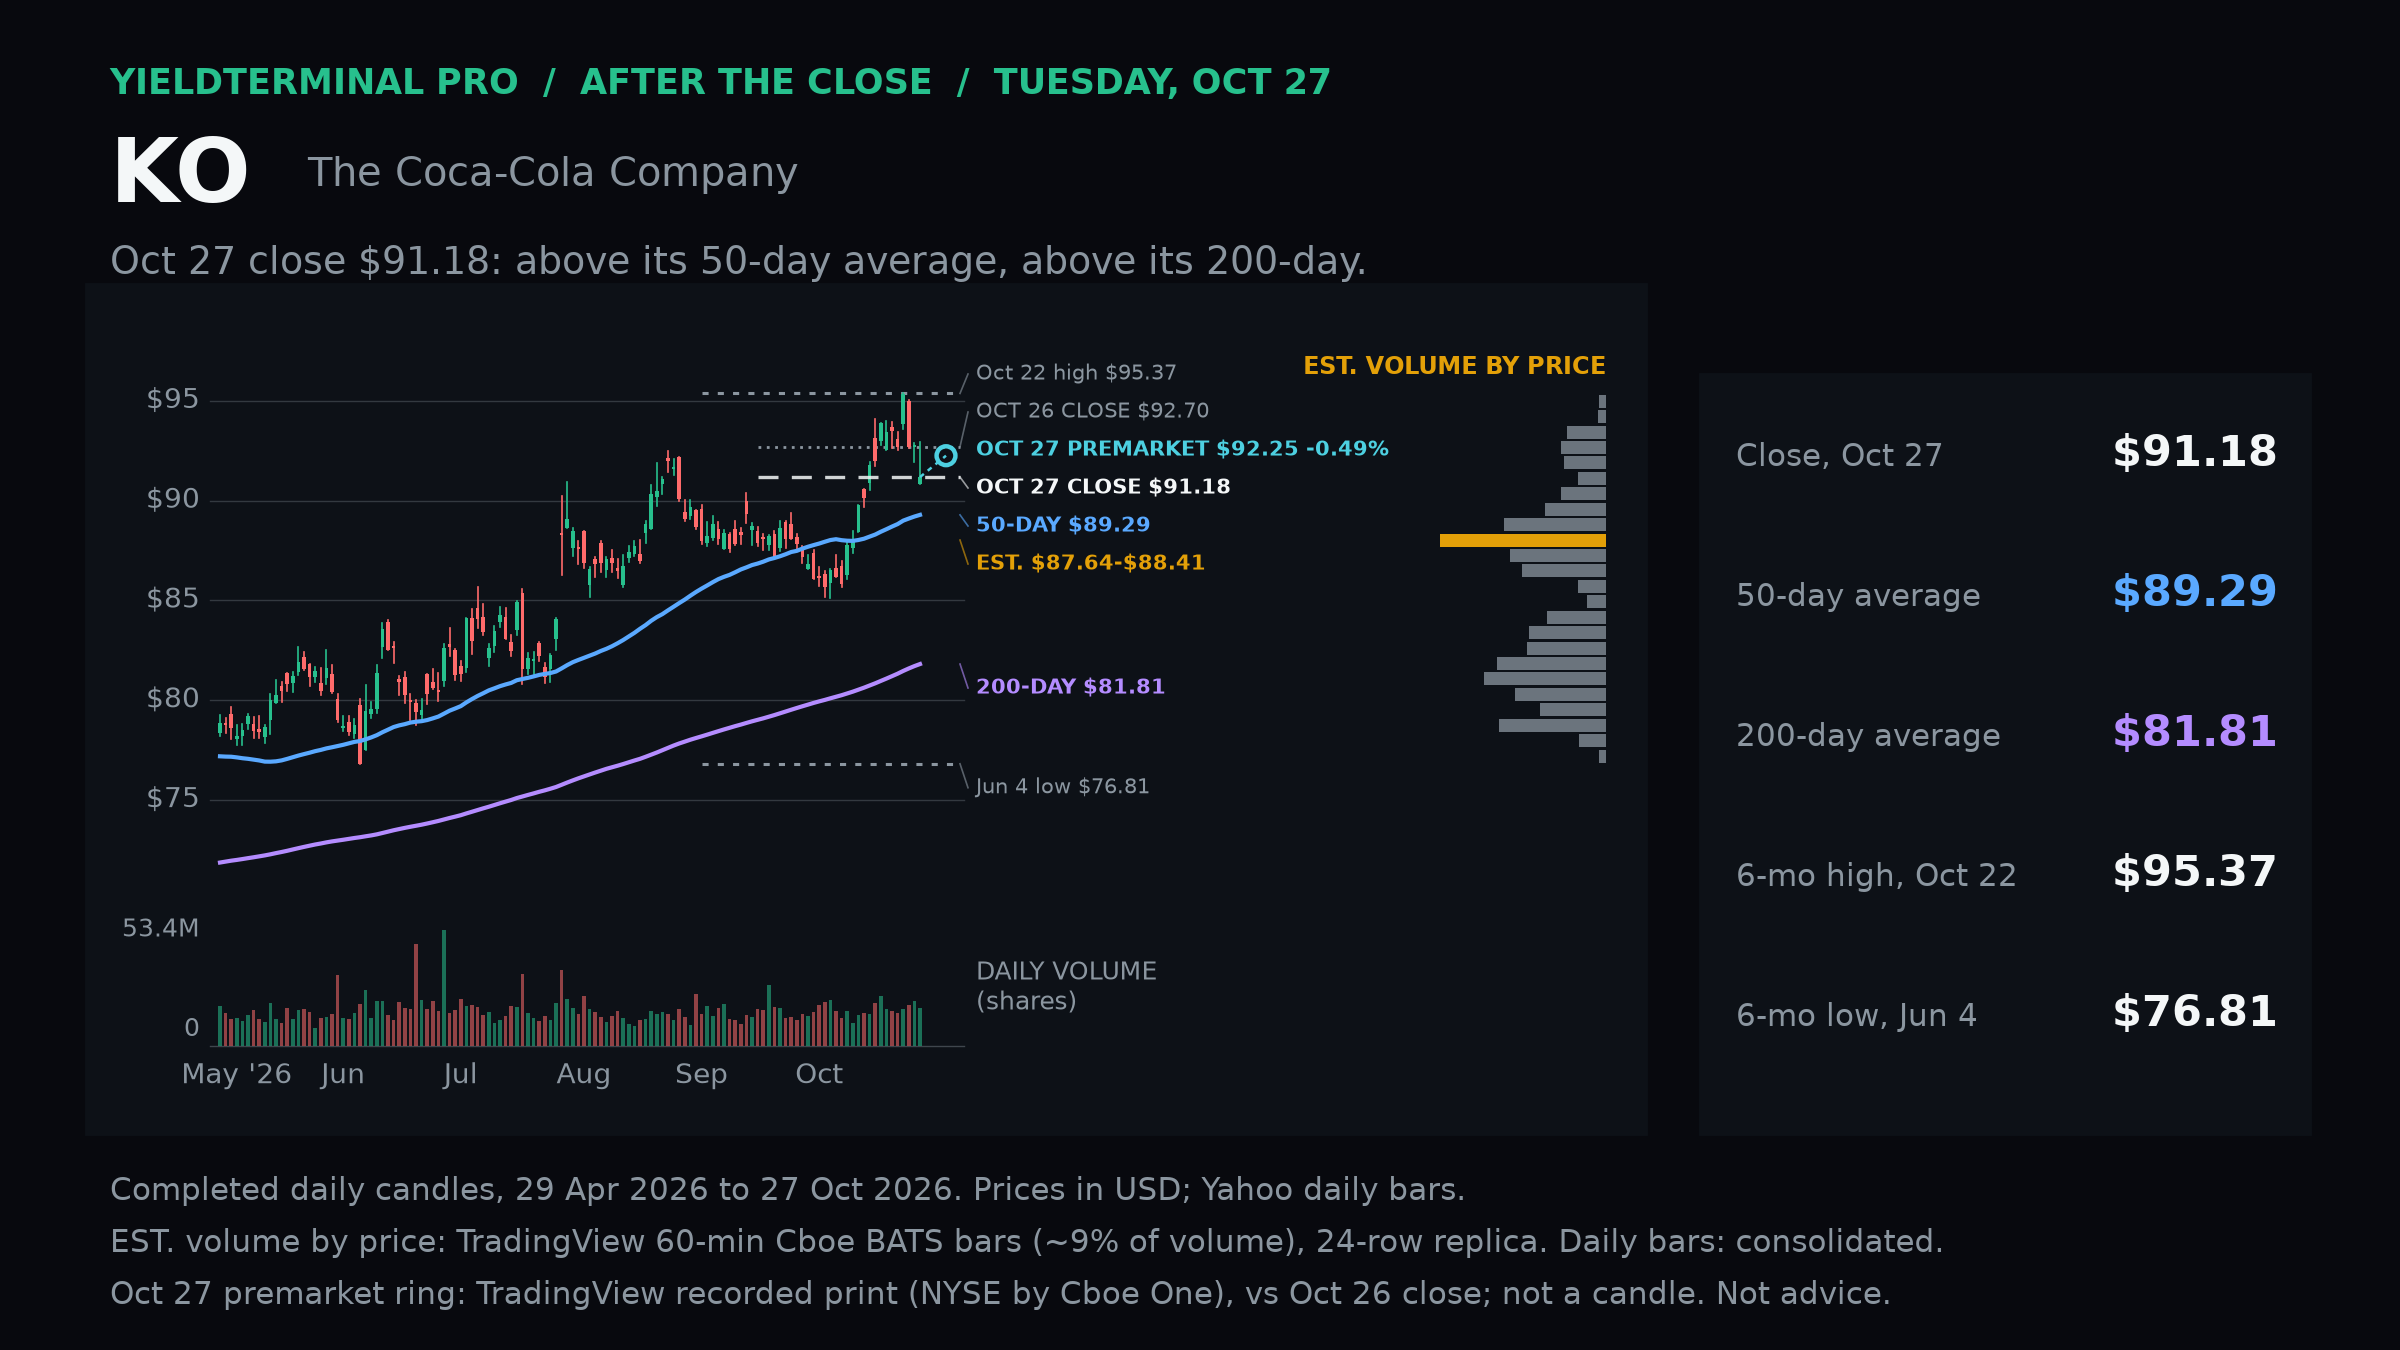
$KOCoca-Cola - October 27 After Close 91.18October 27 completed U.S. regular-session closeClosed below Monday's close while remaining above its 50-day and 200-day averages.
- 50-day SMA through October 27Calculated from completed regular-session daily closes.
- 89.29
- 200-day SMA through October 27Calculated from completed regular-session daily closes.
- 81.81
- October 26 closePrior completed regular-session close.
- 92.70
- October 22 plotted-window intraday highHistorical intraday high, not a closing extreme.
- 95.37
Levels measured over Completed U.S. regular-session daily bars through October 27, 2026; 126-session plotted window. Right-side volume-by-price is an estimated partial-venue sample where shown.. A level measured over a different window can be a different number.
 See the chart on X →
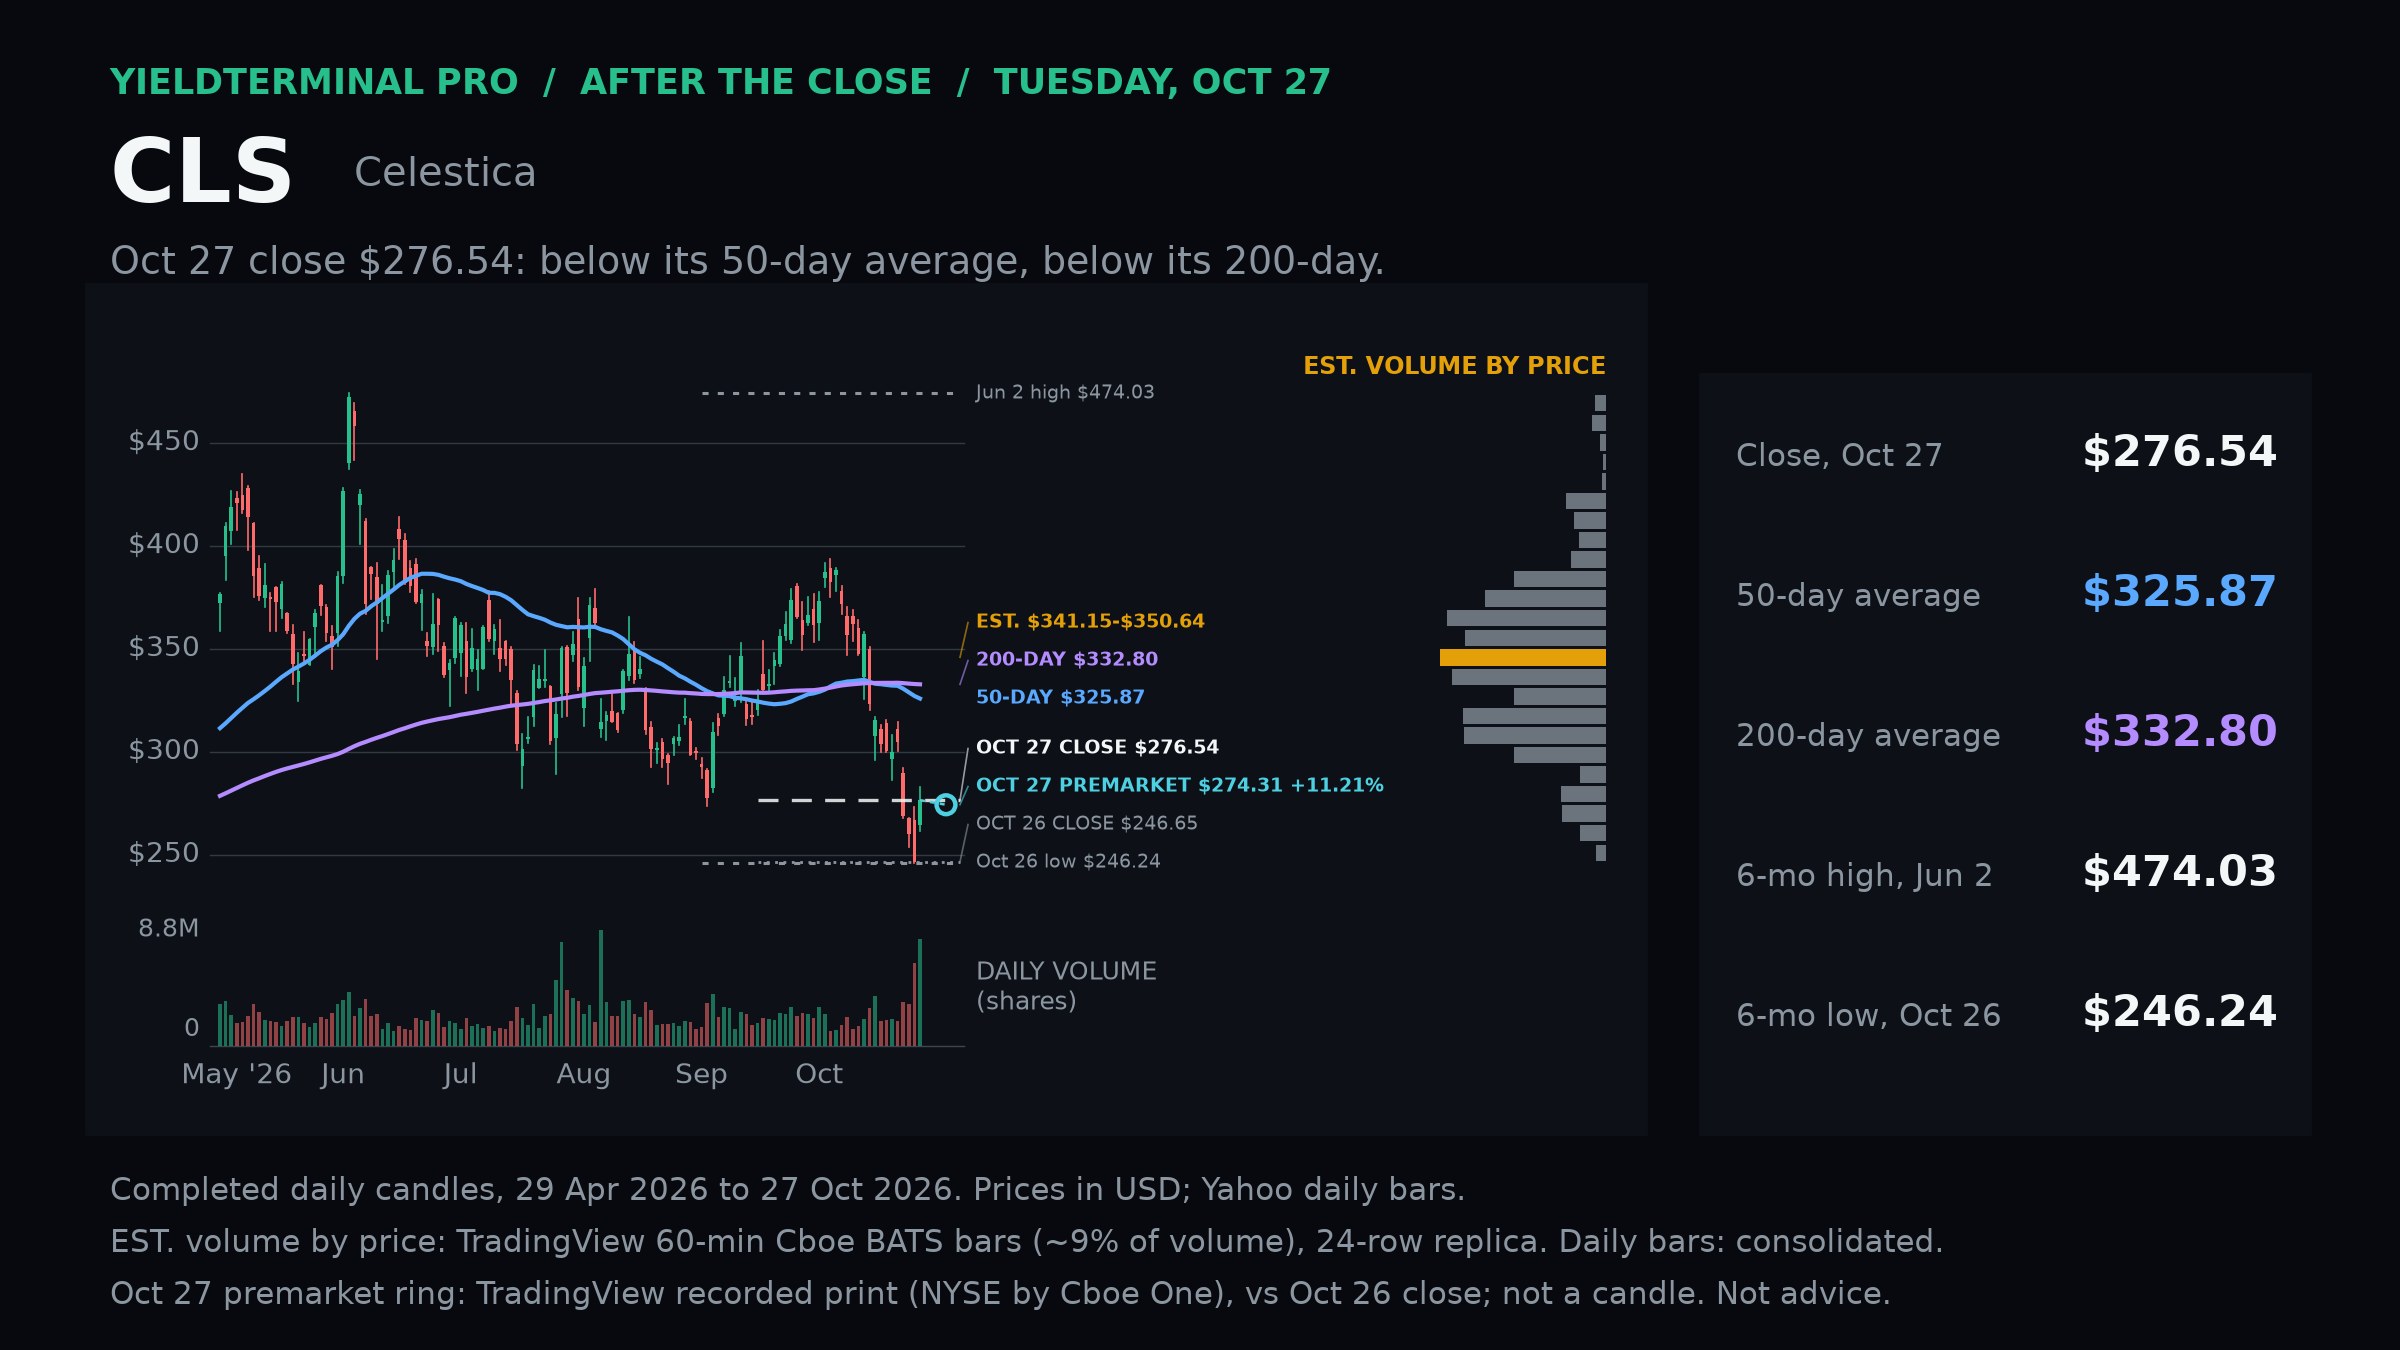
$CLSCelestica - October 27 After Close 276.54October 27 completed U.S. regular-session closeAdvanced from Monday's close but remained below its 50-day and 200-day averages.
- 50-day SMA through October 27Calculated from completed regular-session daily closes.
- 325.87
- 200-day SMA through October 27Calculated from completed regular-session daily closes.
- 332.80
- October 26 closePrior completed regular-session close.
- 246.65
- June 2 plotted-window intraday highHistorical intraday high, not a closing extreme.
- 474.03
Levels measured over Completed U.S. regular-session daily bars through October 27, 2026; 126-session plotted window. Right-side volume-by-price is an estimated partial-venue sample where shown.. A level measured over a different window can be a different number.
 See the chart on X →
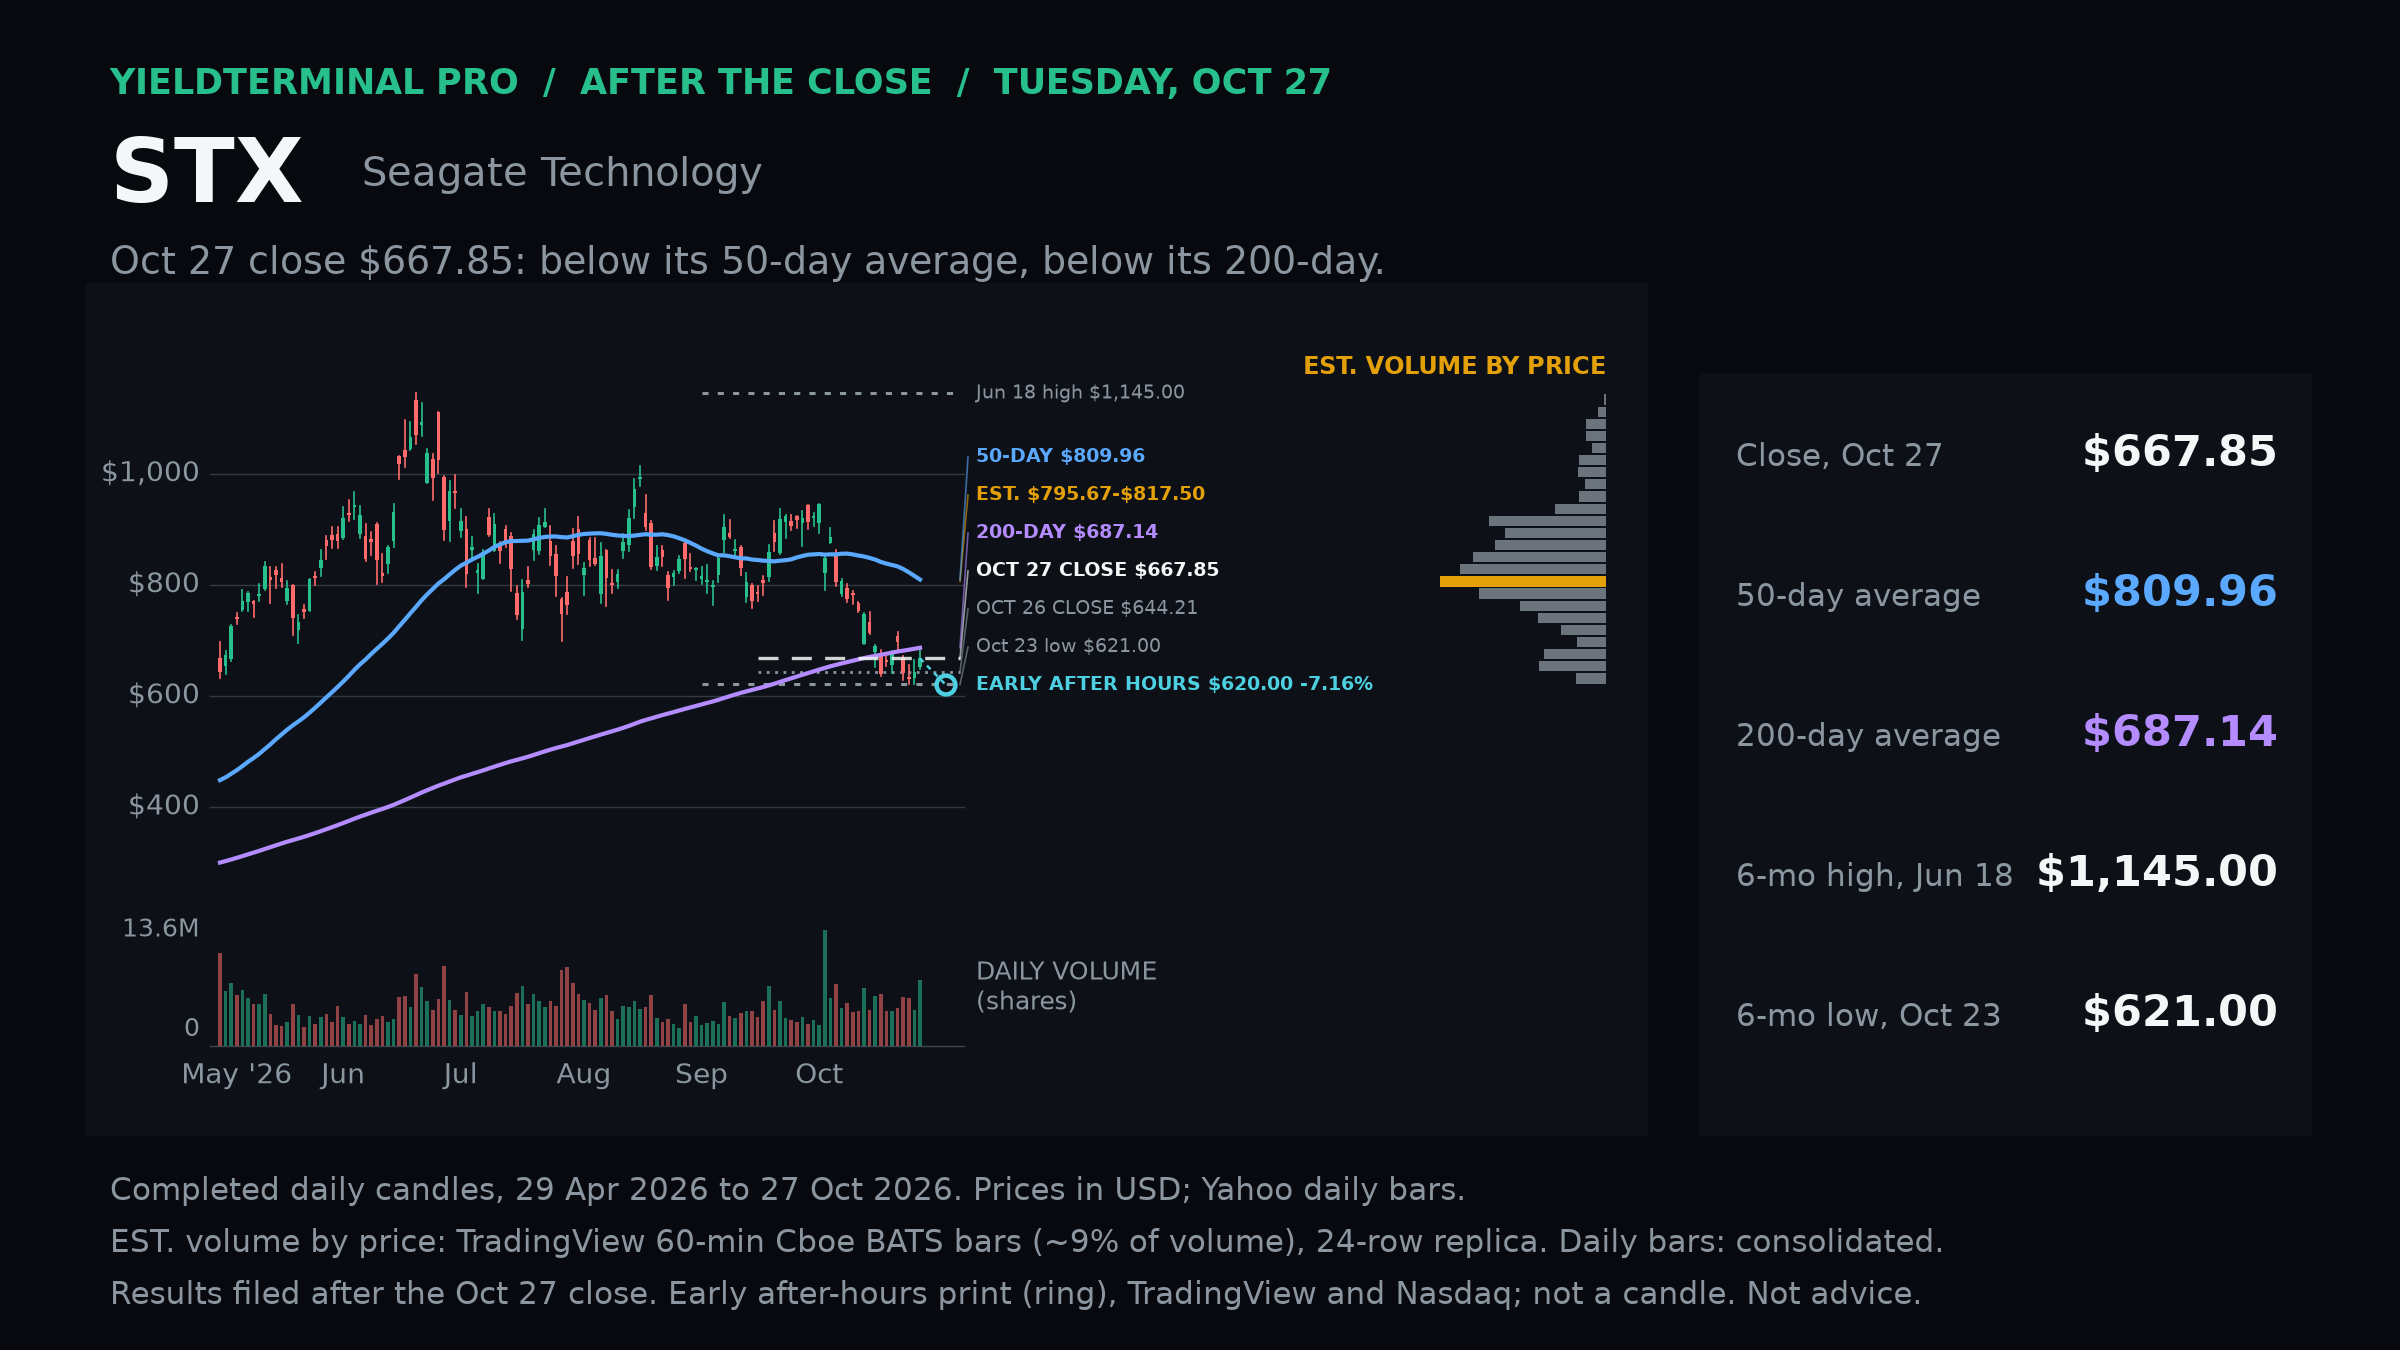
$STXSeagate Technology - October 27 After Close 667.85October 27 completed U.S. regular-session closeCompleted close stood below the 200-day average; an early postmarket print is separate from the daily candle.
- 50-day SMA through October 27Calculated from completed regular-session daily closes.
- 809.96
- 200-day SMA through October 27Calculated from completed regular-session daily closes.
- 687.14
- October 26 closePrior completed regular-session close.
- 644.21
- June 18 plotted-window intraday highHistorical intraday high, not a closing extreme.
- 1,145.00
Levels measured over Completed U.S. regular-session daily bars through October 27, 2026; 126-session plotted window. Right-side volume-by-price is an estimated partial-venue sample where shown.. A level measured over a different window can be a different number.
 See the chart on X →
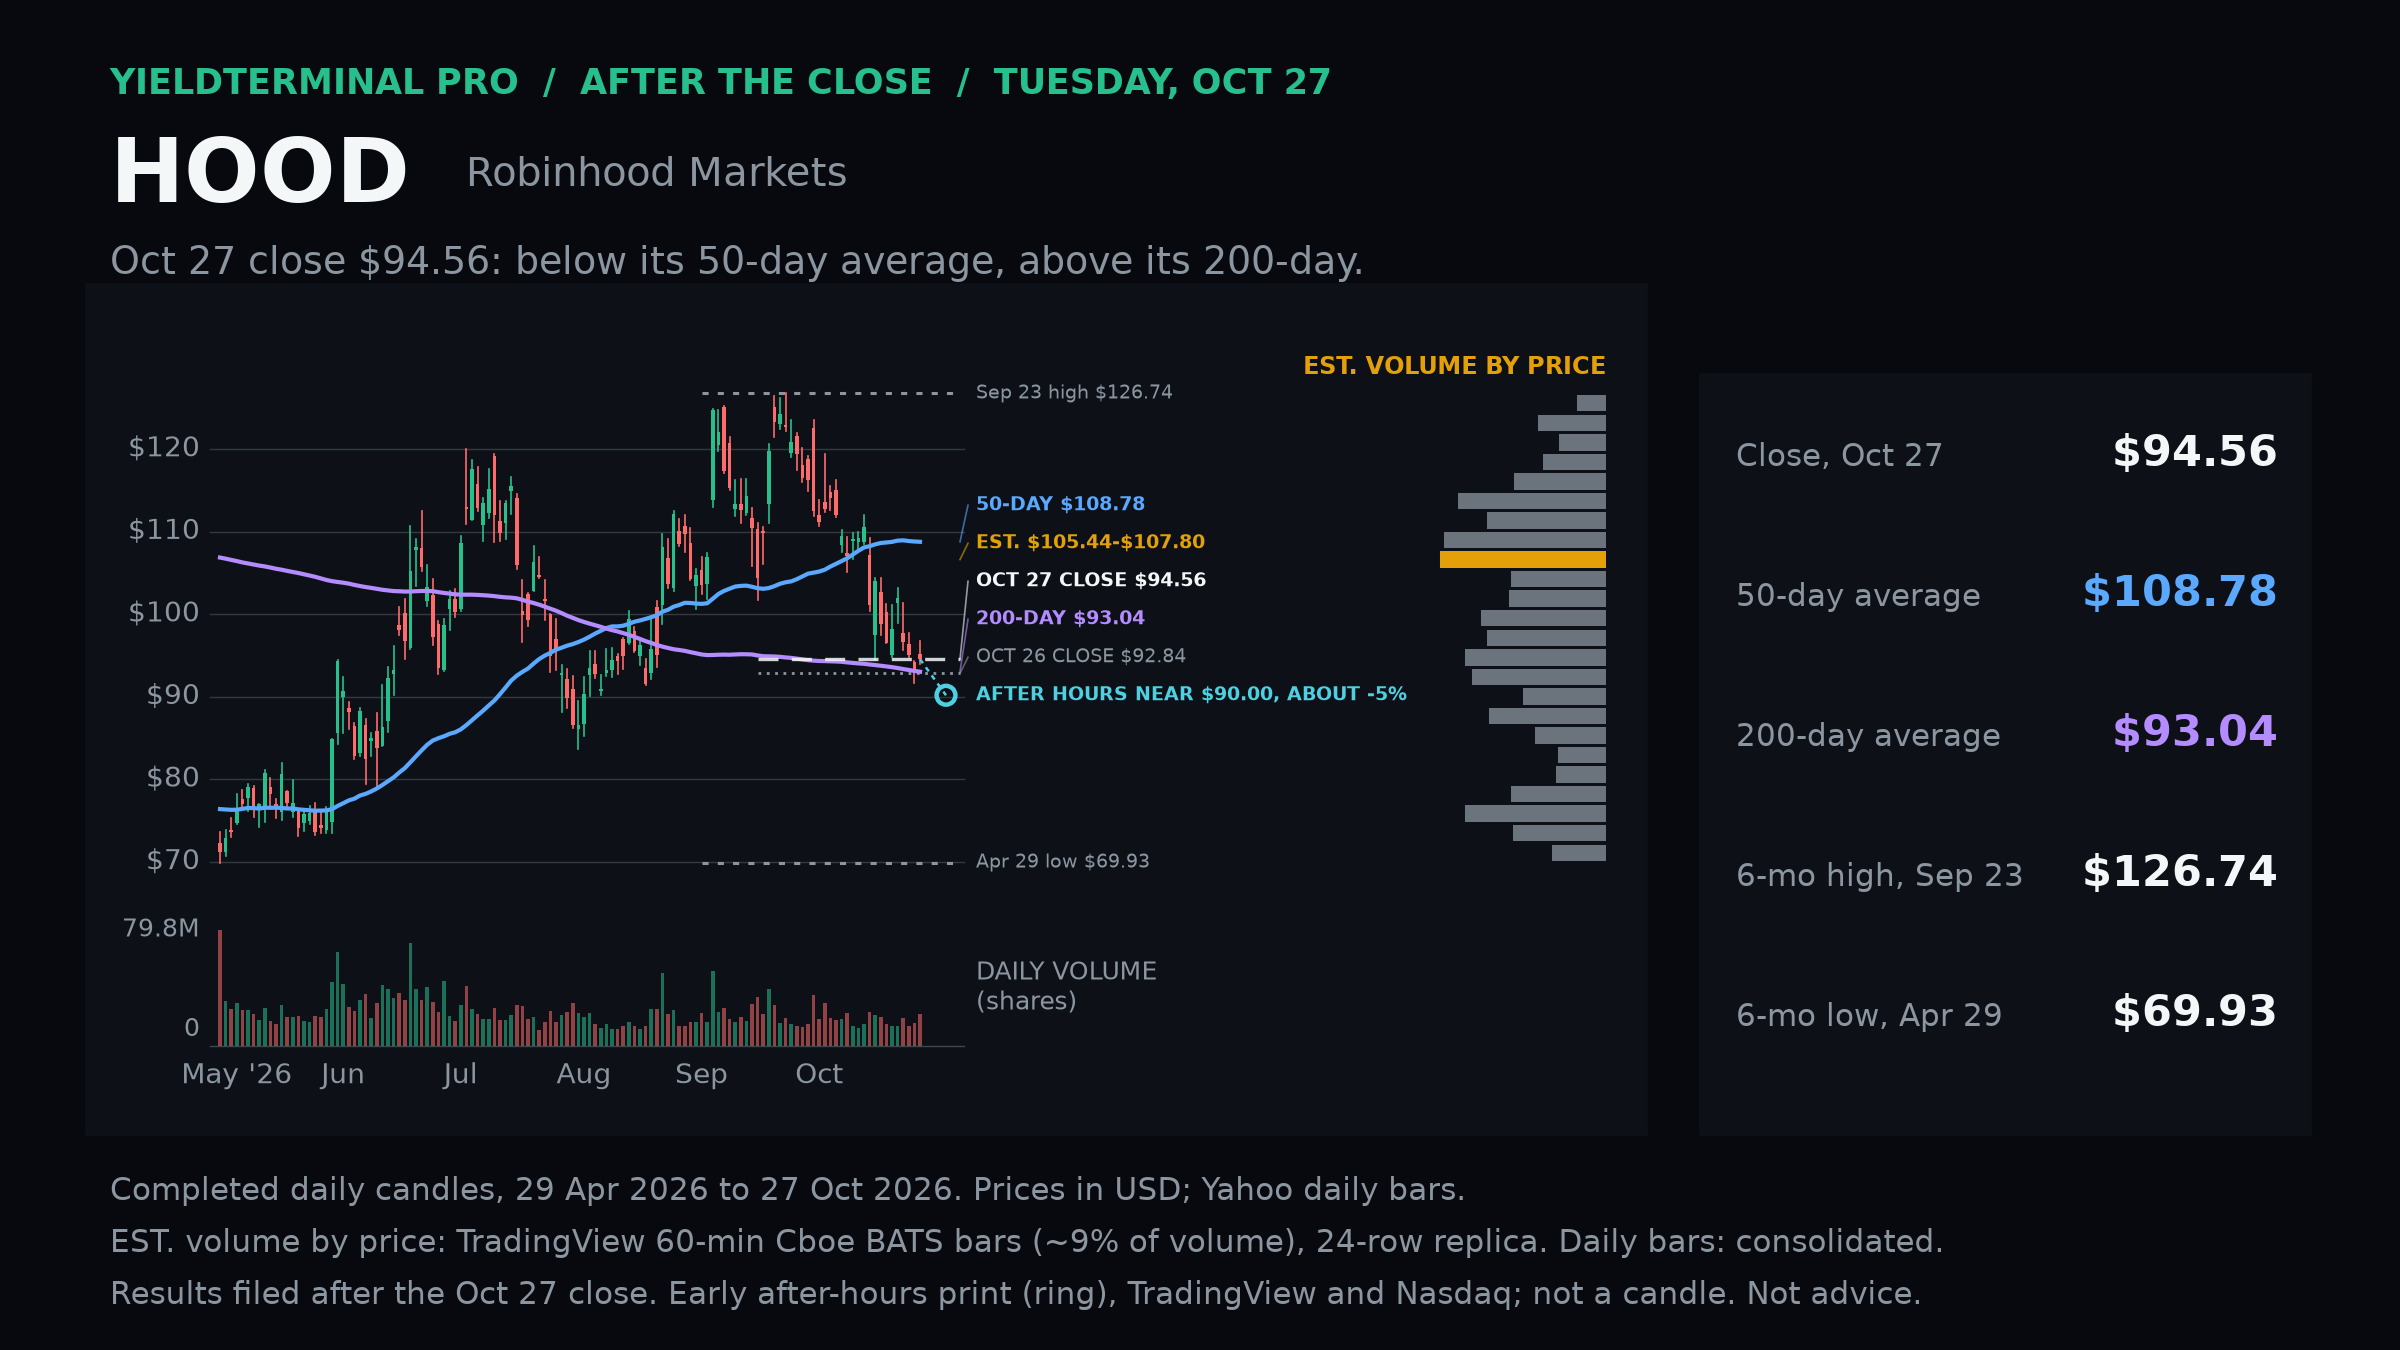
$HOODRobinhood Markets - October 27 After Close 94.56October 27 completed U.S. regular-session closeCompleted close held just above the 200-day average; an early postmarket print is separate from the daily candle.
- 50-day SMA through October 27Calculated from completed regular-session daily closes.
- 108.78
- 200-day SMA through October 27Calculated from completed regular-session daily closes.
- 93.04
- October 26 closePrior completed regular-session close.
- 92.84
- September 23 plotted-window intraday highHistorical intraday high, not a closing extreme.
- 126.74
Levels measured over Completed U.S. regular-session daily bars through October 27, 2026; 126-session plotted window. Right-side volume-by-price is an estimated partial-venue sample where shown.. A level measured over a different window can be a different number.
 See the chart on X →
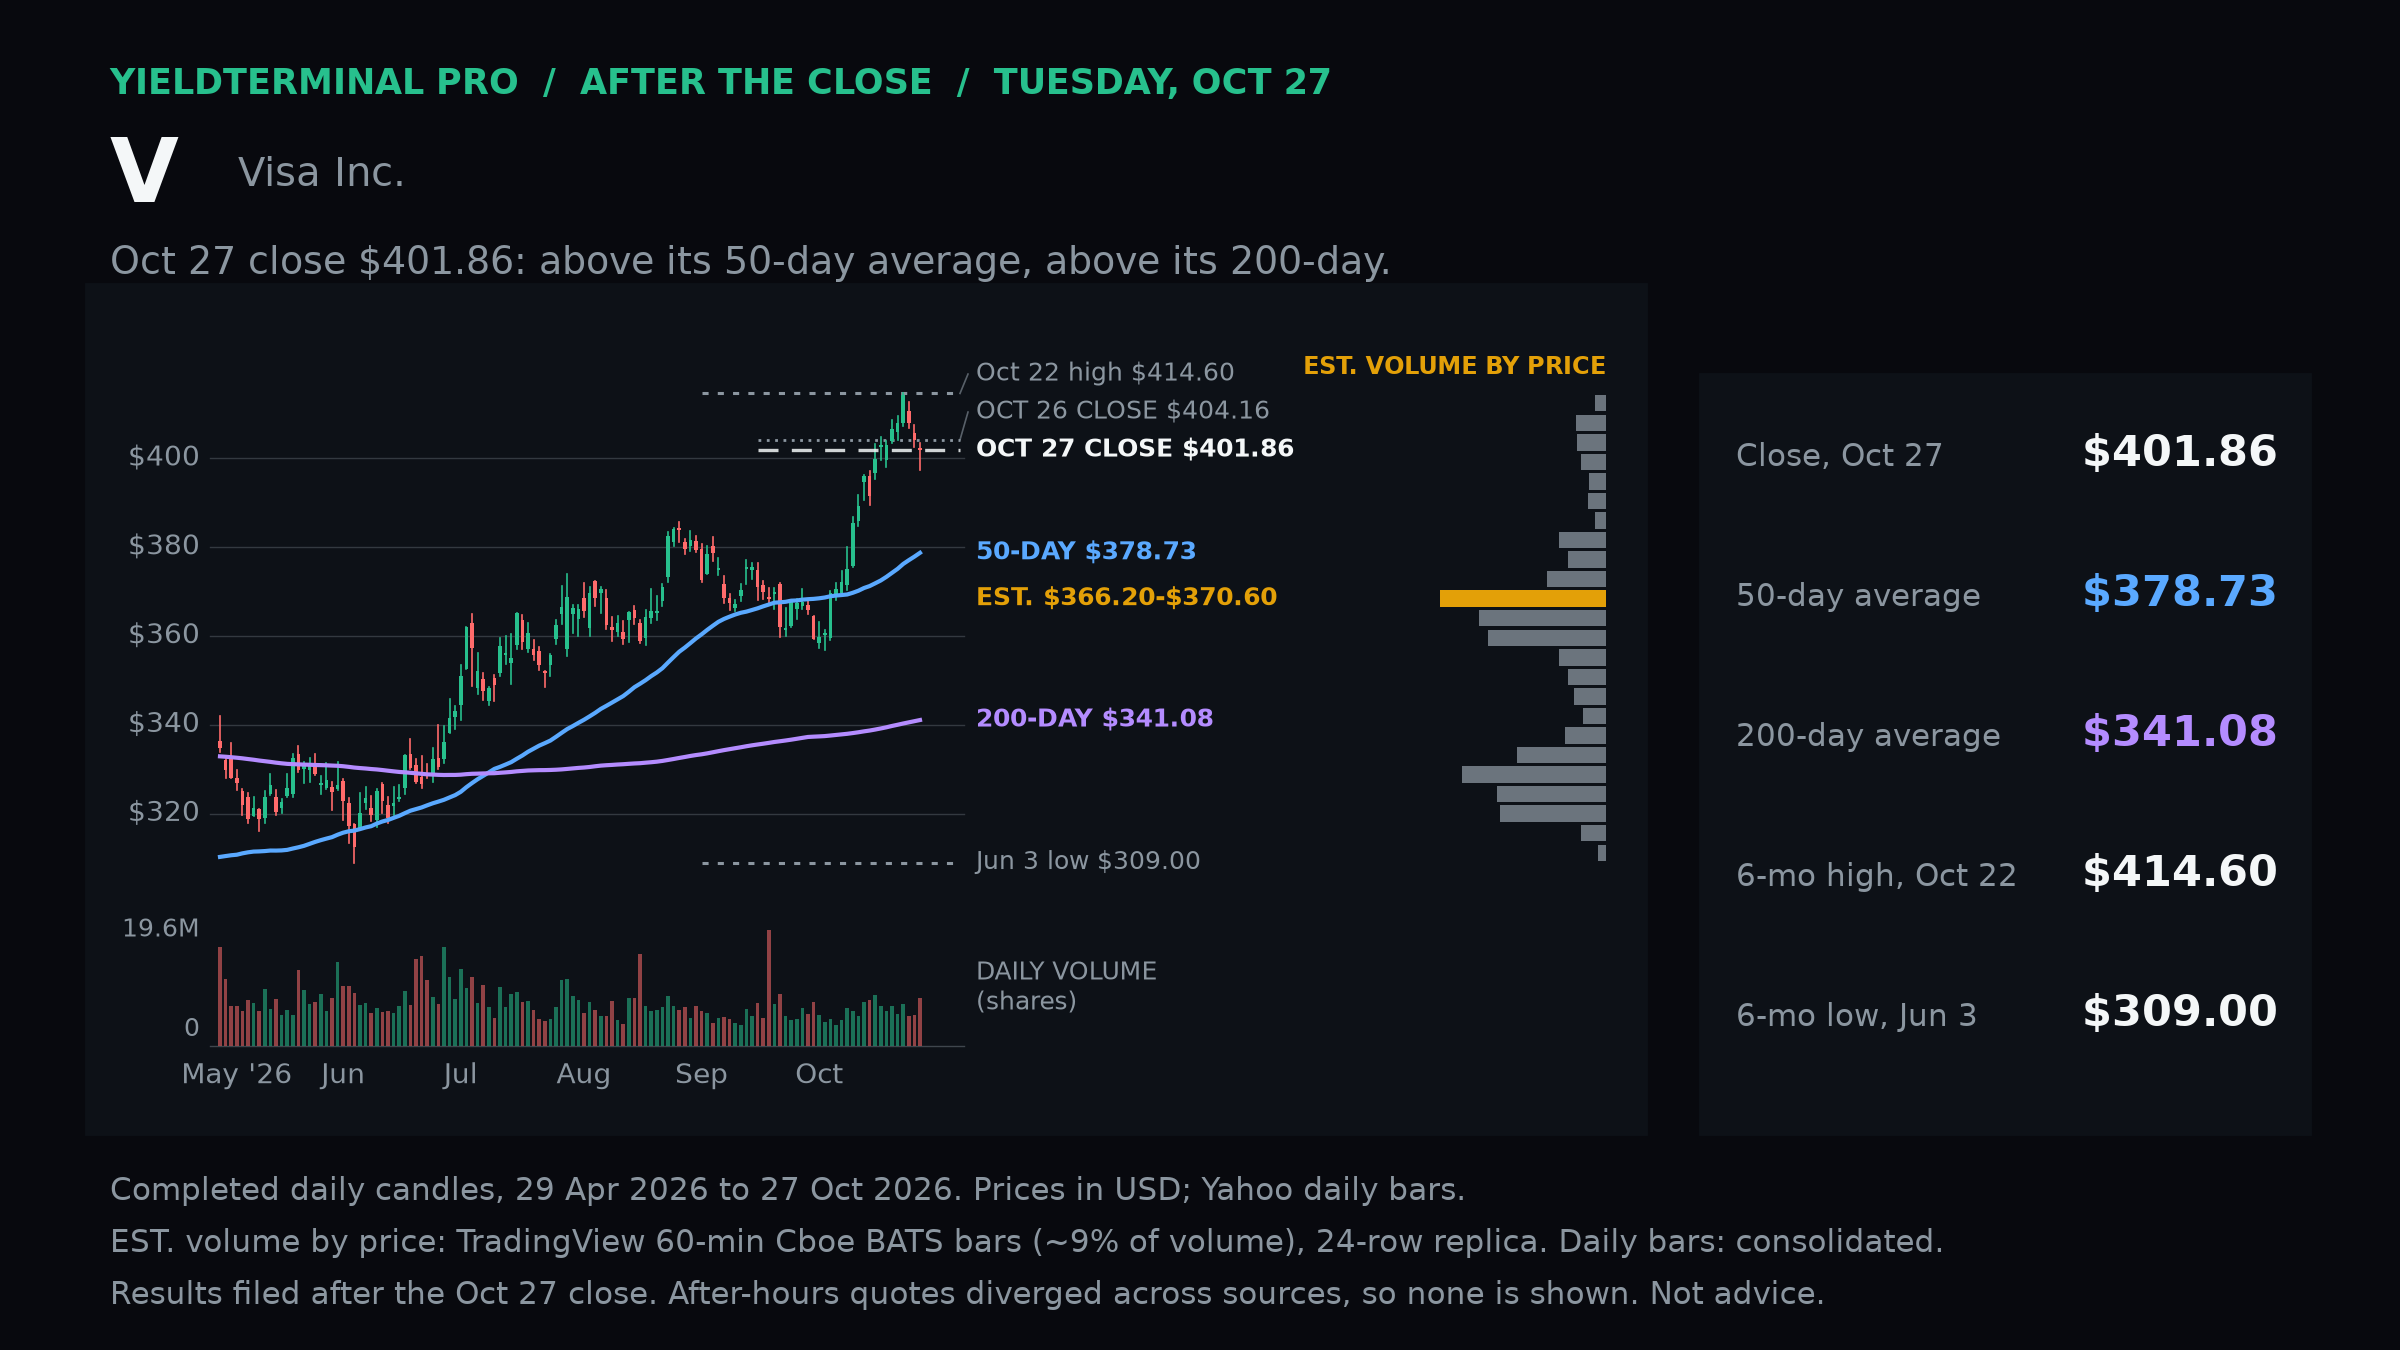
$VVisa - October 27 After Close 401.86October 27 completed U.S. regular-session closeClosed above both moving averages before its fiscal-quarter report.
- 50-day SMA through October 27Calculated from completed regular-session daily closes.
- 378.73
- 200-day SMA through October 27Calculated from completed regular-session daily closes.
- 341.08
- October 26 closePrior completed regular-session close.
- 404.16
- October 22 plotted-window intraday highHistorical intraday high, not a closing extreme.
- 414.60
Levels measured over Completed U.S. regular-session daily bars through October 27, 2026; 126-session plotted window. Right-side volume-by-price is an estimated partial-venue sample where shown.. A level measured over a different window can be a different number.
 See the chart on X →
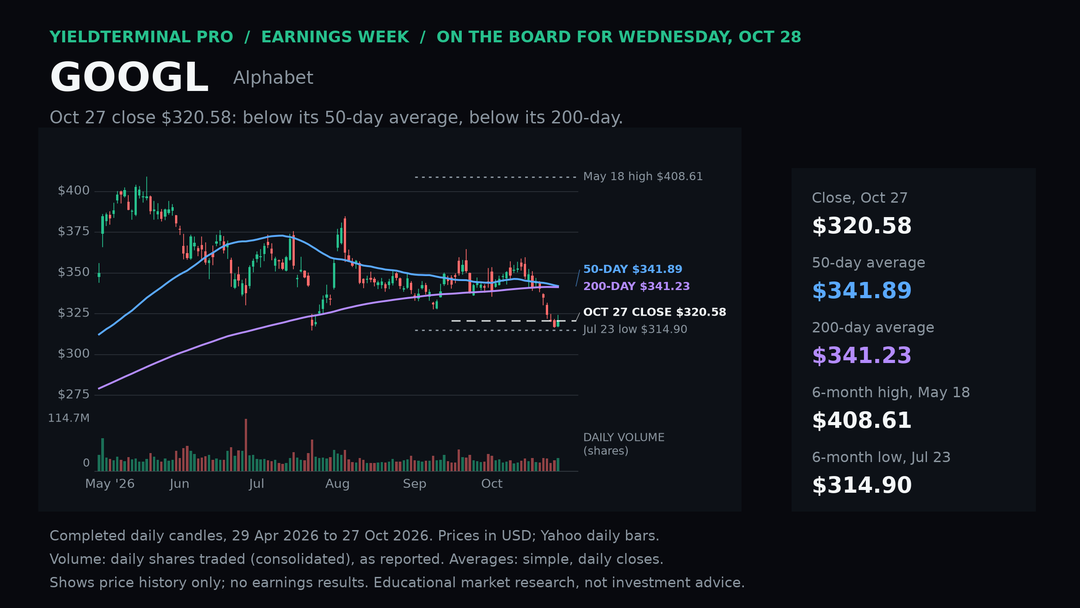
$GOOGLAlphabet - October 28 earnings preview chart 320.5827 October 2026 closeGOOGL closed at 320.58 on 27 October, below its 50-day average (341.89) and below its 200-day (341.23), ahead of its 28 October earnings report.
- 50-day averageSimple average of the last 50 daily closes at the 27 October close.
- 341.89
- 200-day averageSimple average of the last 200 daily closes at the 27 October close.
- 341.23
- 6-month high, 2026-05-18Highest intraday price in the plotted window.
- 408.61
- 6-month low, 2026-07-23Lowest intraday price in the plotted window.
- 314.90
Levels measured over Yahoo Finance daily bars, 2026-04-29 to 2026-10-27; simple averages of daily closes.. A level measured over a different window can be a different number.
 See the chart on X →
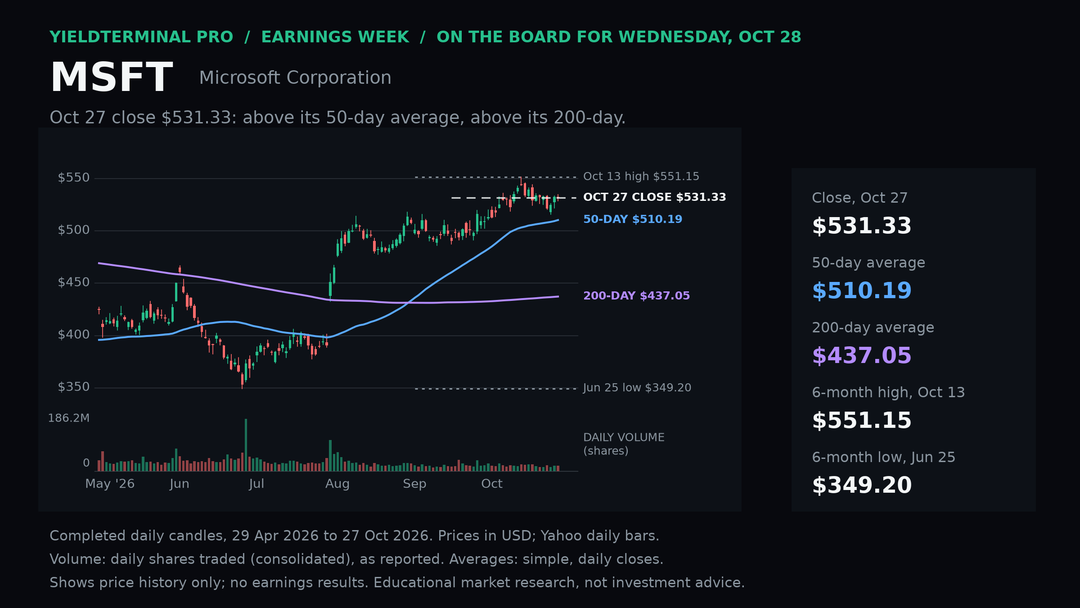
$MSFTMicrosoft - October 28 earnings preview chart 531.3327 October 2026 closeMSFT closed at 531.33 on 27 October, above its 50-day average (510.19) and above its 200-day (437.05), ahead of its 28 October earnings report.
- 50-day averageSimple average of the last 50 daily closes at the 27 October close.
- 510.19
- 200-day averageSimple average of the last 200 daily closes at the 27 October close.
- 437.05
- 6-month high, 2026-10-13Highest intraday price in the plotted window.
- 551.15
- 6-month low, 2026-06-25Lowest intraday price in the plotted window.
- 349.20
Levels measured over Yahoo Finance daily bars, 2026-04-29 to 2026-10-27; simple averages of daily closes.. A level measured over a different window can be a different number.
 See the chart on X →
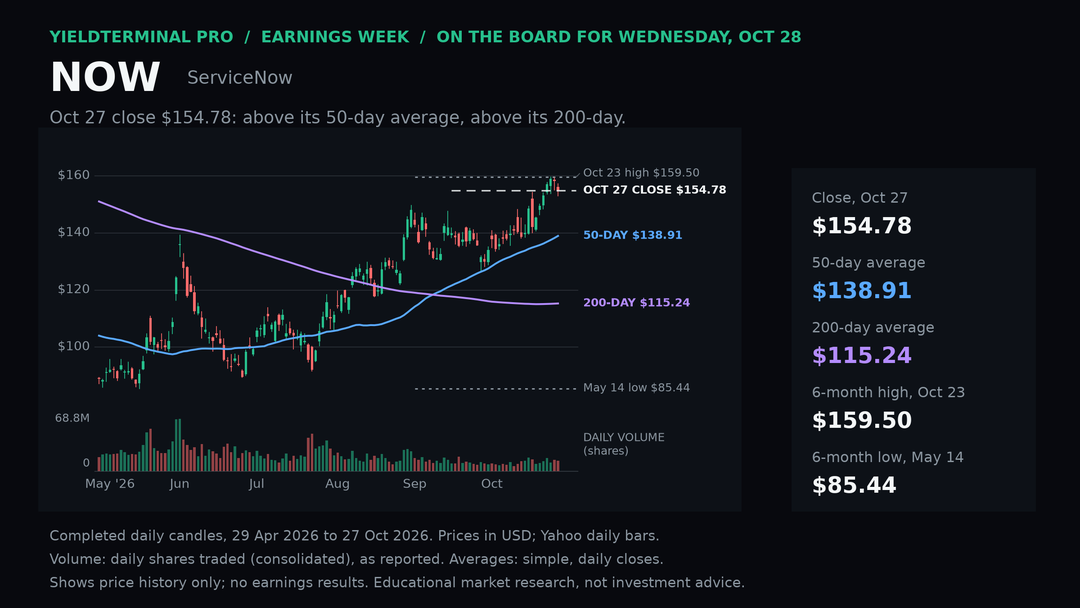
$NOWServiceNow - October 28 earnings preview chart 154.7827 October 2026 closeNOW closed at 154.78 on 27 October, above its 50-day average (138.91) and above its 200-day (115.24), ahead of its 28 October earnings report.
- 50-day averageSimple average of the last 50 daily closes at the 27 October close.
- 138.91
- 200-day averageSimple average of the last 200 daily closes at the 27 October close.
- 115.24
- 6-month high, 2026-10-23Highest intraday price in the plotted window.
- 159.50
- 6-month low, 2026-05-14Lowest intraday price in the plotted window.
- 85.44
Levels measured over Yahoo Finance daily bars, 2026-04-29 to 2026-10-27; simple averages of daily closes.. A level measured over a different window can be a different number.
 See the chart on X →
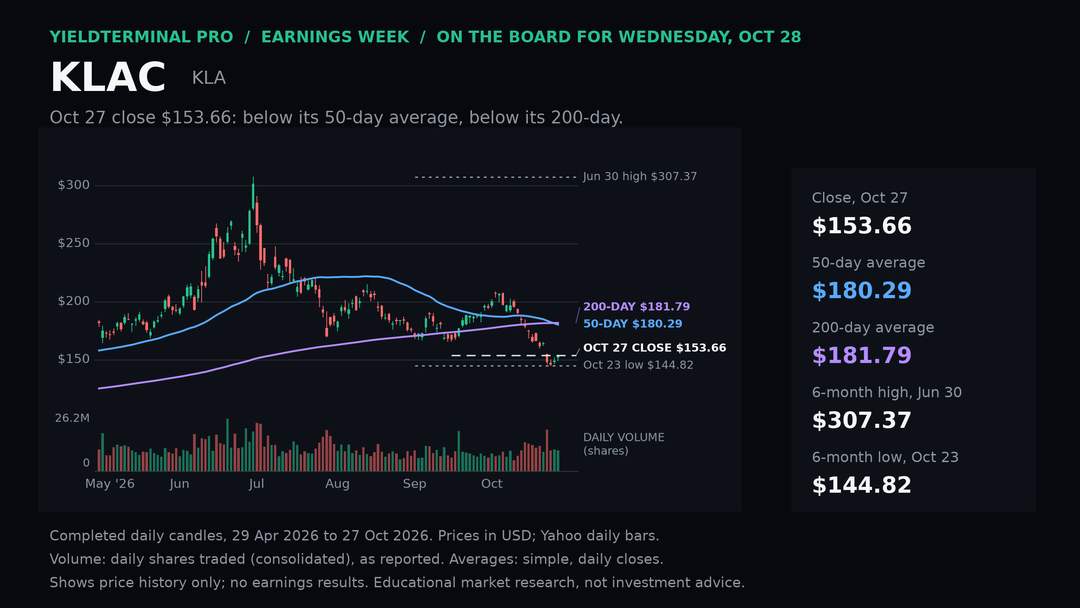
$KLACKLA - October 28 earnings preview chart 153.6627 October 2026 closeKLAC closed at 153.66 on 27 October, below its 50-day average (180.29) and below its 200-day (181.79), ahead of its 28 October earnings report.
- 50-day averageSimple average of the last 50 daily closes at the 27 October close.
- 180.29
- 200-day averageSimple average of the last 200 daily closes at the 27 October close.
- 181.79
- 6-month high, 2026-06-30Highest intraday price in the plotted window.
- 307.37
- 6-month low, 2026-10-23Lowest intraday price in the plotted window.
- 144.82
Levels measured over Yahoo Finance daily bars, 2026-04-29 to 2026-10-27; simple averages of daily closes.. A level measured over a different window can be a different number.
 See the chart on X →
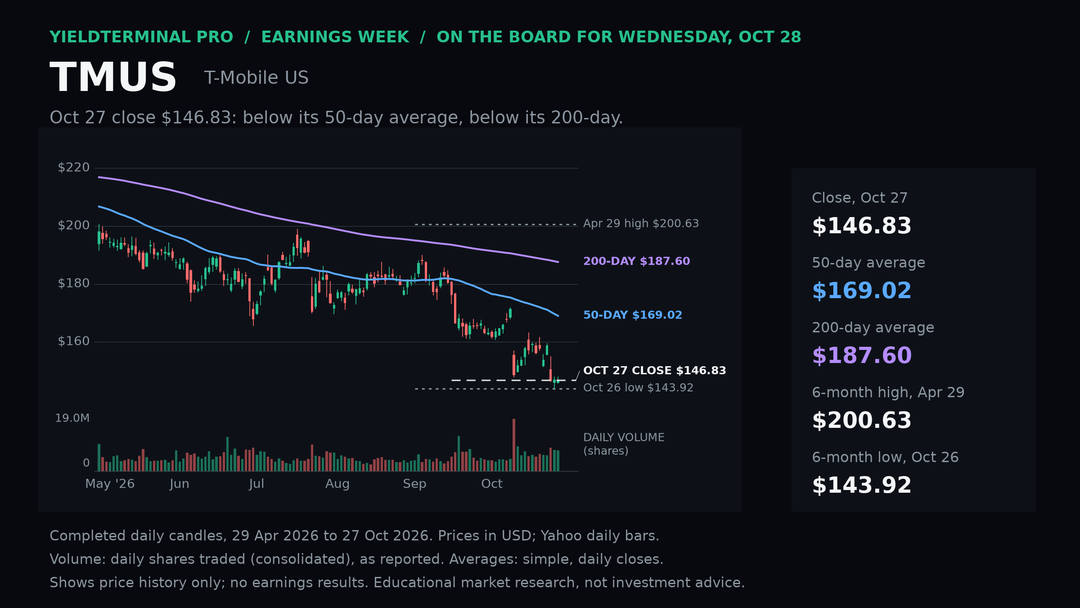
$TMUST-Mobile US - October 28 earnings preview chart 146.8327 October 2026 closeTMUS closed at 146.83 on 27 October, below its 50-day average (169.02) and below its 200-day (187.60), ahead of its 28 October earnings report.
- 50-day averageSimple average of the last 50 daily closes at the 27 October close.
- 169.02
- 200-day averageSimple average of the last 200 daily closes at the 27 October close.
- 187.60
- 6-month high, 2026-04-29Highest intraday price in the plotted window.
- 200.63
- 6-month low, 2026-10-26Lowest intraday price in the plotted window.
- 143.92
Levels measured over Yahoo Finance daily bars, 2026-04-29 to 2026-10-27; simple averages of daily closes.. A level measured over a different window can be a different number.
 See the chart on X →