Wed, 14 Oct 2026
49.12 10:12 a.m. ET regular-session observation
GFS is +5.18% versus the October 13 regular close at this 10:12 a.m. ET observation.
| After | Close | vs Wed, 14 Oct 2026 close | vs published price |
|---|---|---|---|
| 1 session | 48.76 | -0.37% | -0.73% |
| 5 sessions | 47.70 | -2.53% | -2.89% |
This note was marked to a 10:12 a.m. ET regular-session observation, not a close. The like-for-like column is the one measured from the Wed, 14 Oct 2026 close.
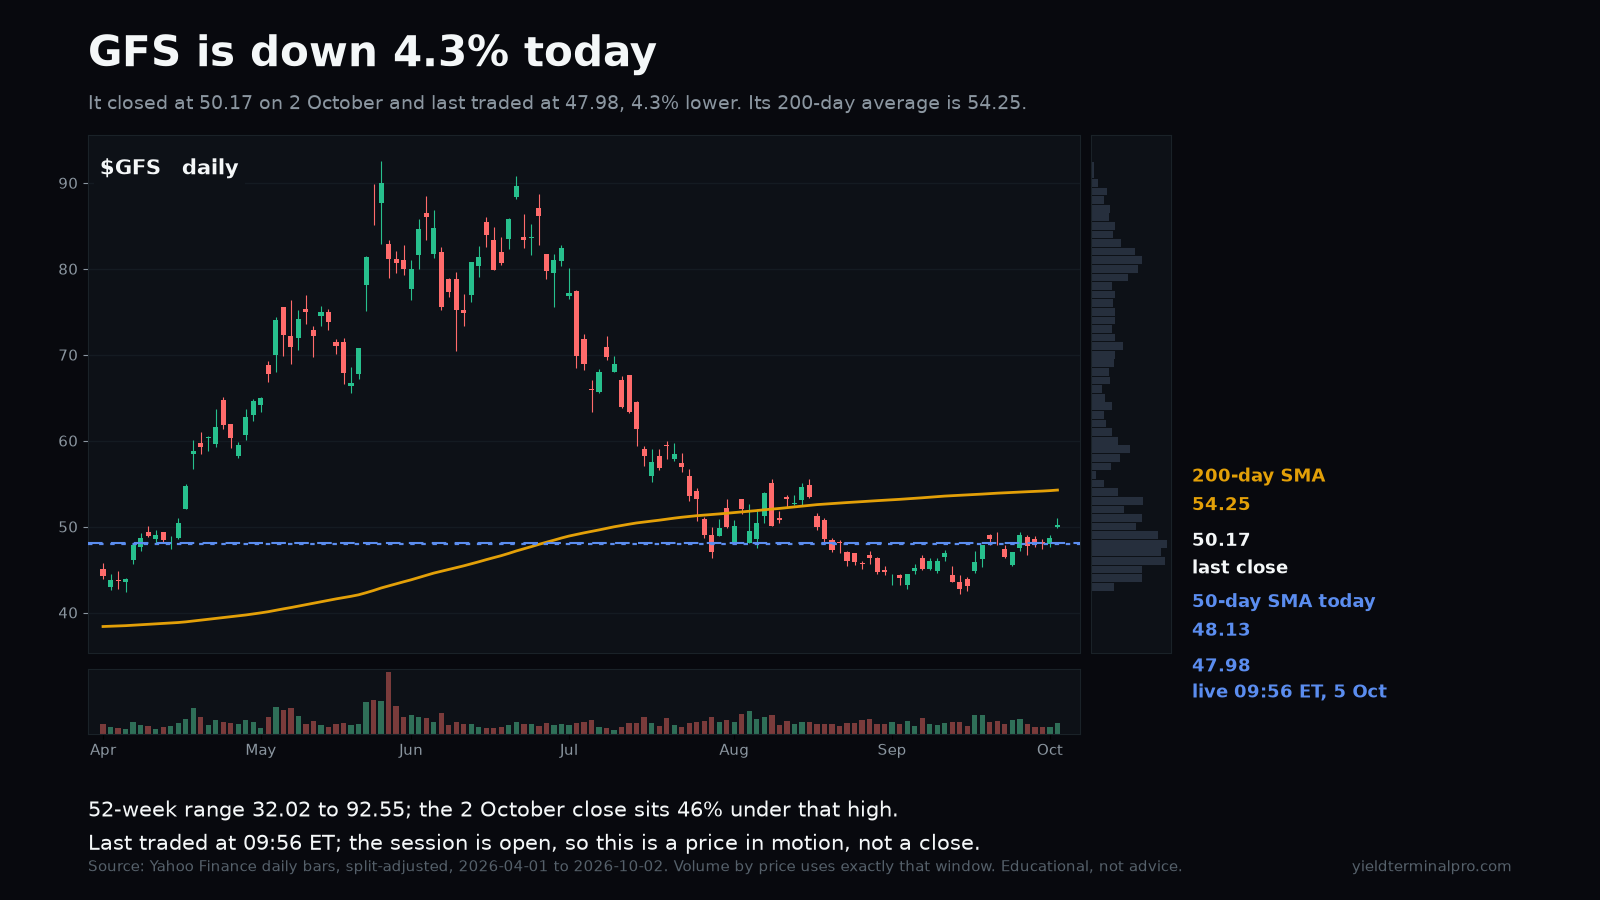
- 50-day SMA / hold 47.832 — published above, latest close belowcrossed
- Oct 13 low 46.22 — published above, latest close belowcrossed
- Oct 8 high 51.45 — published below, latest close below
- 200-day SMA 54.668 — published below, latest close below
- 20-day SMA through October 13 47.799 — published above, latest close belowcrossed
- 50-day SMA through October 13 47.832 — published above, latest close belowcrossed
- 200-day SMA through October 13 54.668 — published below, latest close below