← All daily levels

$V: every level, and what followed

V — October 25 Sunday Index Deep Dive — AXP/V business comparison

Each note as it was published, with the price that followed. We publish where price sits against its own levels, not where it is going, so nothing here is scored as right or wrong. Educational commentary, not investment advice.

3 notes, newest first, back to Fri, 23 Oct 2026.

Fri, 23 Oct 2026

407.92 October 23 completed U.S. regular-session close

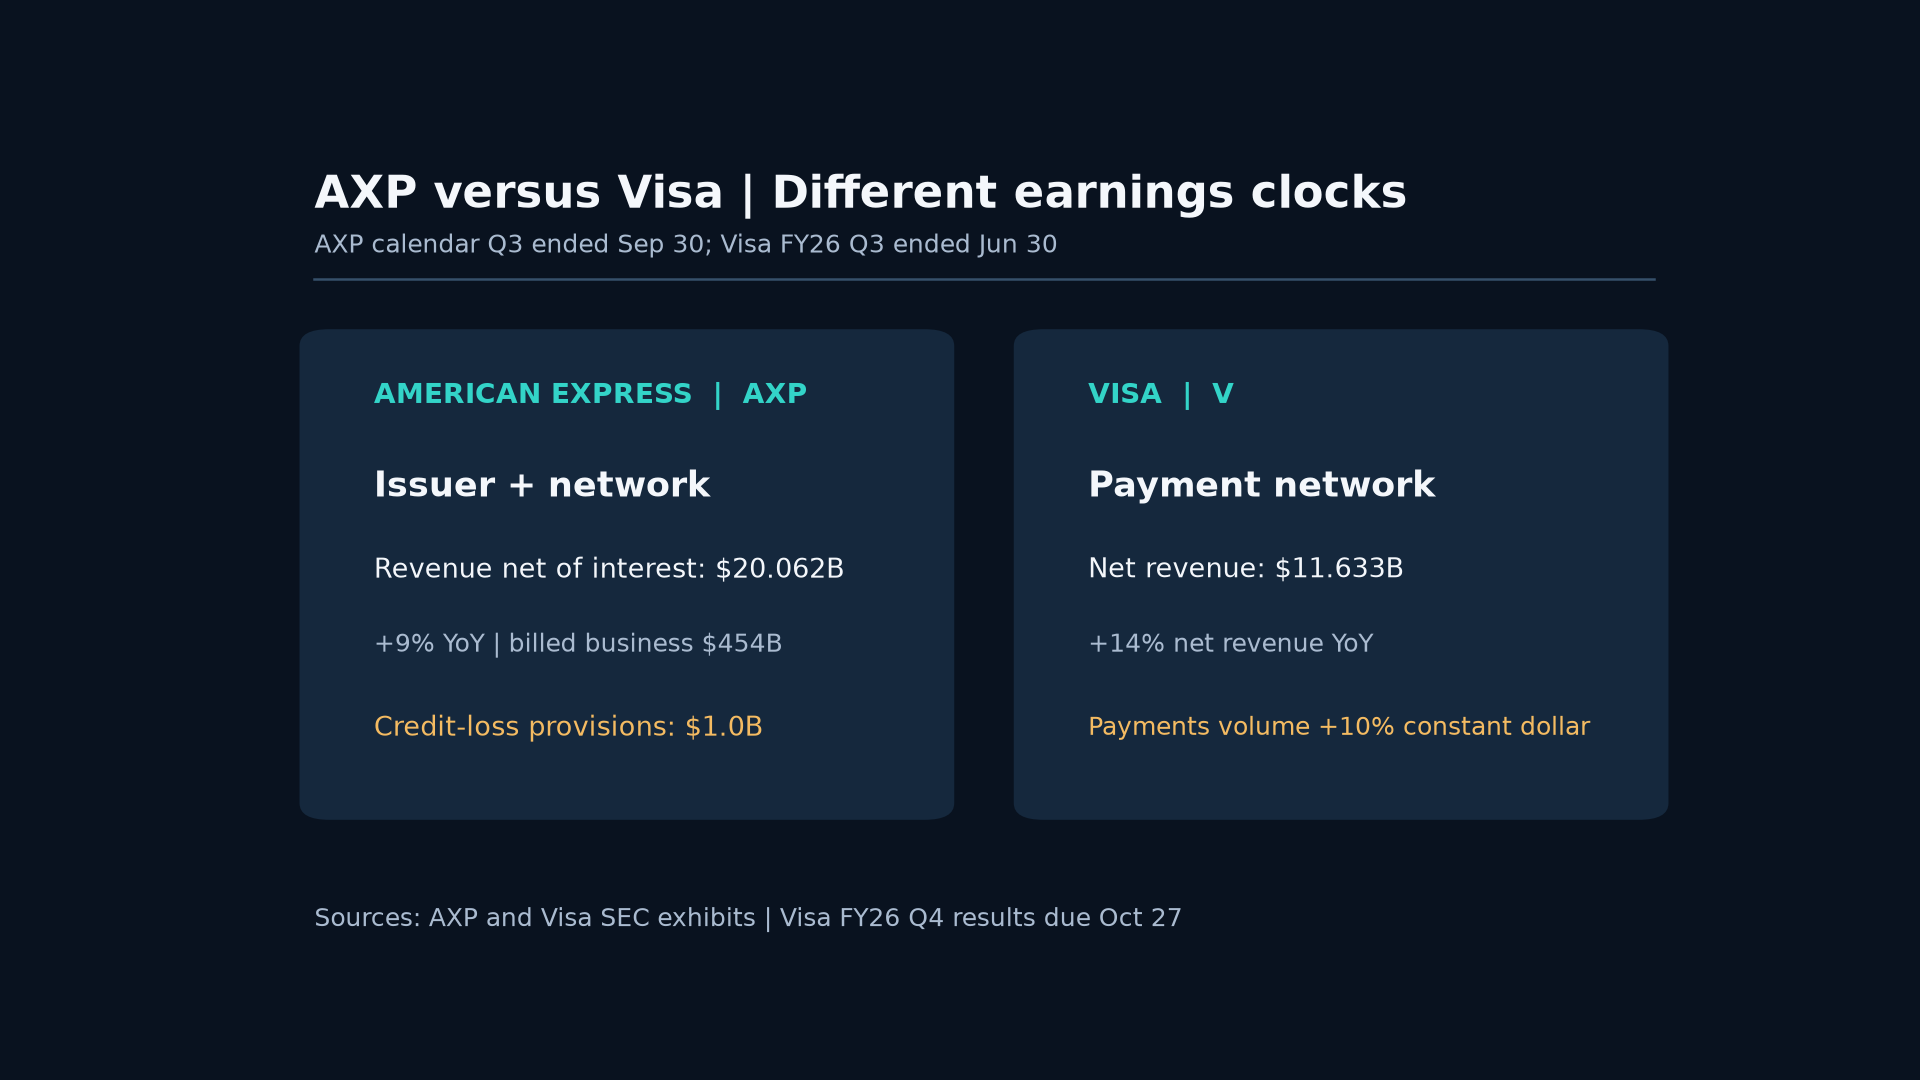
Side-by-side American Express calendar Q3 2026 and Visa fiscal Q3 2026 cards with different quarter ends. AXP, issuer and network: $20.062 billion revenue net of interest expense, up 9% year over year, $454 billion billed business and $1.0 billion credit-loss provisions. Visa, payment network: $11.633 billion net revenue, up 14% year over year, and payments volume up 10% in constant dollars. Visa fiscal Q4 results are scheduled for October 27.

No session has closed since this was published.
V chart published Fri, 23 Oct 2026
Fri, 23 Oct 2026

407.92 October 23 completed U.S. regular-session close

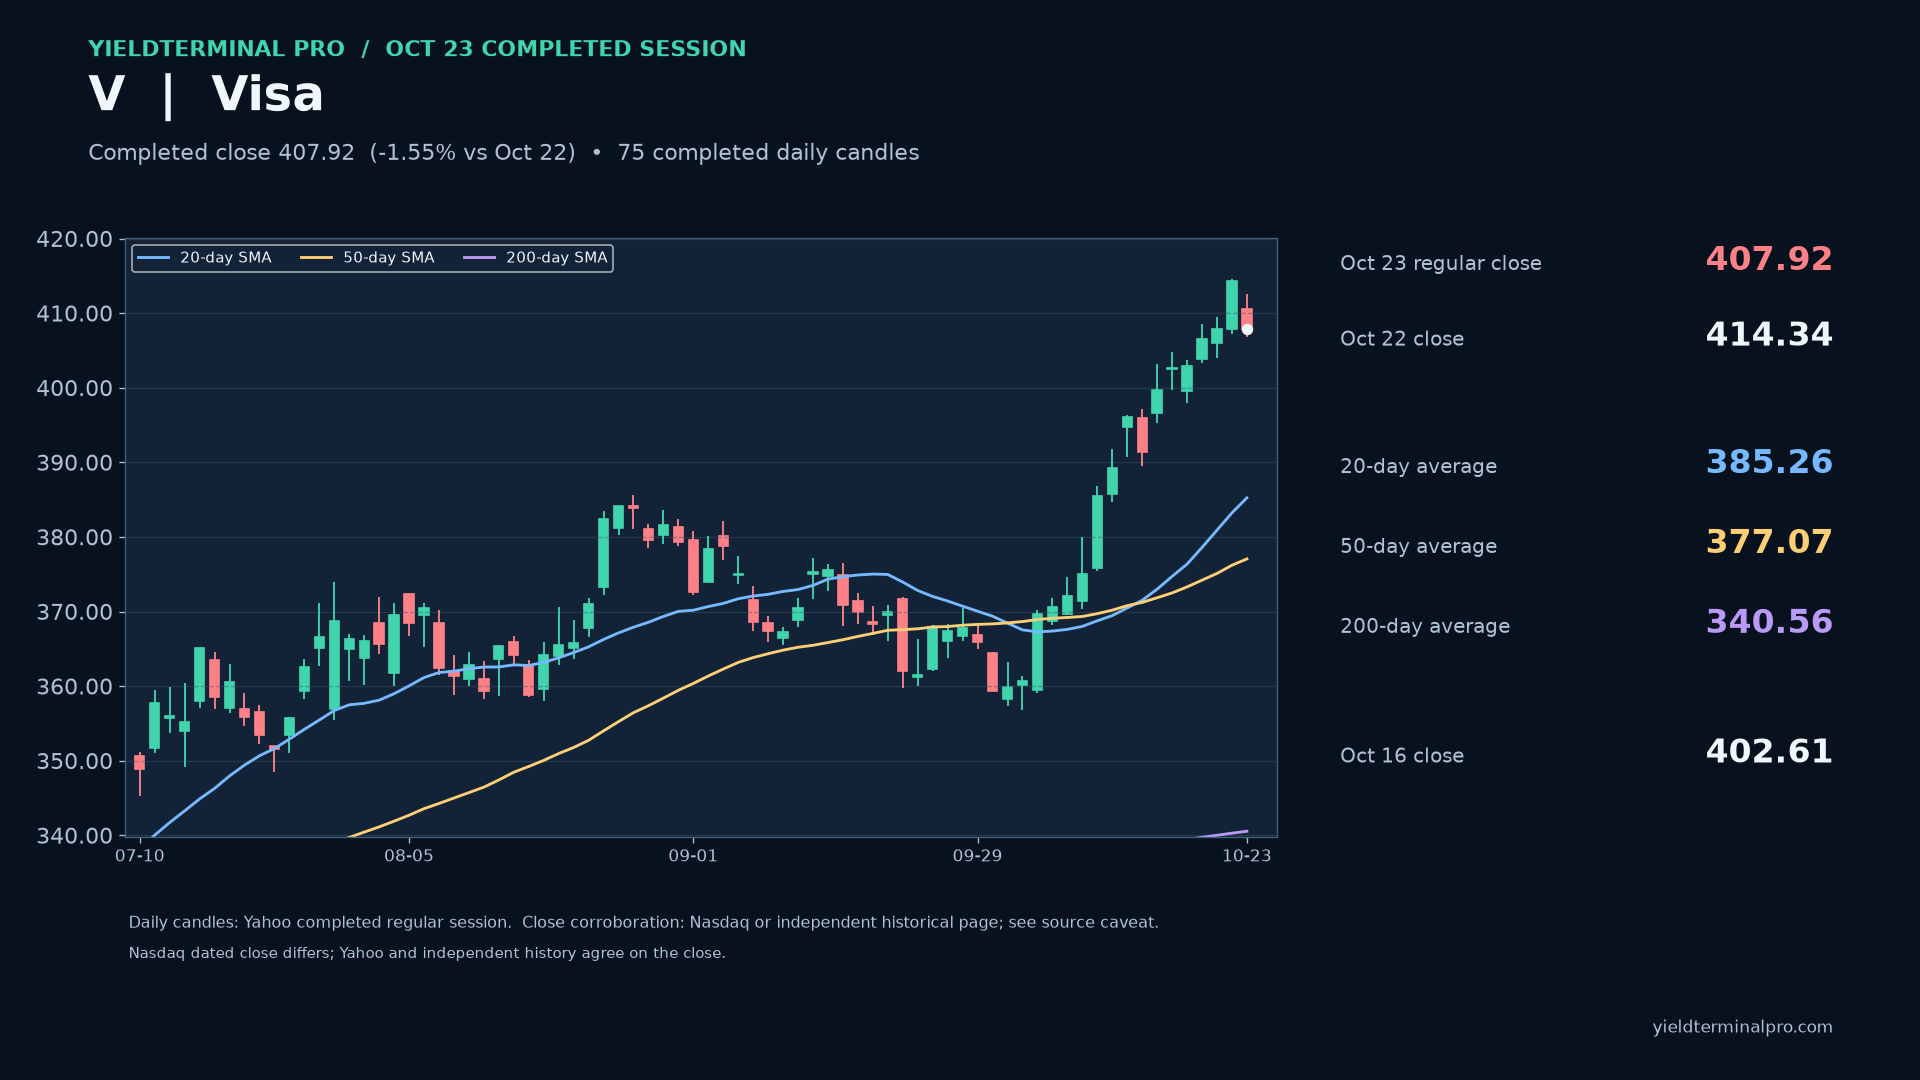
Visa (V) daily chart through October 23, 2026. Completed close 407.92, 20-day average 385.26, 50-day 377.07, 200-day 340.56.

No session has closed since this was published.
V chart published Fri, 23 Oct 2026
Fri, 23 Oct 2026

407.92 October 23 completed U.S. regular-session close

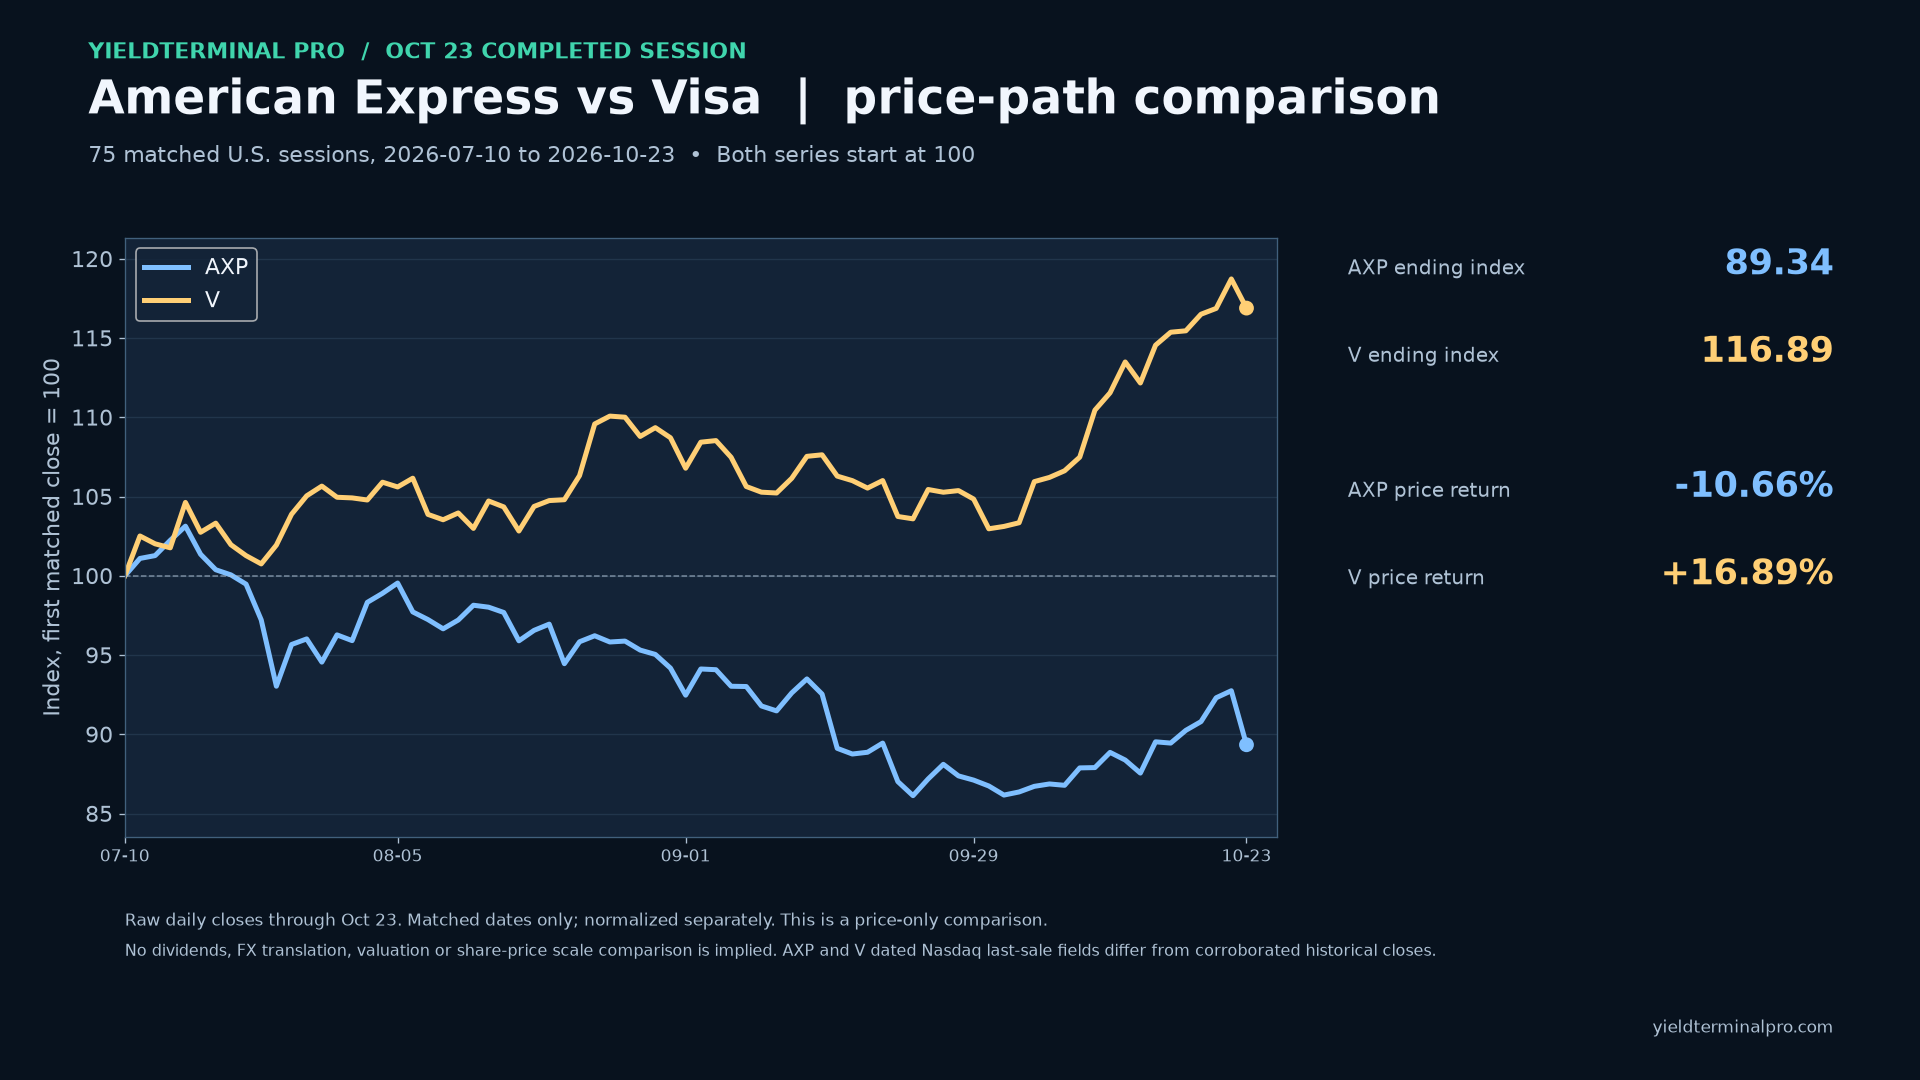
American Express and Visa closing-price paths for 75 matched U.S. sessions through October 23, each indexed to 100 at the first close. American Express -10.66%, Visa +16.89%. Price-only; dividends excluded.

No session has closed since this was published.
V chart published Fri, 23 Oct 2026

More on this name $V

Get the week in one email

Every level we marked, and whether price reached it. Free, Sundays.

Subscribing signs you up for the free YieldTerminal Sunday recap, one email a week. Educational only, not financial advice. Unsubscribe any time.

See the full disclaimer.