← All daily levels

$PM support and resistance levels, and what followed

Philip Morris International — October 23 earnings review

Each note as it was published, with the price that followed. We publish where price sits against its own levels, not where it is going, so nothing here is scored as right or wrong. Educational commentary, not investment advice.

2 notes, newest first, back to Sat, 17 Oct 2026.

Get the week in one email

Every level we marked, and what price did next. Free, Sundays.

Subscribing signs you up for the free YieldTerminal Sunday recap, one email a week. Educational only, not financial advice. Unsubscribe any time.

Fri, 23 Oct 2026

201.74 October 22 completed regular-session close

PM closed October 22 at $201.74, above its 50-day average ($192.32) and above its 200-day average ($180.66). The October 22 high ($201.89) and low ($197.00) are dated reference levels. This is completed daily history, not an October 23 quote.

No session has closed since this was published.
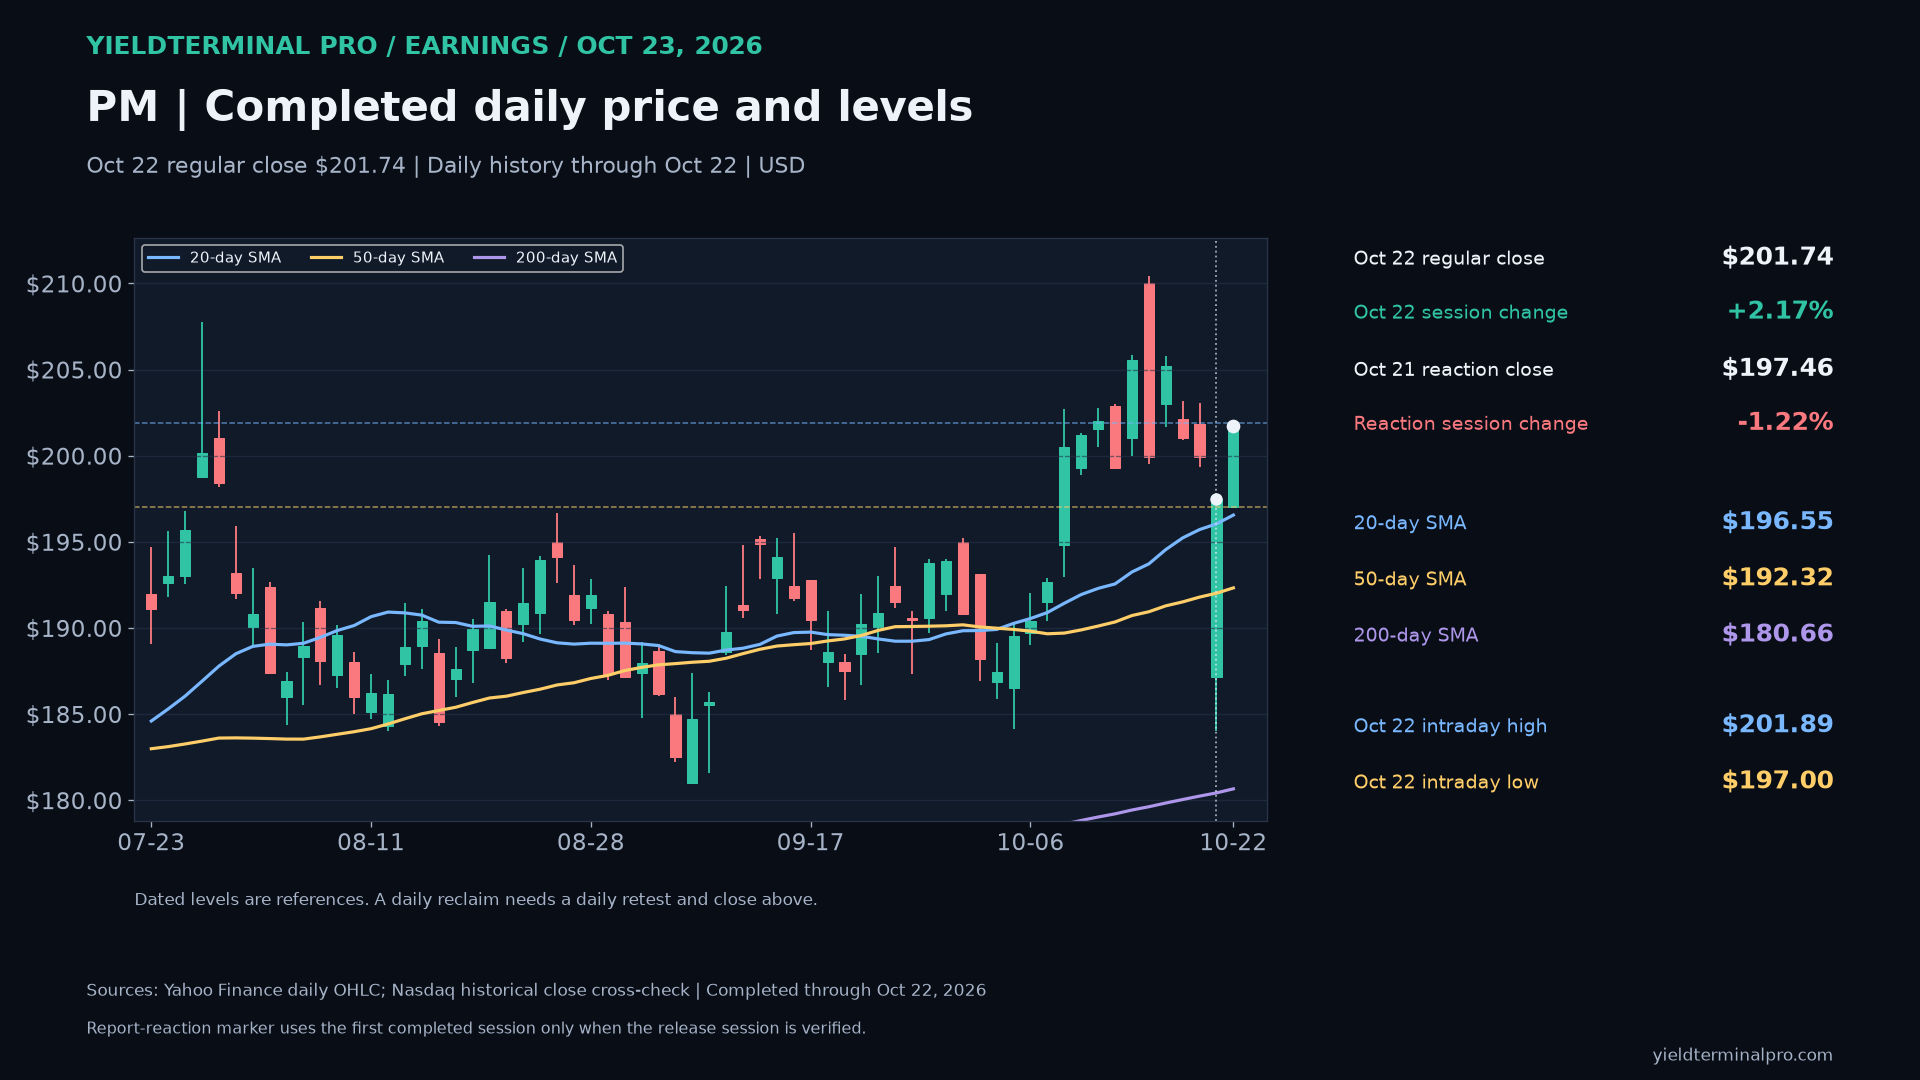
PM chart published Fri, 23 Oct 2026
Sat, 17 Oct 2026

205.20 October 16 regular close

October 16 close $205.20 was above the 50-session SMA ($191.28) and above the 200-session SMA ($179.83). Earnings preview for October 19-23; historical levels do not bound an earnings gap.

AfterClosevs Sat, 17 Oct 2026 closevs published price
1 session201.05—-2.02%
5 sessions199.47—-2.79%
  • 50-session SMA 191.28 — published above, latest close above
  • 200-session SMA 179.834 — published above, latest close above
PM chart published Sat, 17 Oct 2026

See the full disclaimer.