Fiscal 2027 Q2 GAAP EPS was $2.31, including about $0.28 from tariff refunds; net sales rose 3.5%.
No session has closed since this was published.
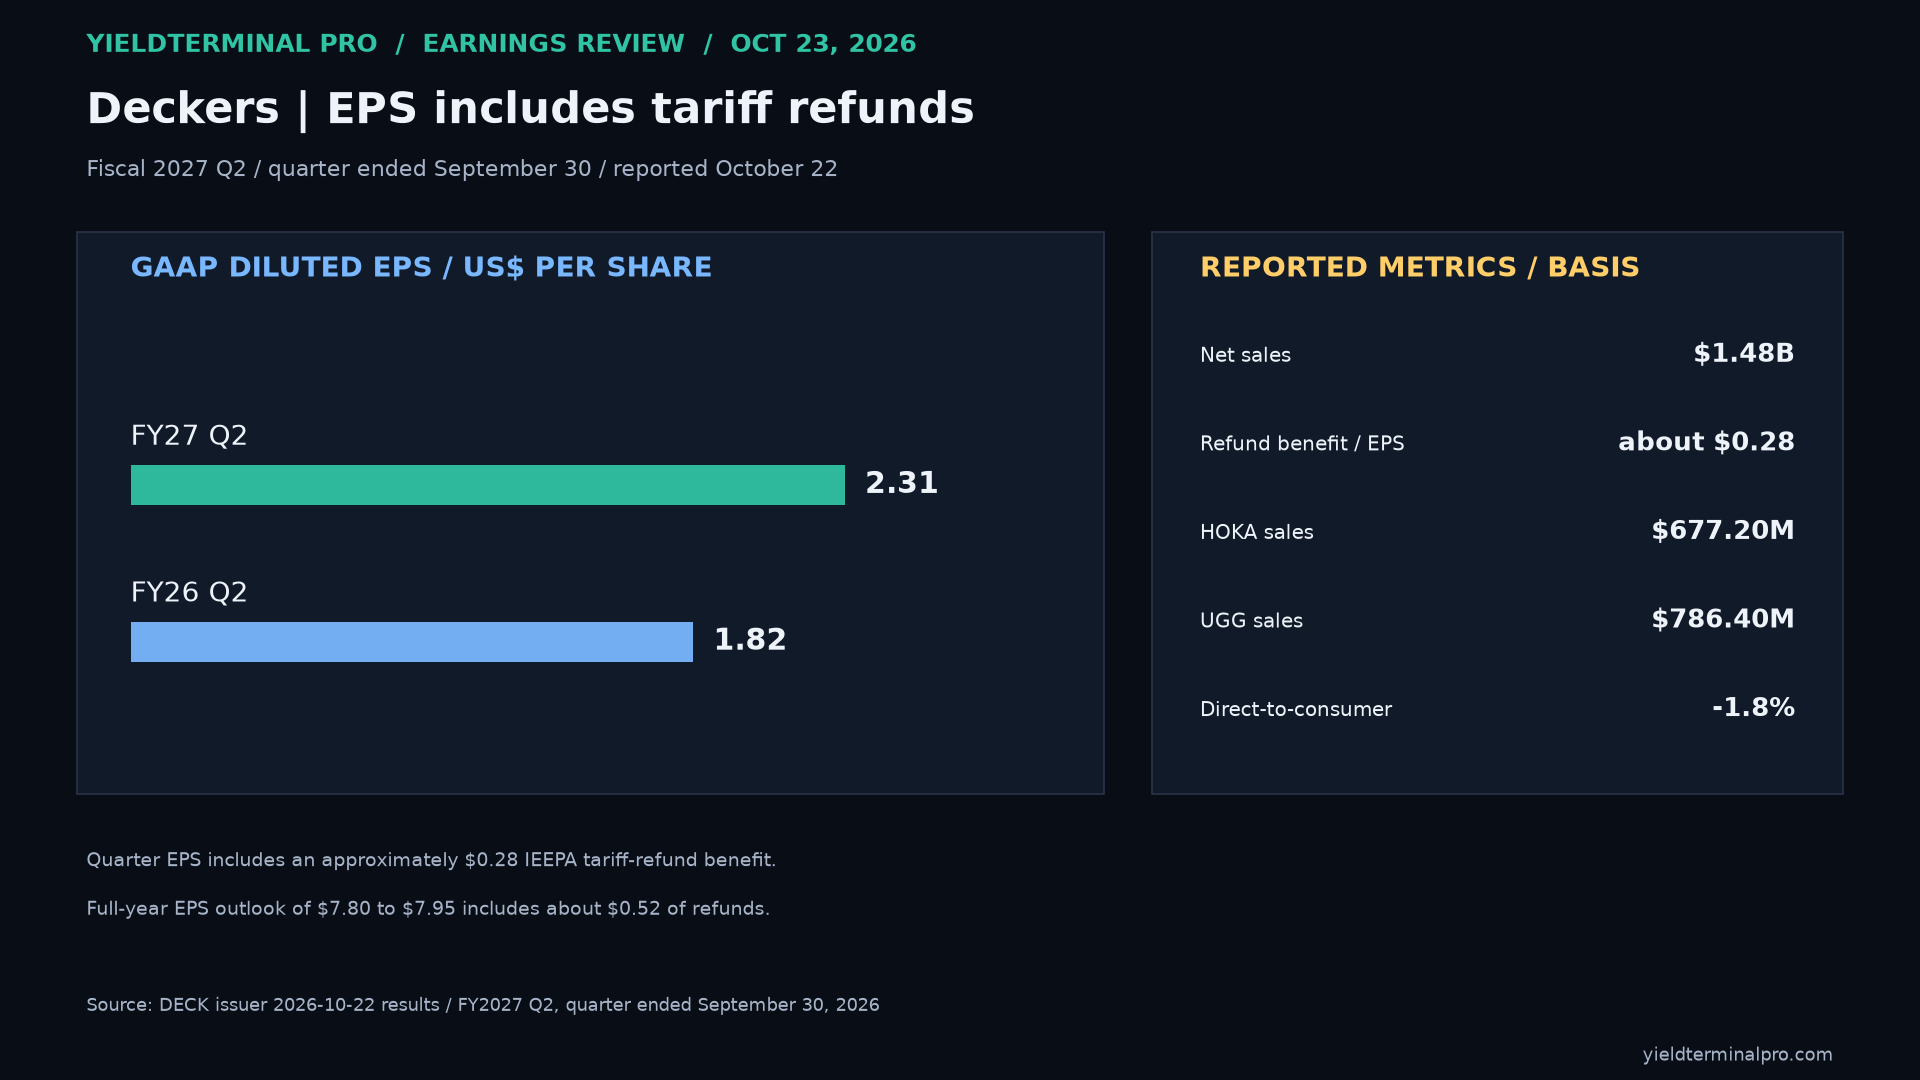
Deckers Outdoor Corporation — FY2027 Q2, quarter ended September 30, 2026 issuer results
Each note as it was published, with the price that followed. We publish where price sits against its own levels, not where it is going, so nothing here is scored as right or wrong. Educational commentary, not investment advice.
6 notes, newest first, back to Sat, 17 Oct 2026.
Every level we marked, and what price did next. Free, Sundays.
Subscribing signs you up for the free YieldTerminal Sunday recap, one email a week. Educational only, not financial advice. Unsubscribe any time.
Fiscal 2027 Q2 GAAP EPS was $2.31, including about $0.28 from tariff refunds; net sales rose 3.5%.
No session has closed since this was published.
81.09 October 23 completed regular-session close
Completed October 23 regular-session close $81.09, below 20-day, below 50-day, below 200-day. Daily reclaim conditions are distinct from an intraday touch.
No session has closed since this was published.
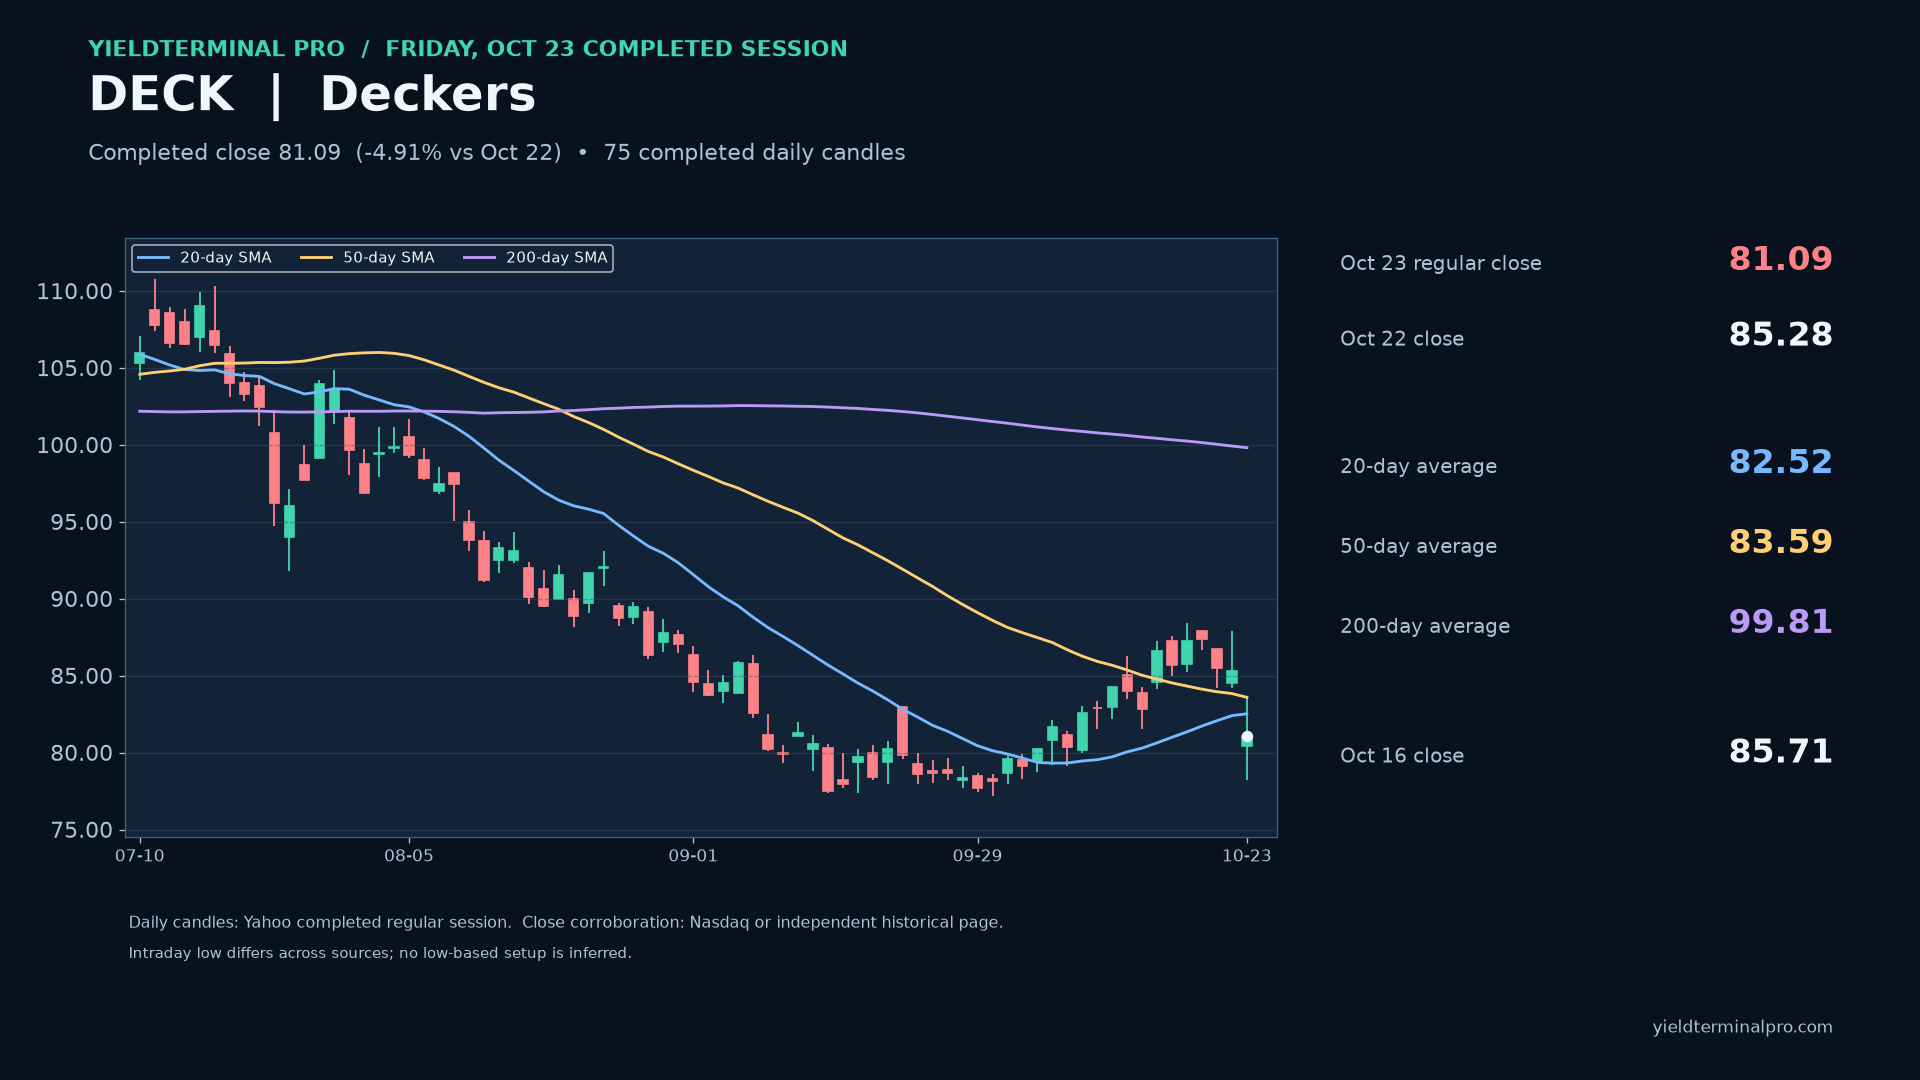
81.09 October 23 completed regular-session close; supporting financial or relative chart
Deckers September-quarter sales and On June-quarter sales use different reporting dates and currencies; the chart keeps them separate.
No session has closed since this was published.
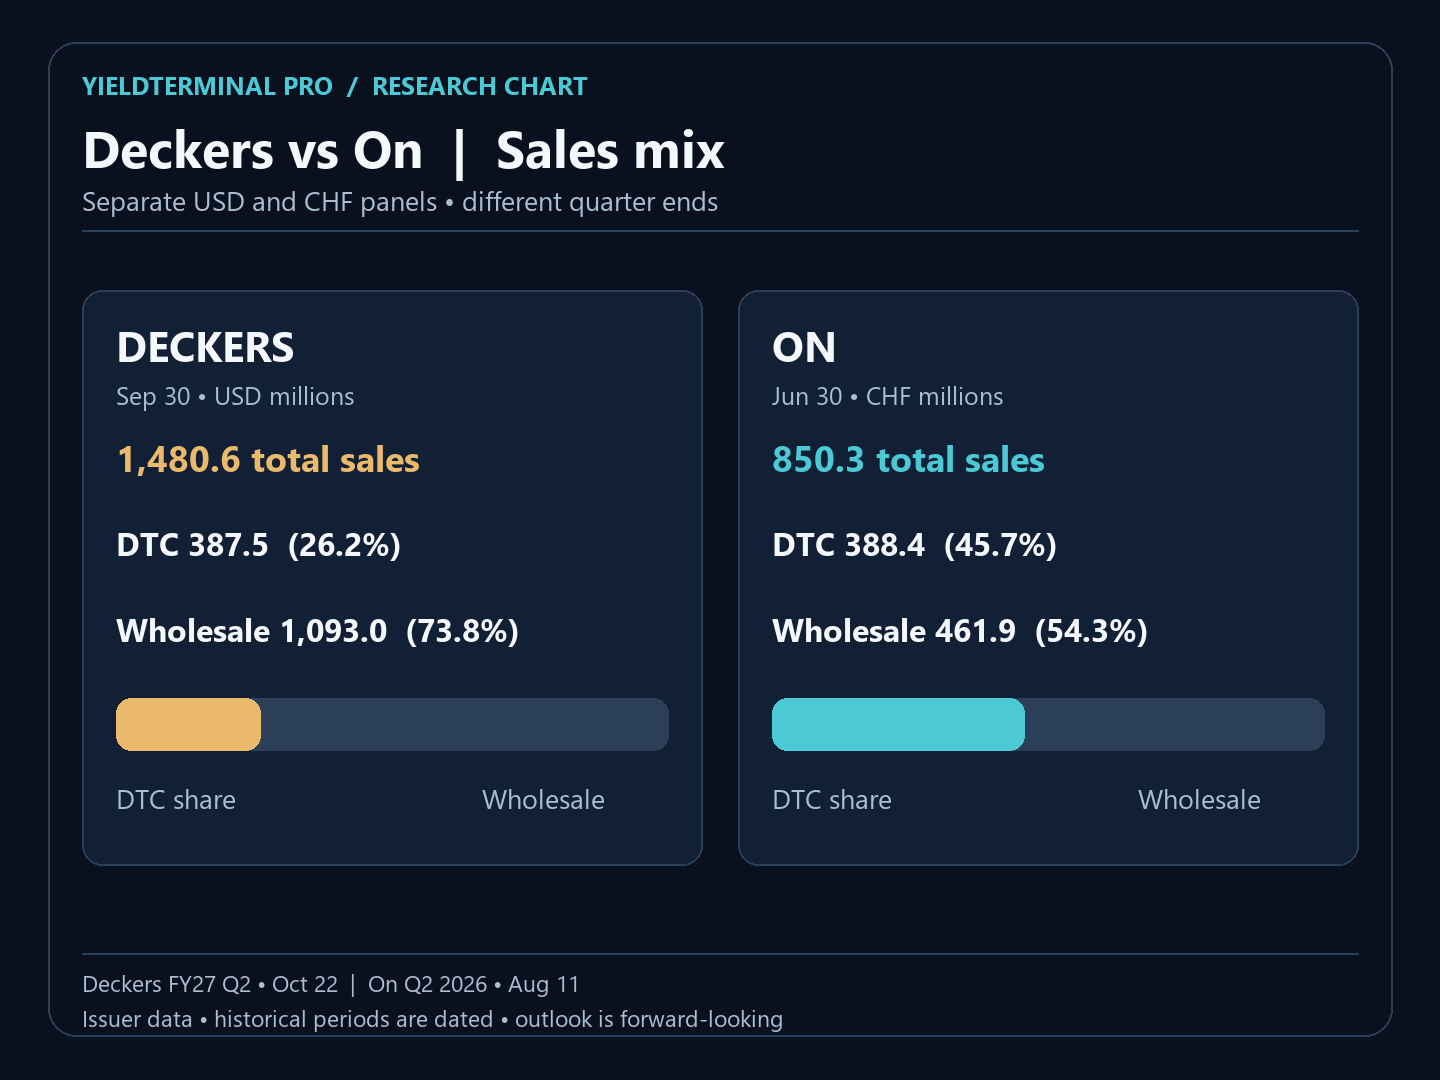
81.09 October 23 completed regular-session close; supporting financial or relative chart
Deckers GAAP margins include a tariff-refund benefit; On adjusted EBITDA is non-IFRS and belongs to its older June quarter.
No session has closed since this was published.
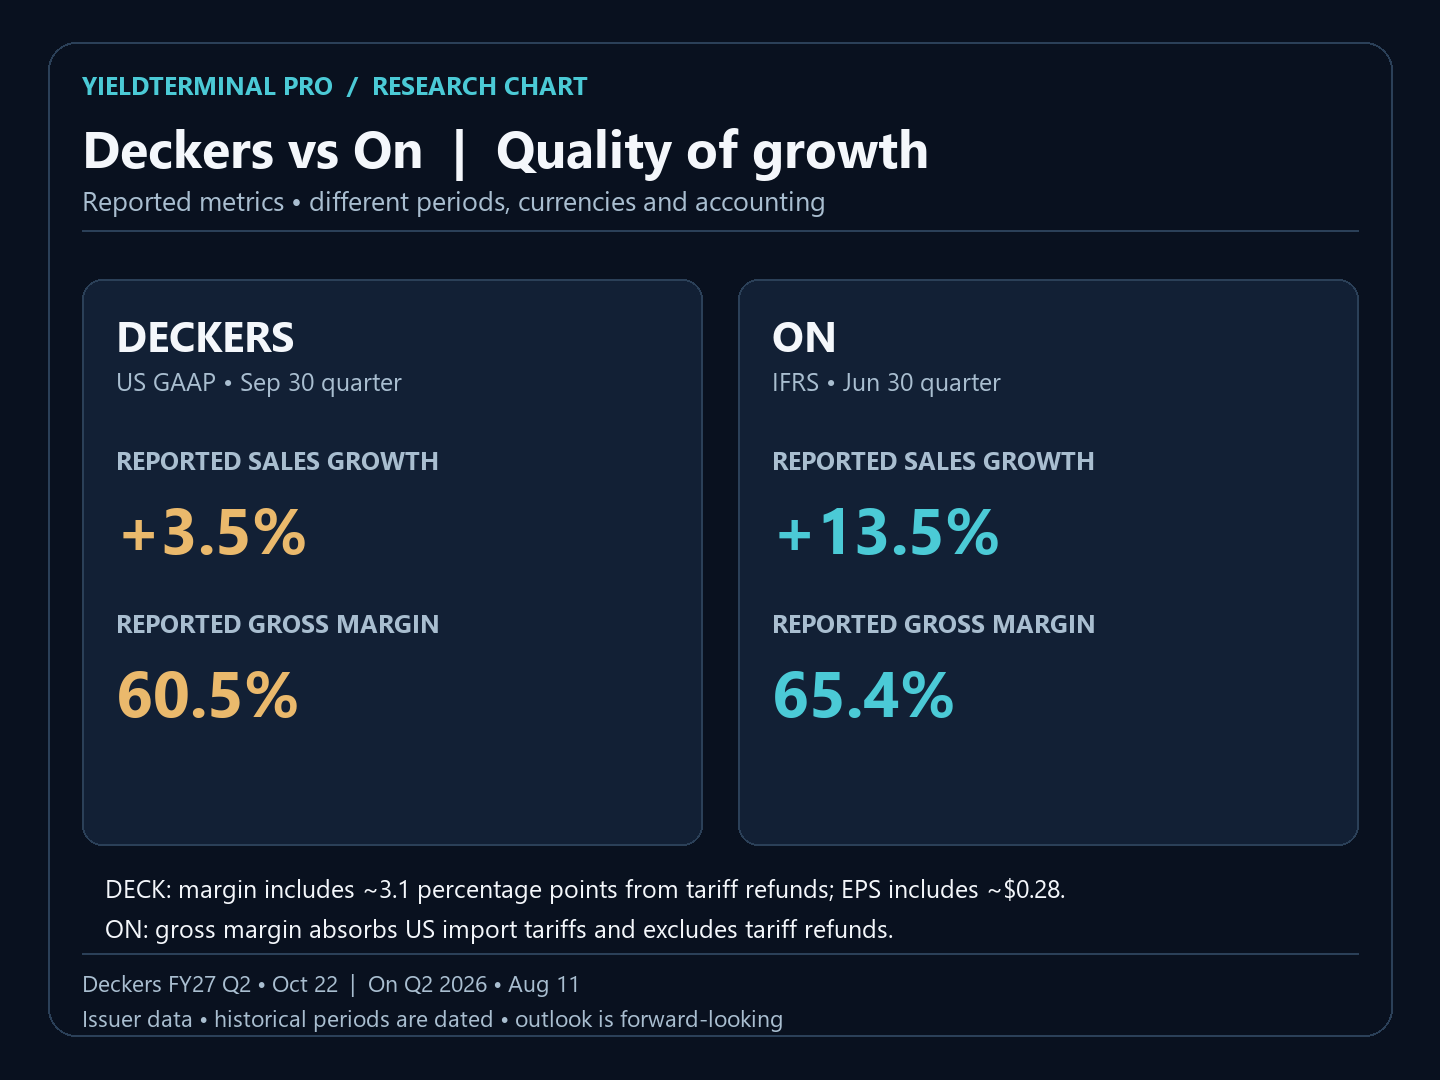
81.09 October 23 completed regular-session close; supporting financial or relative chart
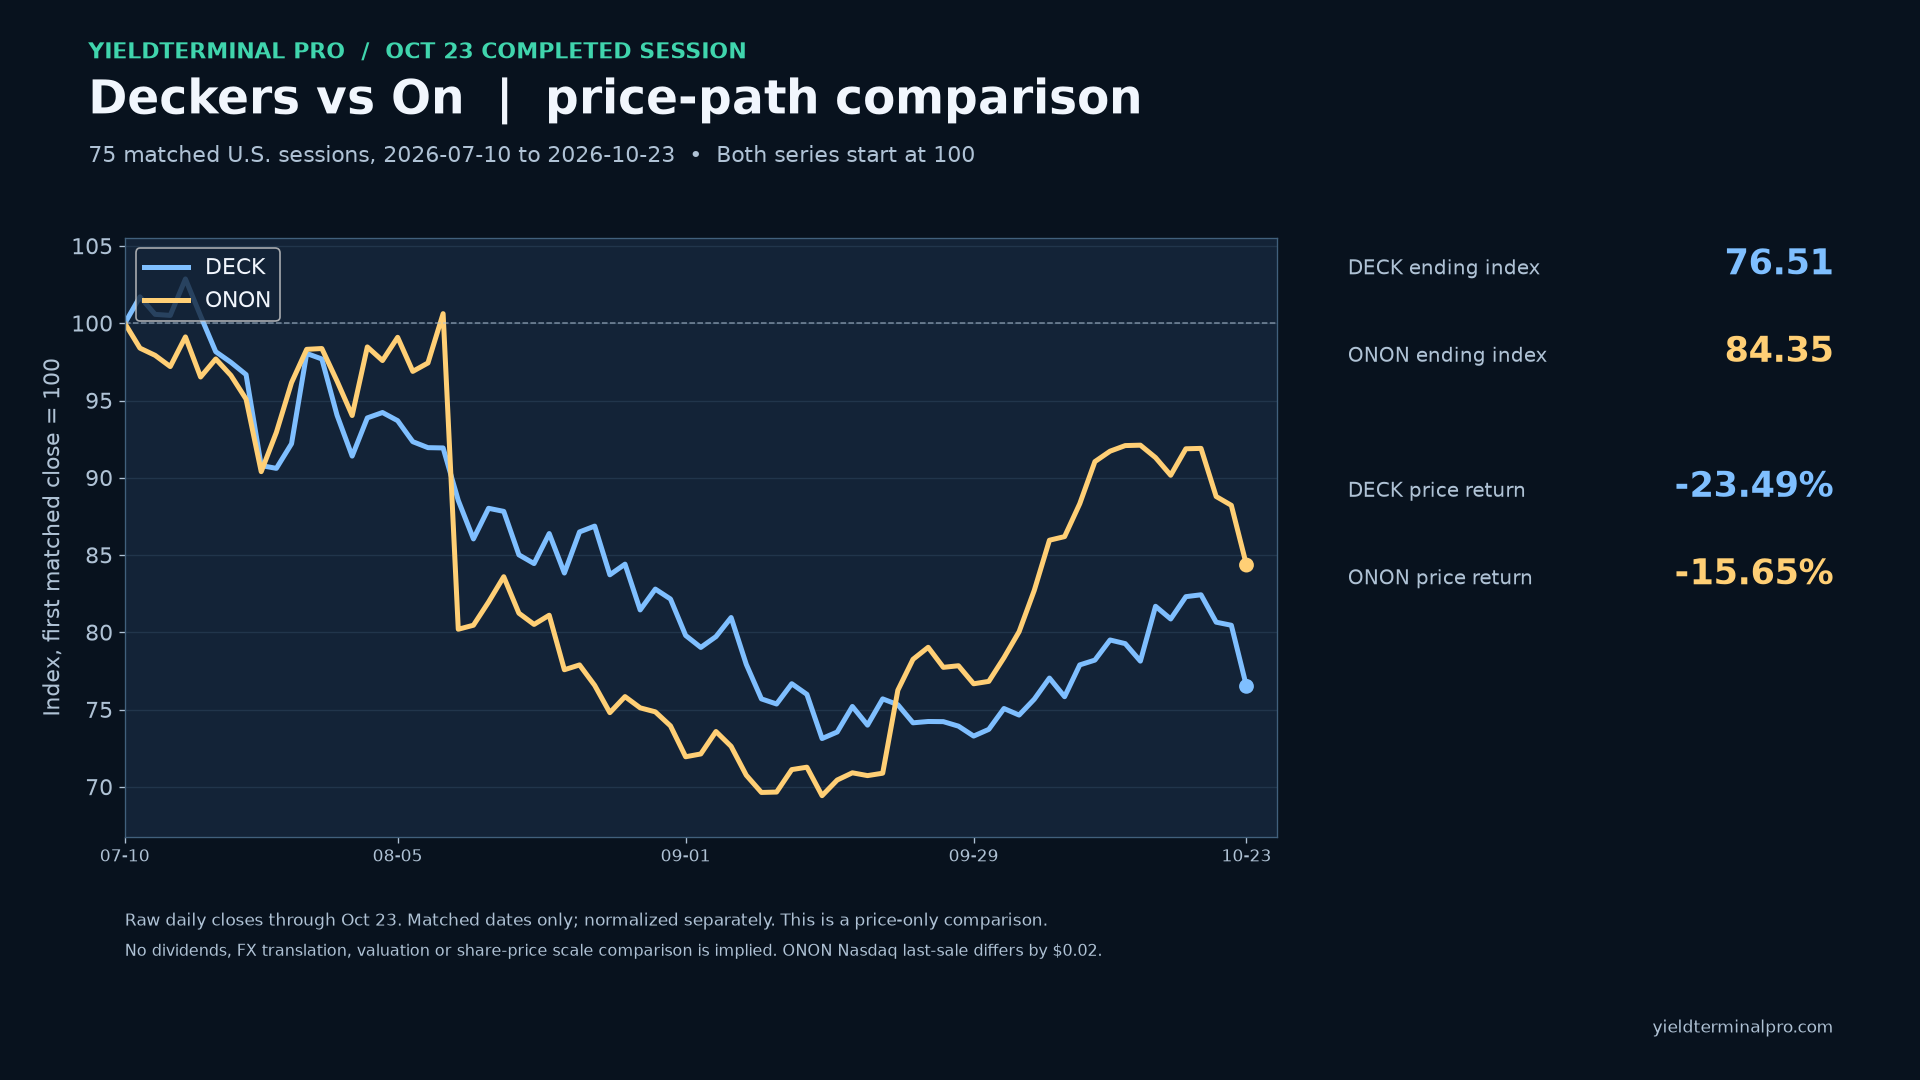
Matched-window U.S.-listed price-only comparison through October 23, excluding dividends; not a currency conversion or earnings scorecard.
No session has closed since this was published.
85.71 October 16 regular close
October 16 close $85.71 was above the 50-session SMA ($84.53) and below the 200-session SMA ($100.33). Earnings preview for October 19-23; historical levels do not bound an earnings gap.
| After | Close | vs Sat, 17 Oct 2026 close | vs published price |
|---|---|---|---|
| 1 session | 87.24 | — | +1.79% |
| 5 sessions | 81.09 | — | -5.39% |

See the full disclaimer.