Sun, 4 Oct 2026
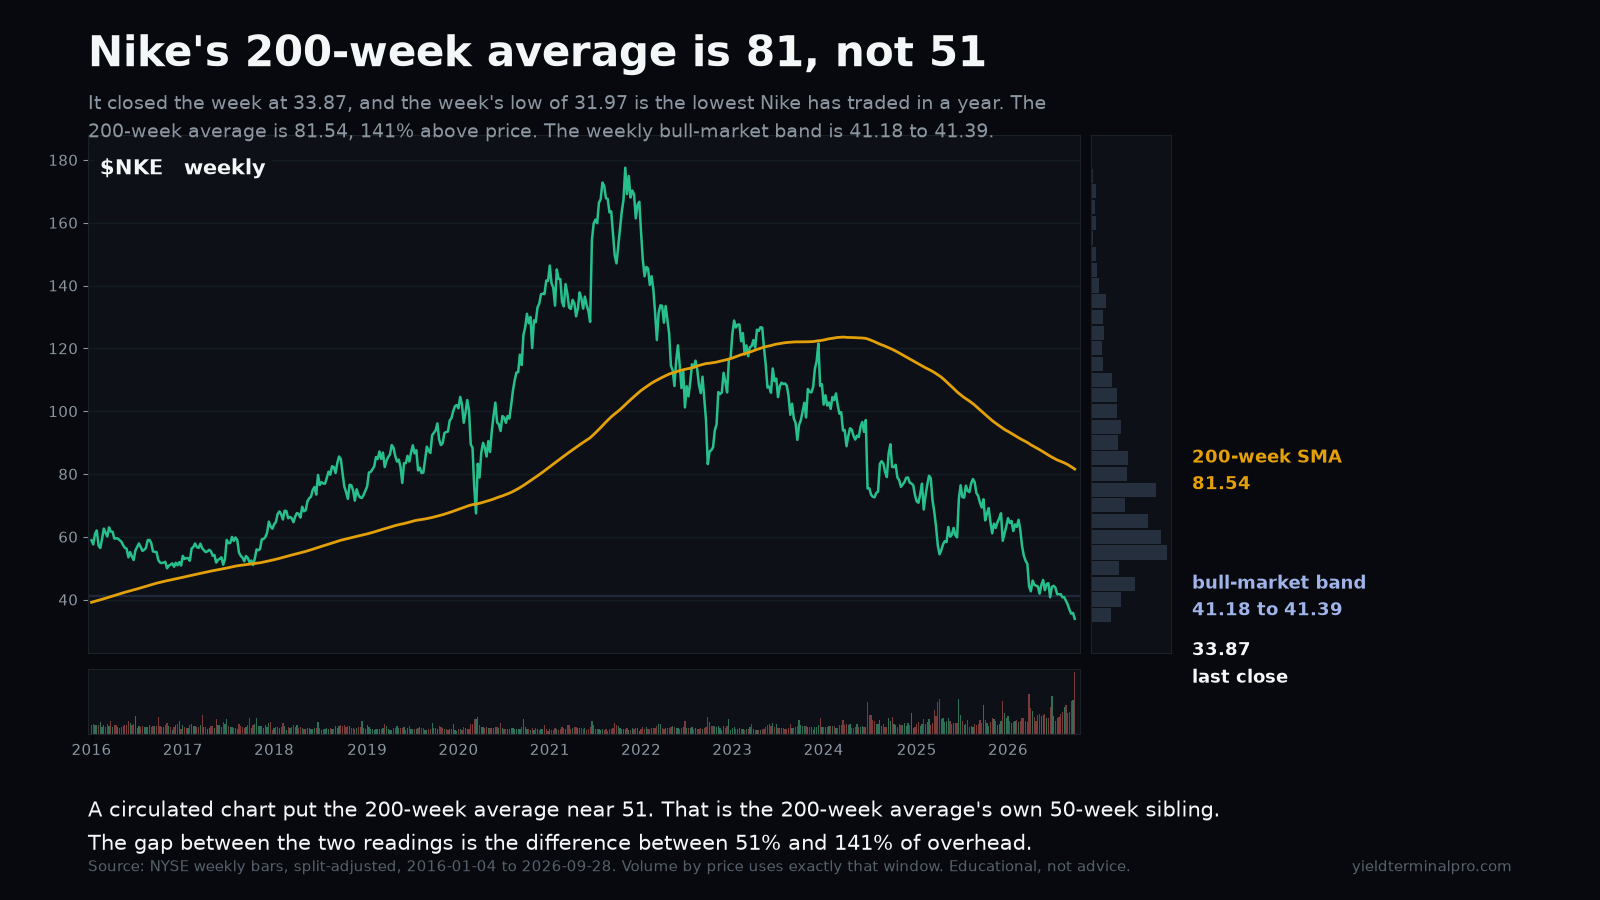
33.87 2 Oct weekly close
Nike's 200-week simple moving average is 81.54, which is 141% above the price. A circulated chart put that average near 51; 51.21 is the 50-week average, not the 200-week. The week's low of 31.97 is the lowest Nike has traded in a year.
| After | Close | vs Sun, 4 Oct 2026 close | vs published price |
|---|---|---|---|
| 1 session | 33.96 | — | +0.27% |
| 5 sessions | 34.71 | — | +2.48% |
- 200-week simple moving average 81.54 — published below, latest close below
- 50-week simple moving average 51.21 — published below, latest close below
- 52-week low 31.97 — published above, latest close above