Sun, 4 Oct 2026
237.69 2 Oct close
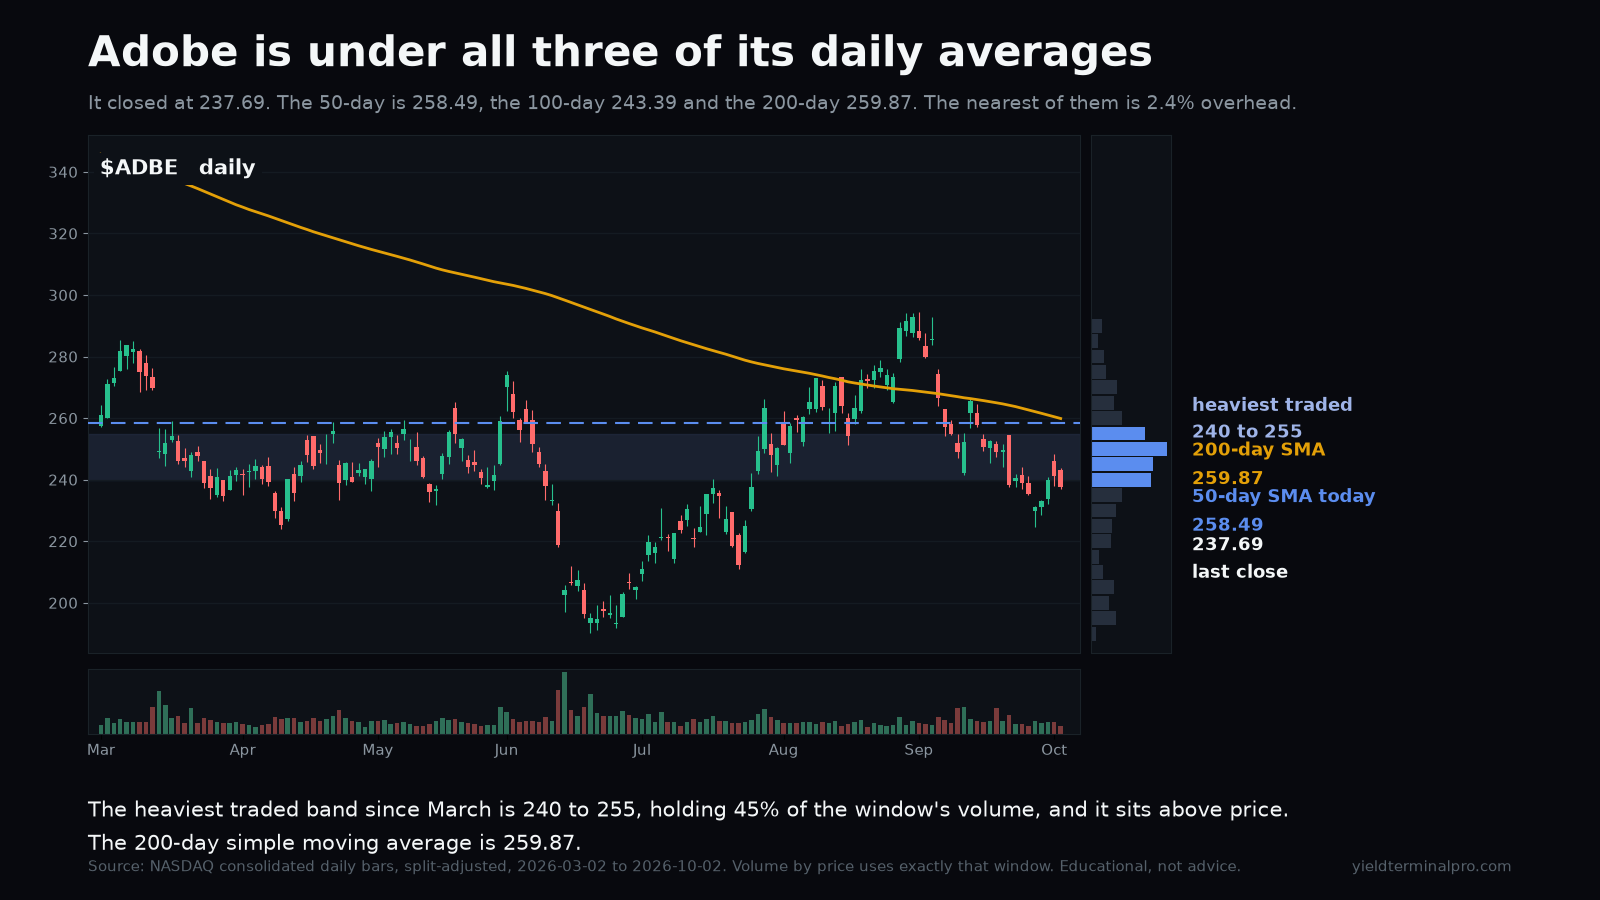
Adobe closed under all three of its daily averages, and the nearest of them is only 2.4% overhead. The heaviest traded band since March, 240 to 255, holds 45% of the window's volume and sits entirely above the close.
| After | Close | vs Sun, 4 Oct 2026 close | vs published price |
|---|---|---|---|
| 1 session | 238.79 | — | +0.46% |
| 5 sessions | 242.27 | — | +1.93% |
- 100-day simple moving average 243.39 — published below, latest close below
- 50-day simple moving average 258.49 — published below, latest close below
- 200-day simple moving average 259.87 — published below, latest close below
- Heaviest traded band 240.00 — published below, latest close below