← All daily levels

Daily Levels, Fri, 6 Nov 2026

Charts through the November 5 regular-session close

Educational commentary, not investment advice.

Completed daily charts for November 6 video subjects; company reports followed the charted November 5 close.

Get the week in one email

Every level we marked, and what price did next. Free, Sundays.

Subscribing signs you up for the free YieldTerminal Sunday recap, one email a week. Educational only, not financial advice. Unsubscribe any time.

$NETCloudflare
244.51November 5 regular-session close

The November 5 close was below both the 50-day and 200-day averages before the earnings release.

50-day SMAAbove the November 5 close
319.00
200-day SMAAbove the November 5 close
249.77

Levels measured over 50 and 200 completed daily regular-session closes through November 5, 2026. A level measured over a different window can be a different number.
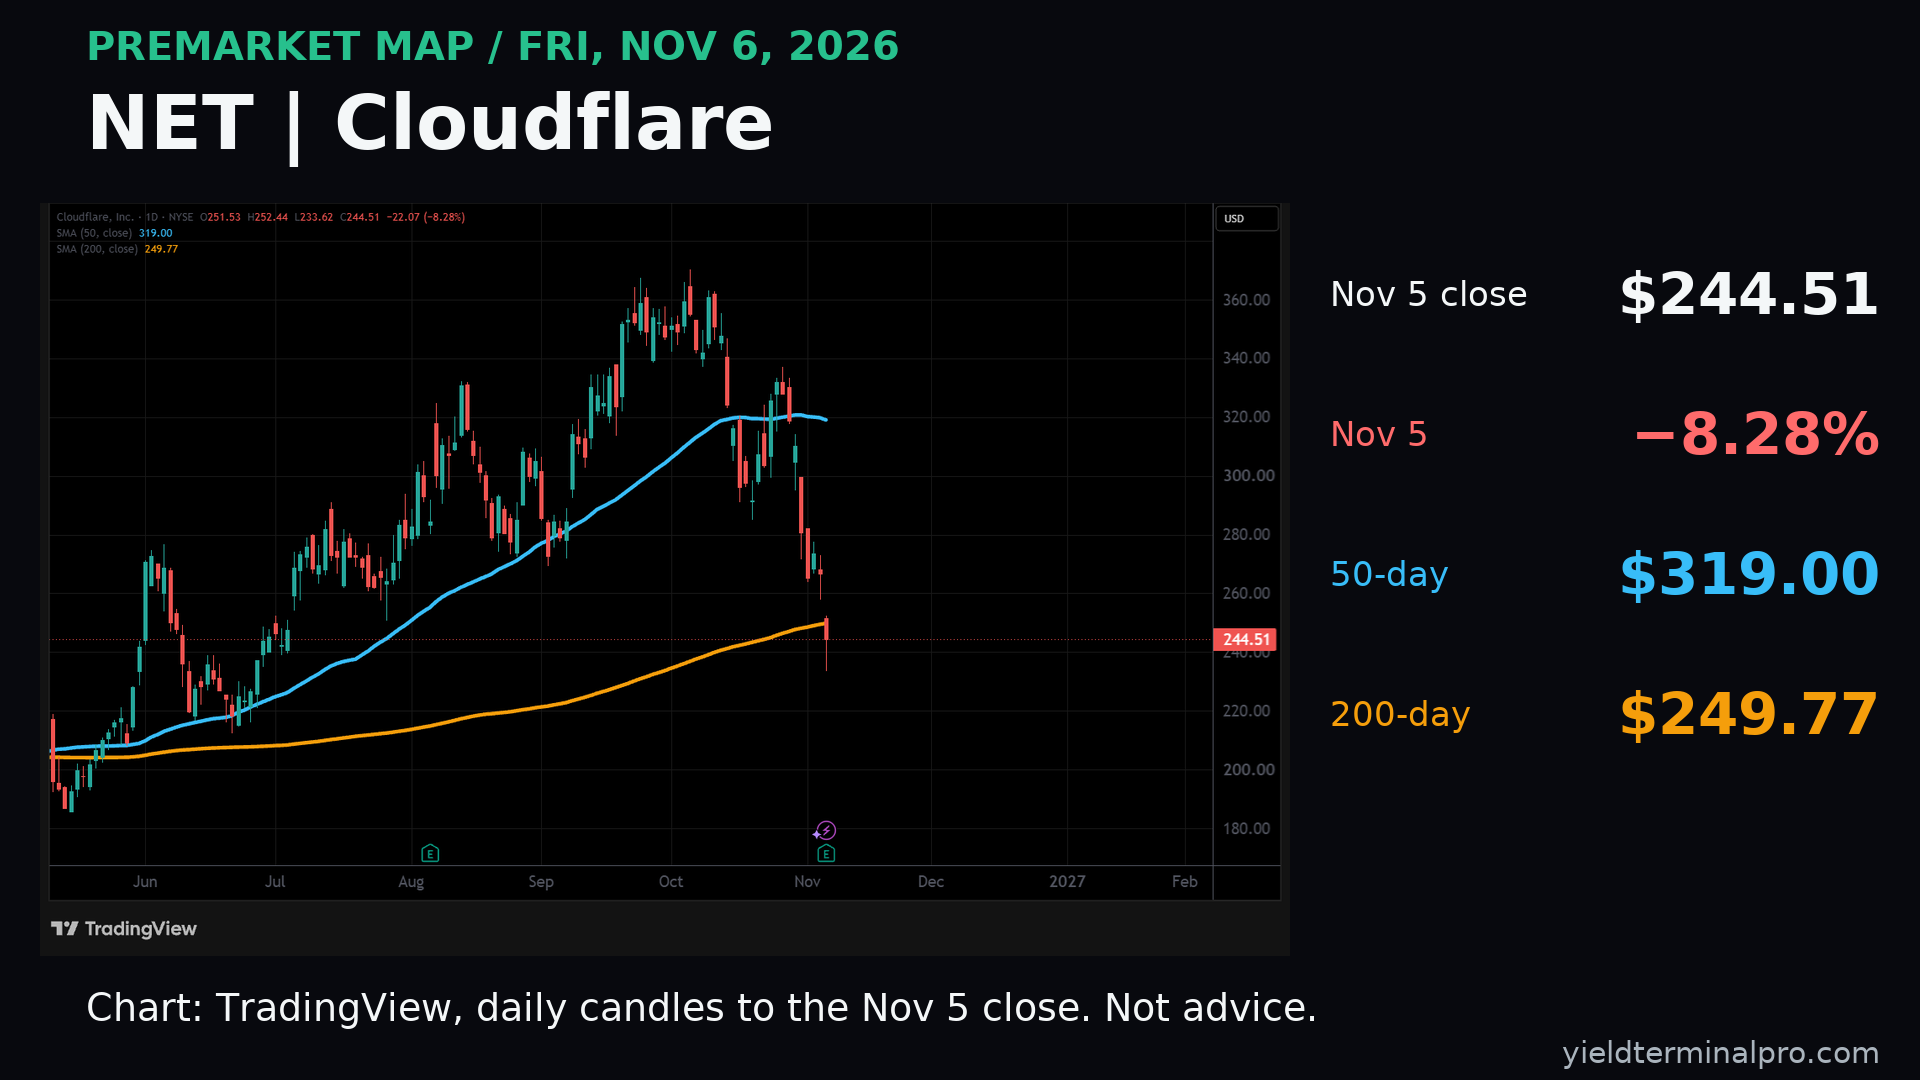
NET chart
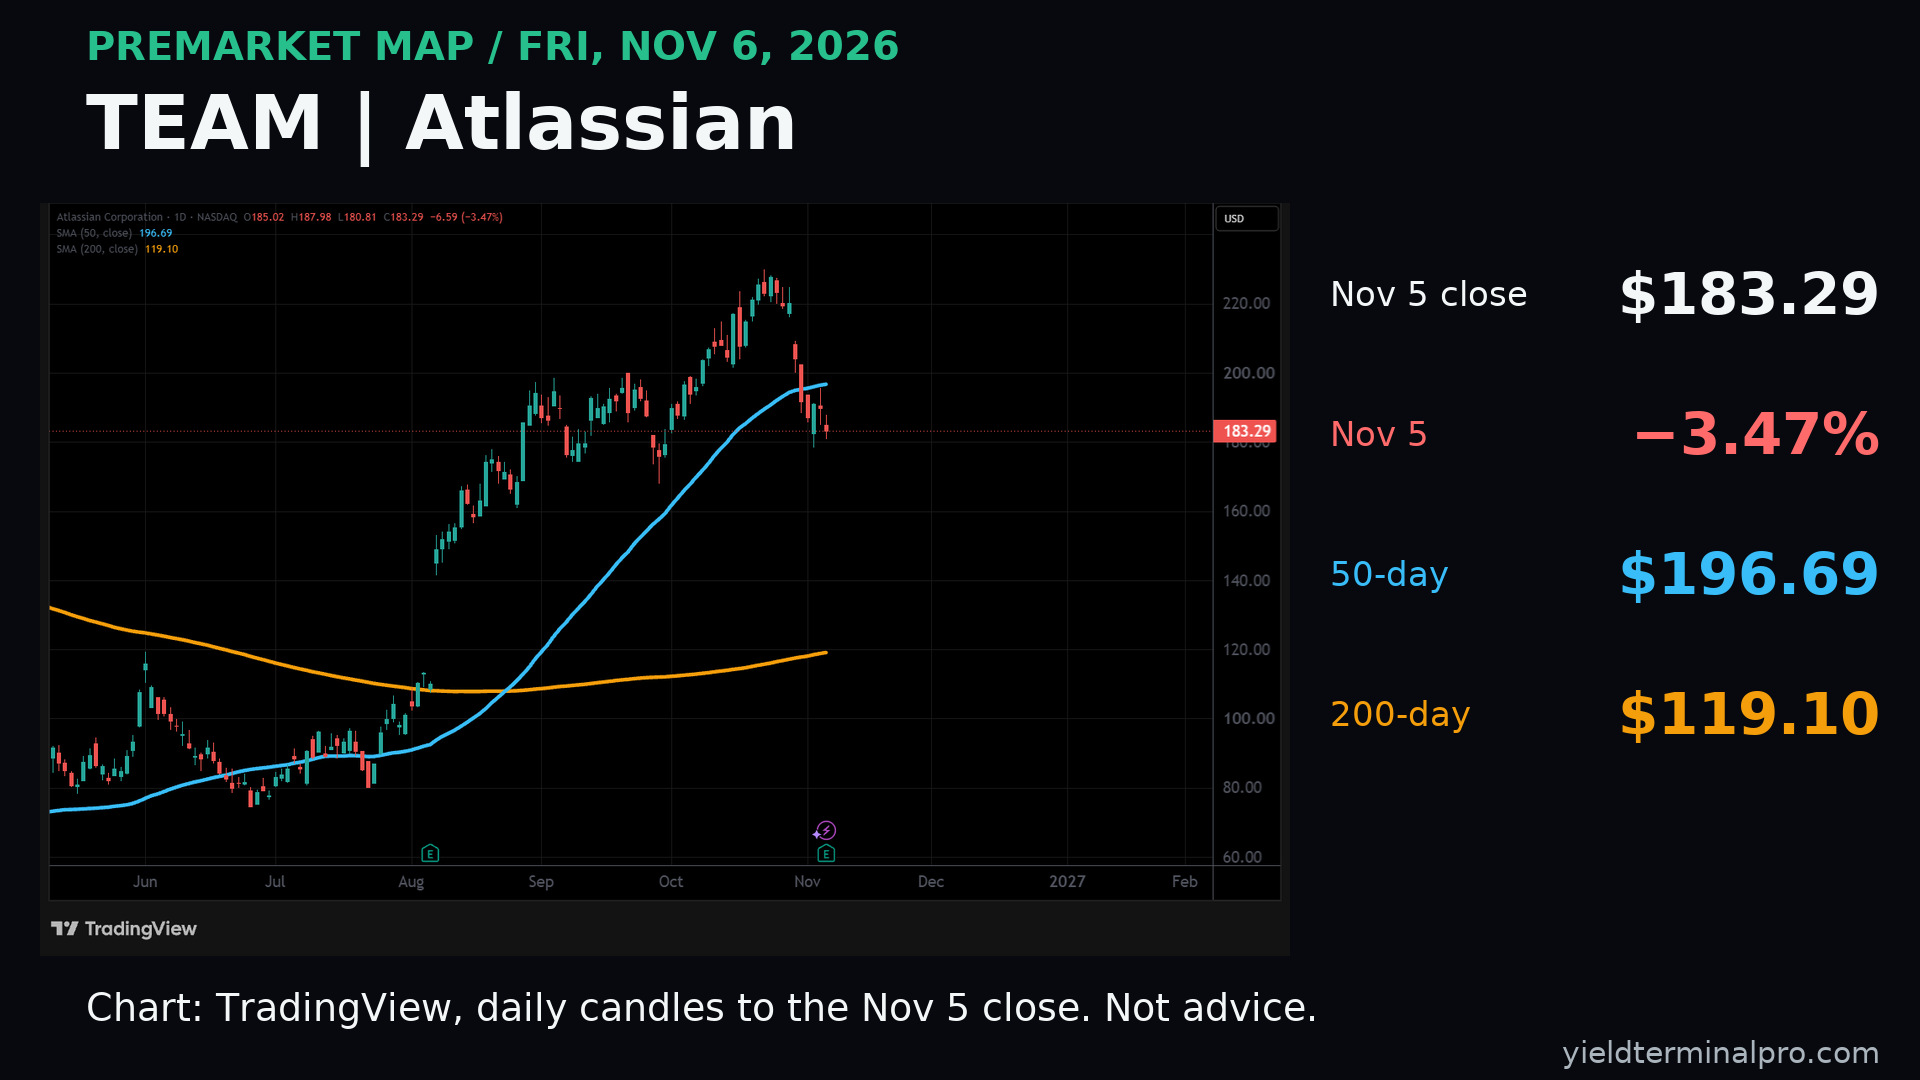
$TEAMAtlassian
183.29November 5 regular-session close

The November 5 close was below the 50-day average and above the 200-day average before the earnings release.

50-day SMAAbove the November 5 close
196.69
200-day SMABelow the November 5 close
119.10

Levels measured over 50 and 200 completed daily regular-session closes through November 5, 2026. A level measured over a different window can be a different number.
TEAM chart
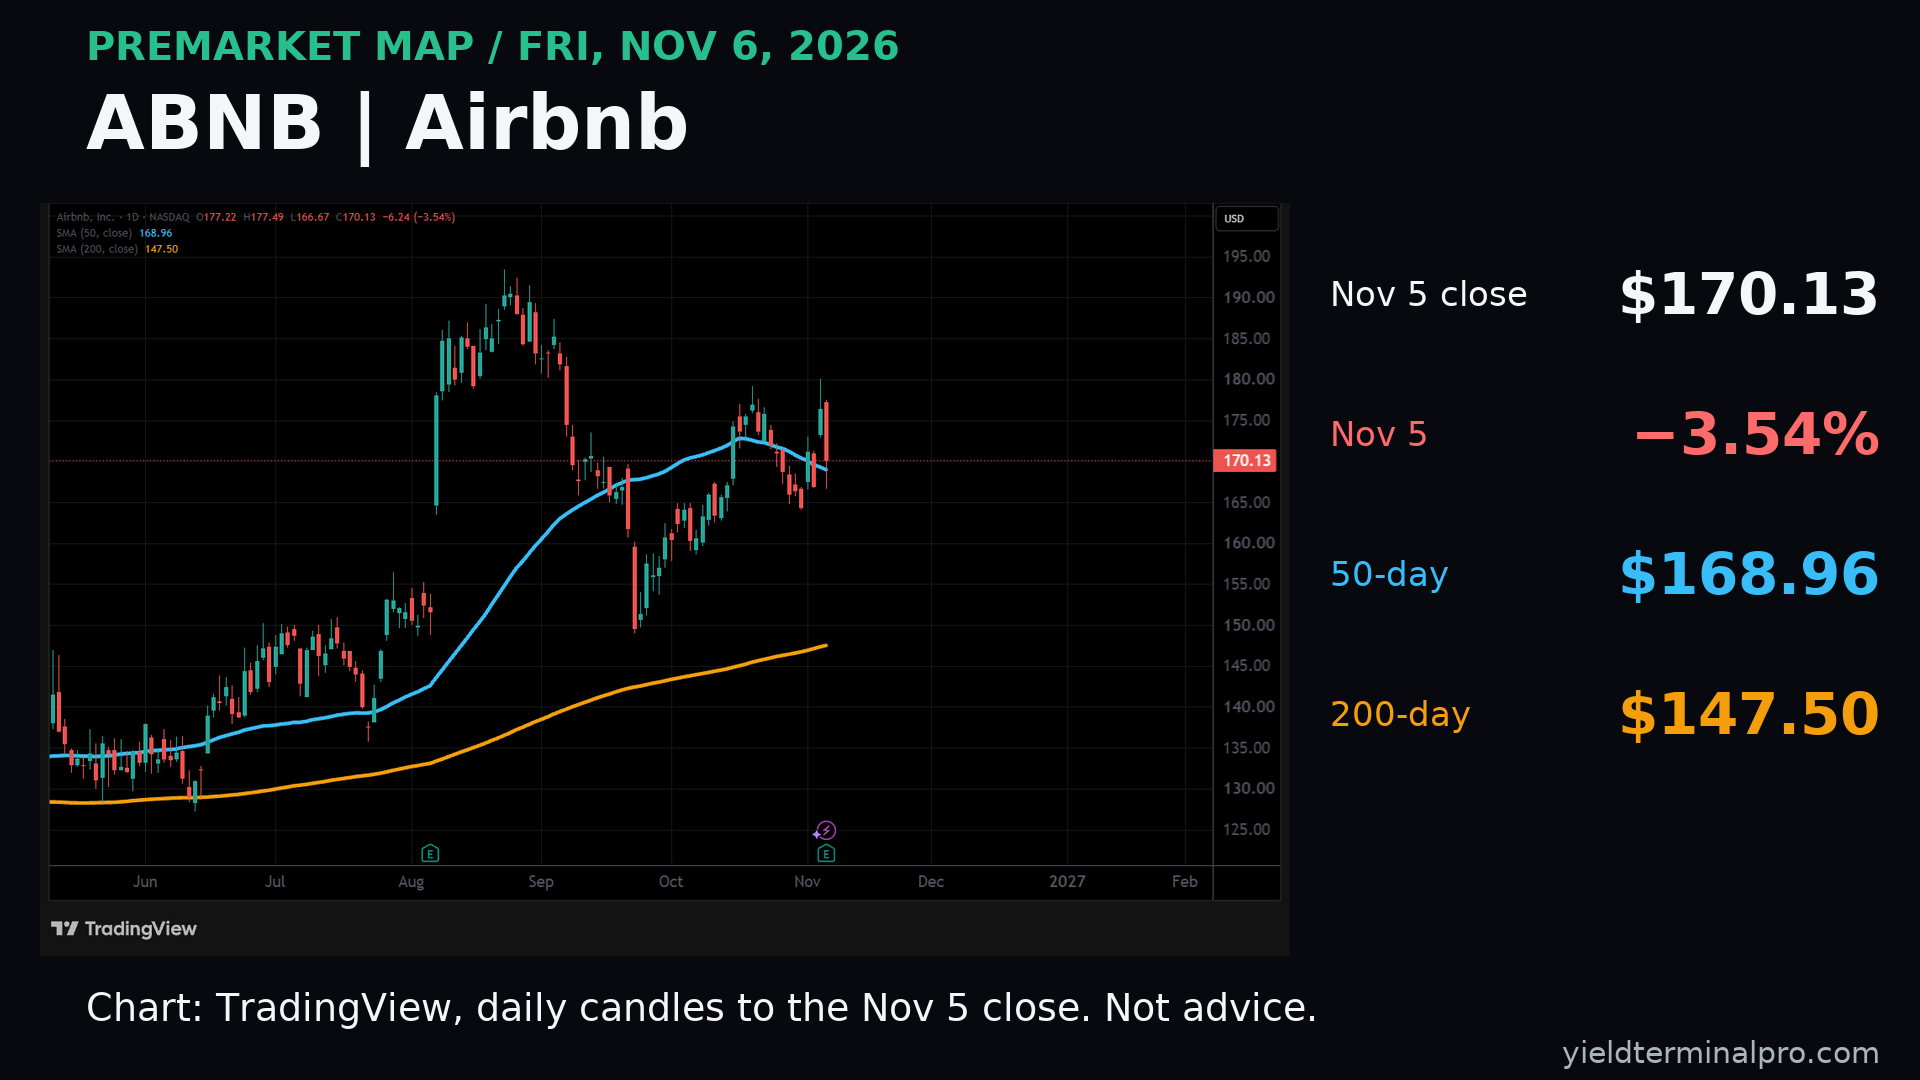
$ABNBAirbnb
170.13November 5 regular-session close

The November 5 close was above both the 50-day and 200-day averages before the earnings release.

50-day SMABelow the November 5 close
168.96
200-day SMABelow the November 5 close
147.50

Levels measured over 50 and 200 completed daily regular-session closes through November 5, 2026. A level measured over a different window can be a different number.
ABNB chart
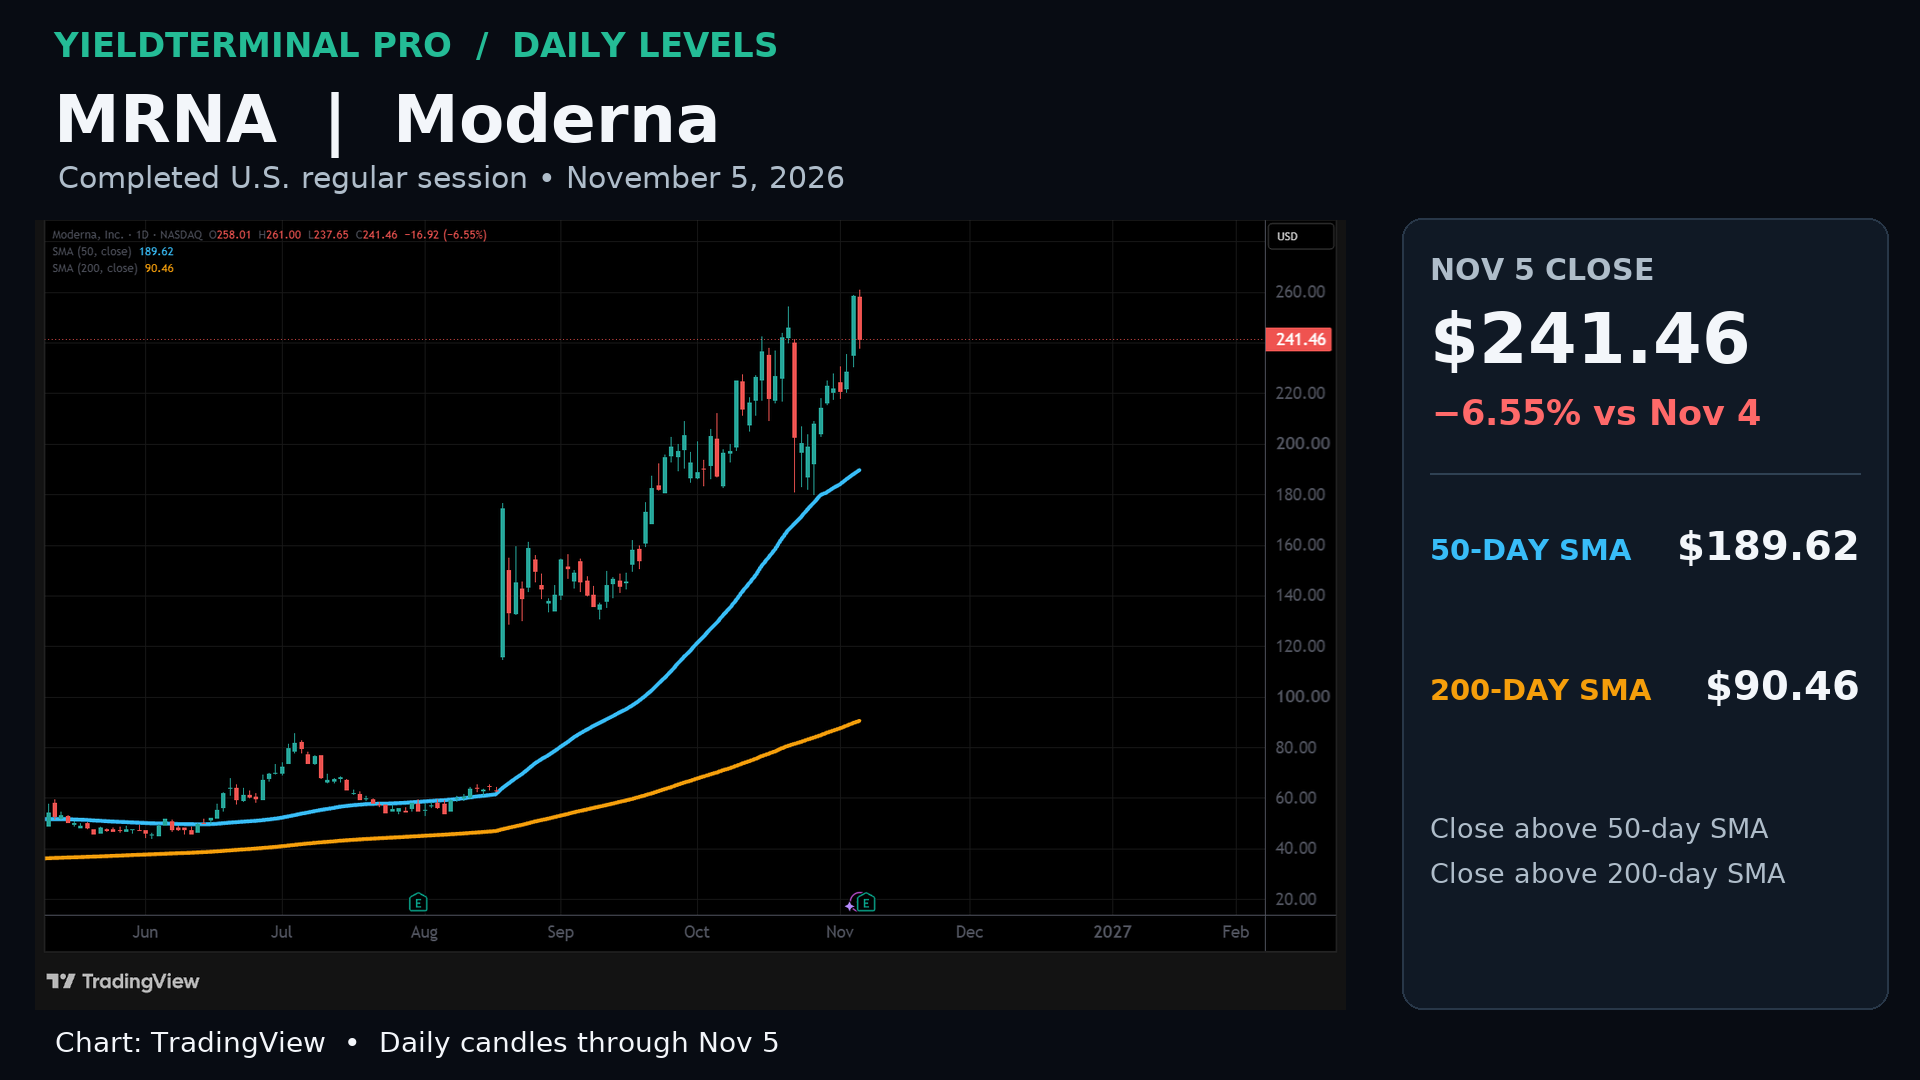
$MRNAModerna
241.46November 5 regular-session close

The November 5 close was above both the 50-day and 200-day averages before the earnings release.

50-day SMABelow the November 5 close
189.62
200-day SMABelow the November 5 close
90.46

Levels measured over 50 and 200 completed daily regular-session closes through November 5, 2026. A level measured over a different window can be a different number.
MRNA chart
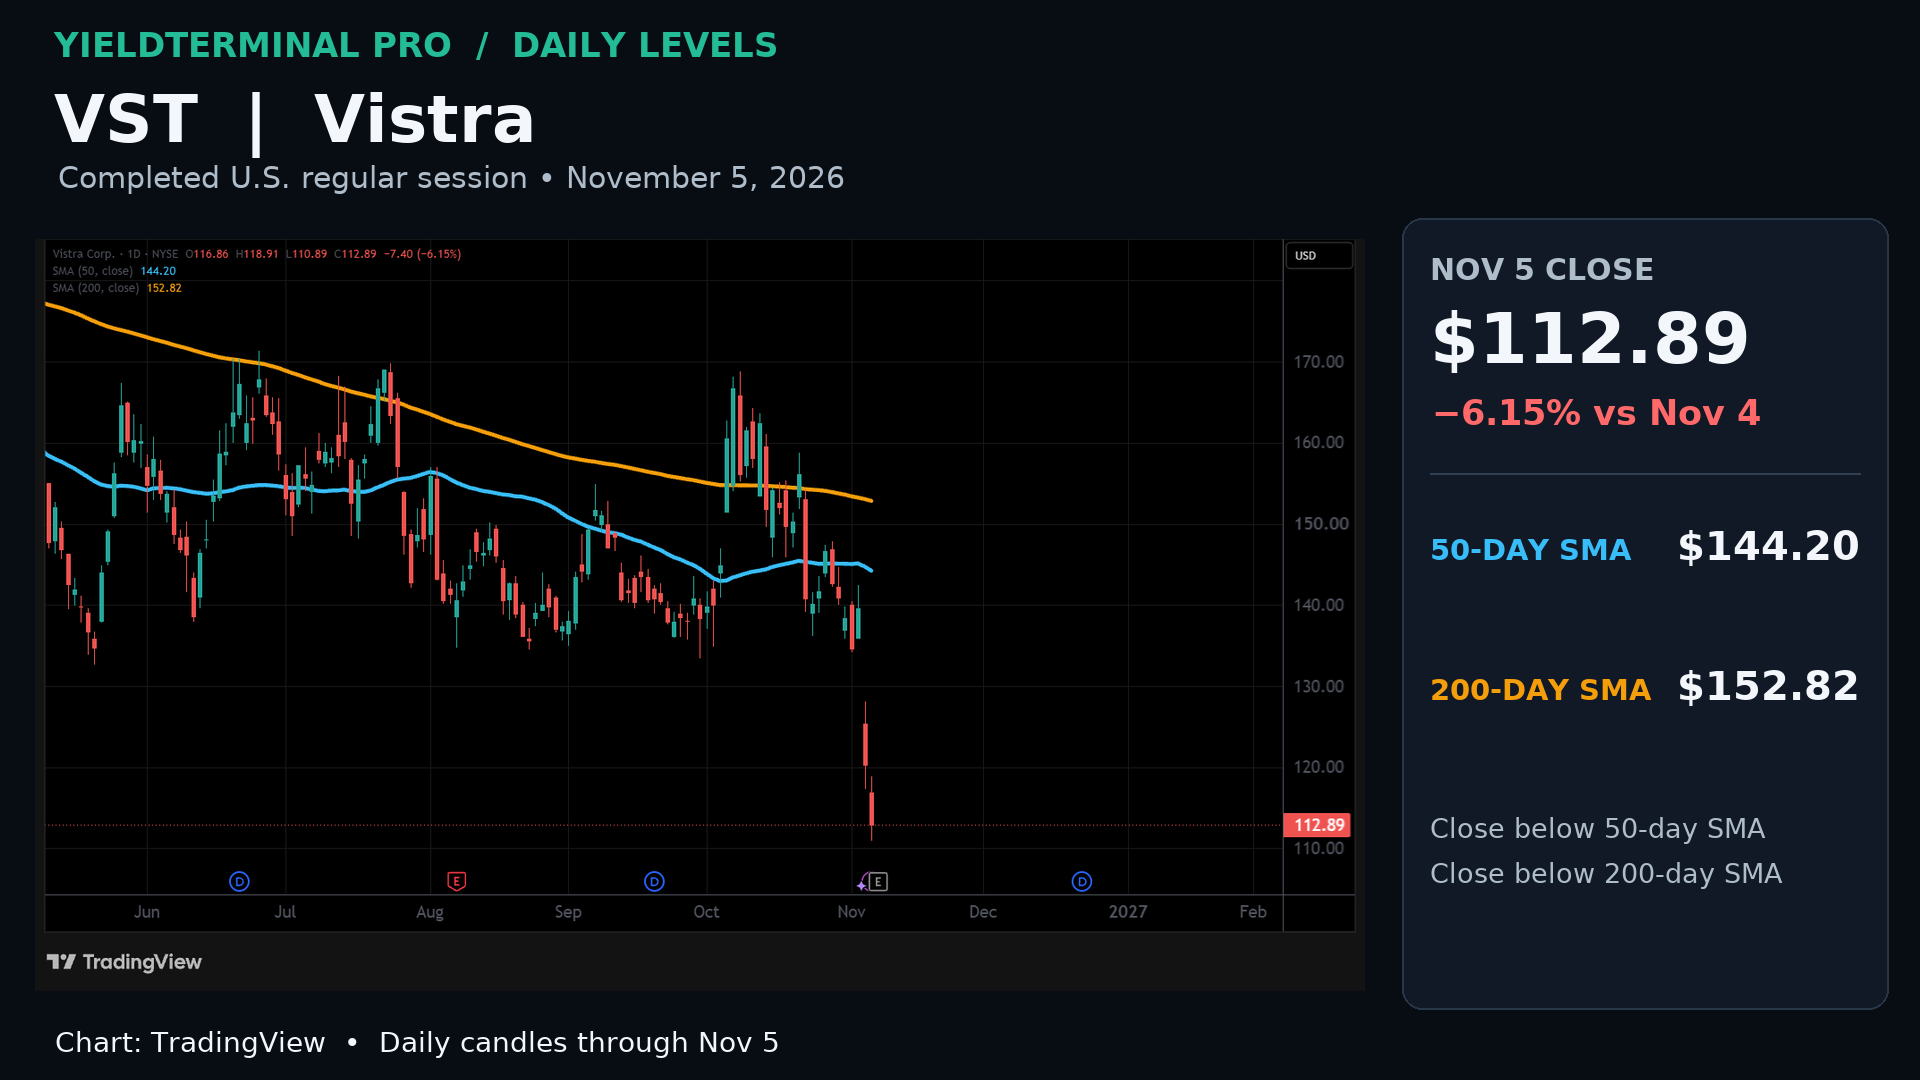
$VSTVistra
112.89November 5 regular-session close

The November 5 close was below both the 50-day and 200-day averages before the earnings release.

50-day SMAAbove the November 5 close
144.20
200-day SMAAbove the November 5 close
152.82

Levels measured over 50 and 200 completed daily regular-session closes through November 5, 2026. A level measured over a different window can be a different number.
VST chart
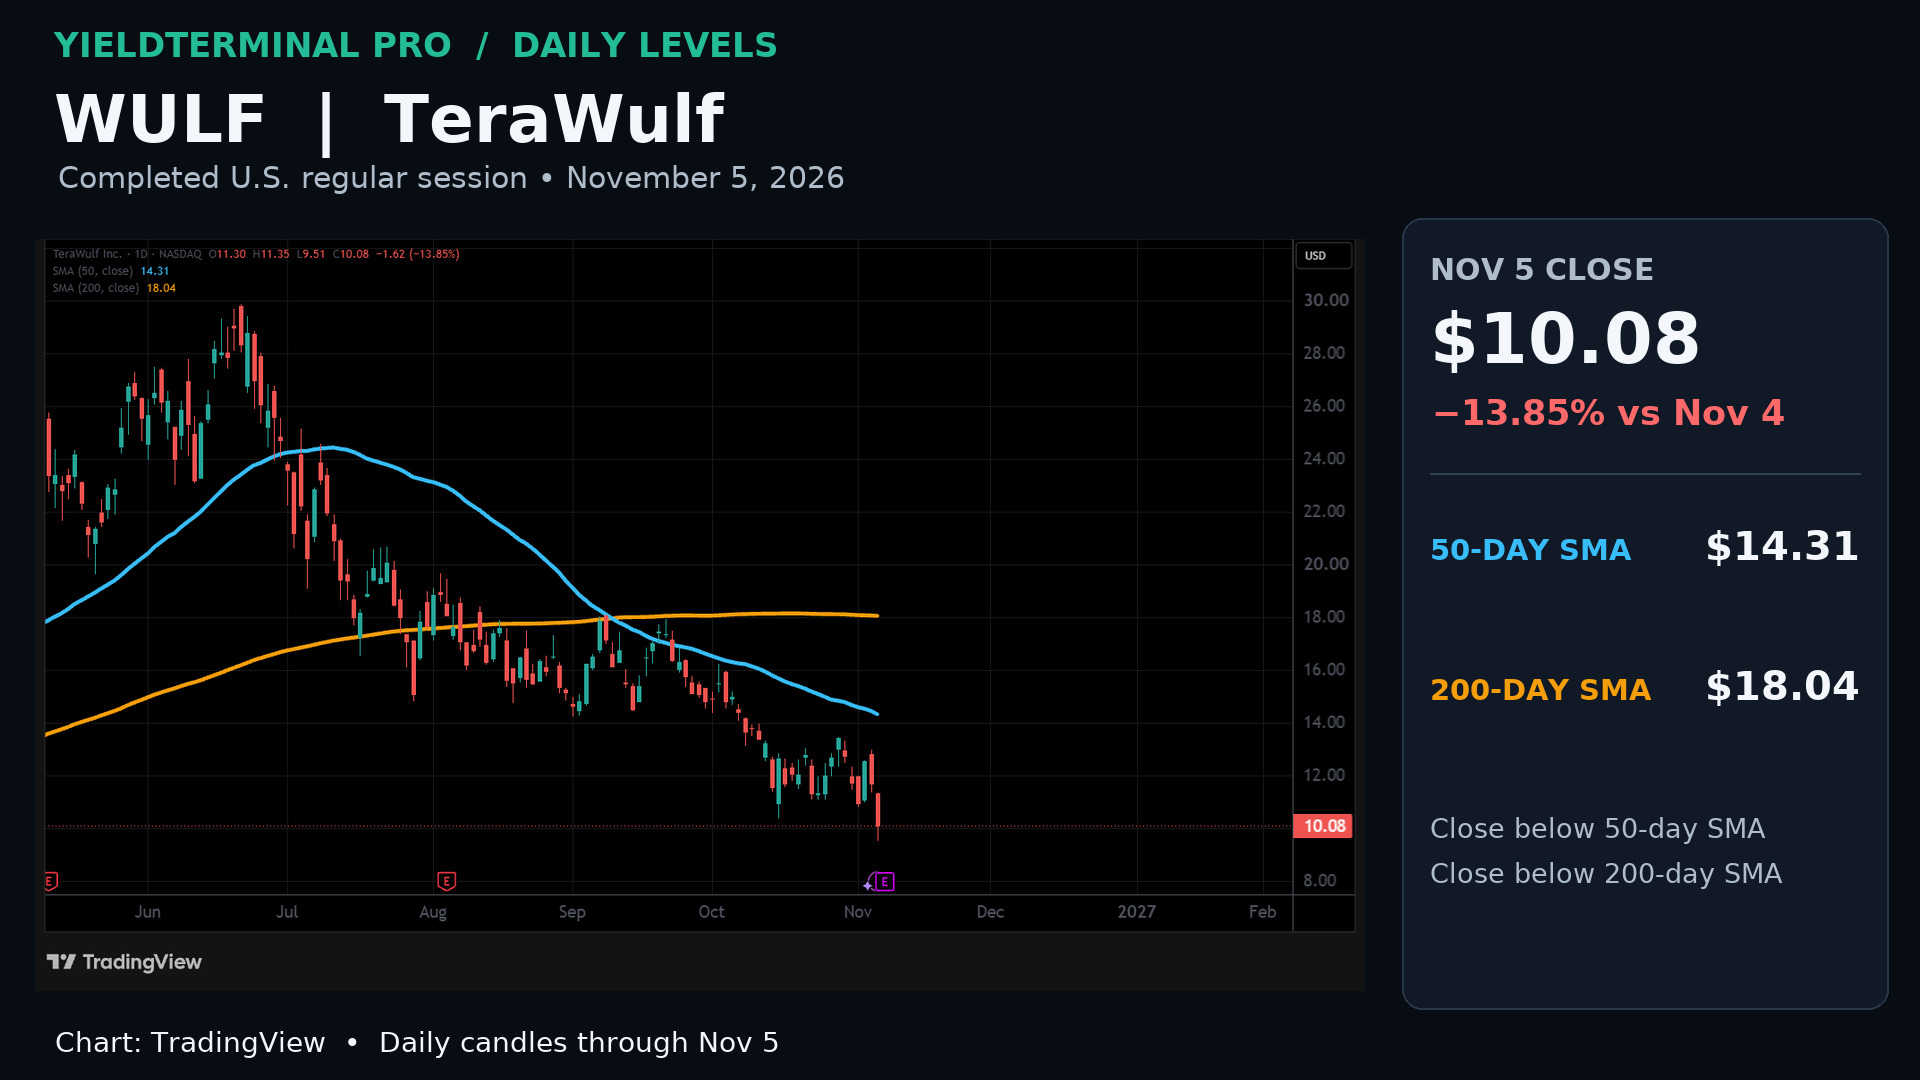
$WULFTeraWulf
10.08November 5 regular-session close

The November 5 close was below both the 50-day and 200-day averages before the earnings release.

50-day SMAAbove the November 5 close
14.31
200-day SMAAbove the November 5 close
18.04

Levels measured over 50 and 200 completed daily regular-session closes through November 5, 2026. A level measured over a different window can be a different number.
WULF chart
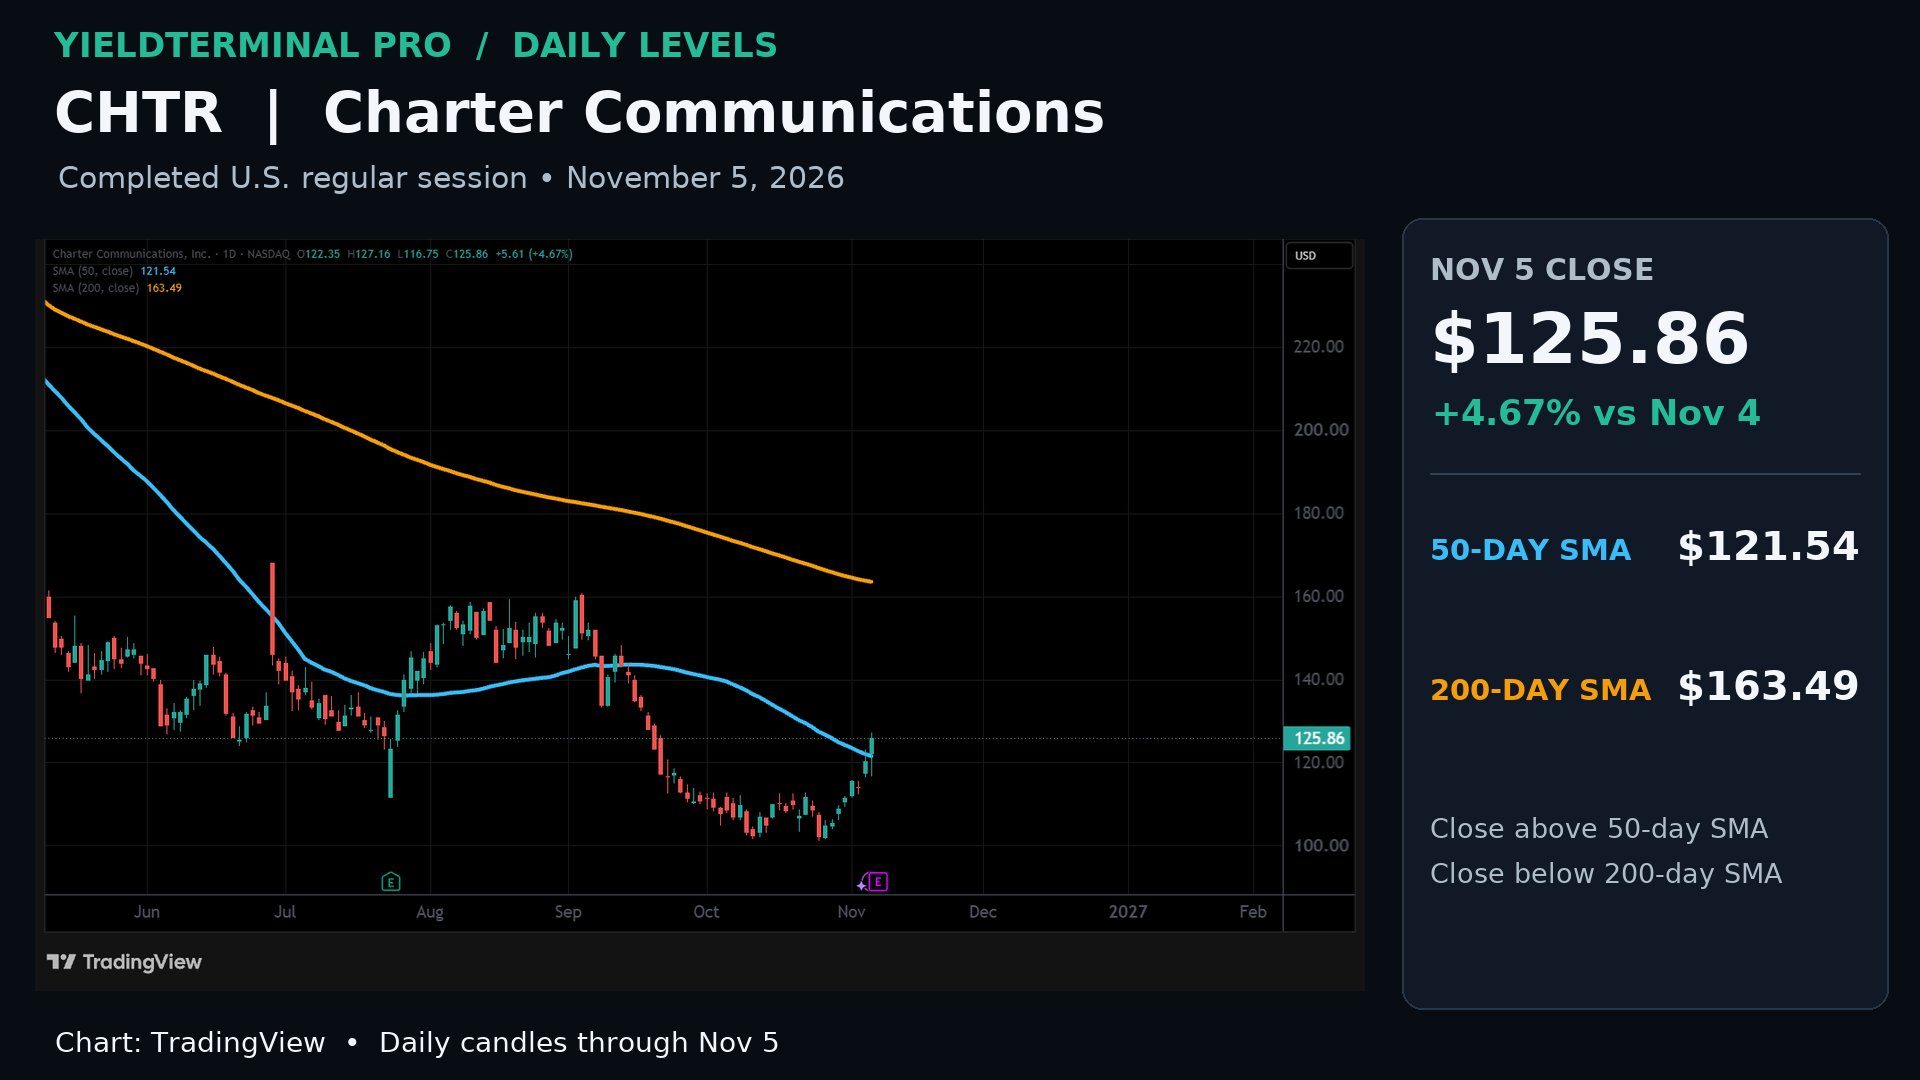
$CHTRCharter Communications
125.86November 5 regular-session close

The November 5 close was above the 50-day average and below the 200-day average before the earnings release.

50-day SMABelow the November 5 close
121.54
200-day SMAAbove the November 5 close
163.49

Levels measured over 50 and 200 completed daily regular-session closes through November 5, 2026. A level measured over a different window can be a different number.

CHTR chart

See the full disclaimer.